Welcome to the Artificial Intelligence Outlook for Forex trading.
VIDEO TRANSCRIPT
U.S. Dollar Index ($DXY)
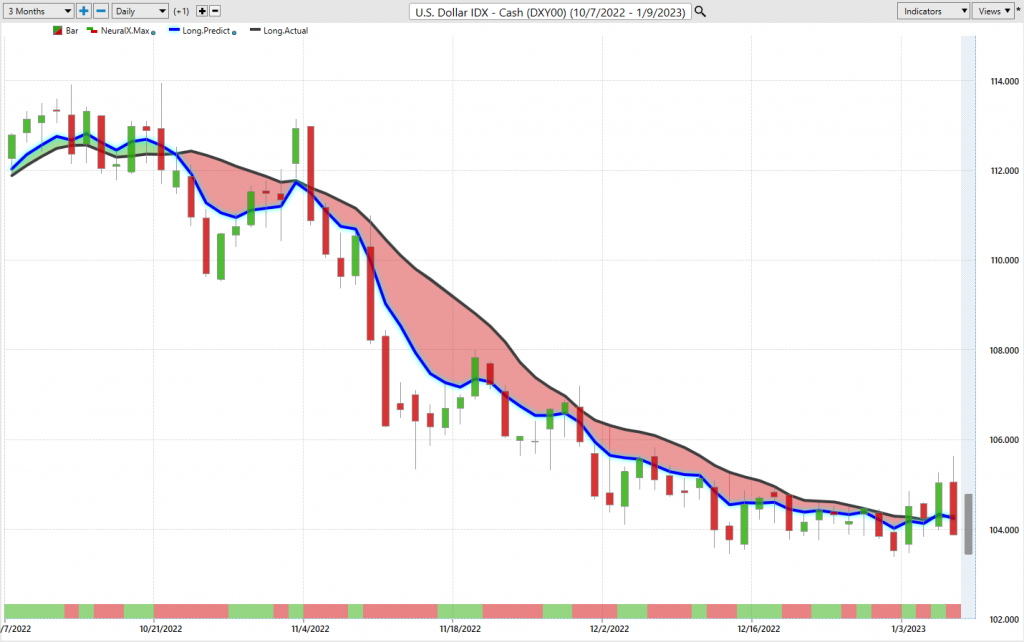
Hello, everyone, and welcome back. My name is Greg Ferman, and this is the VantagePoint AI Market Outlook for the week of January the 9th, 2023. Now to get started this week, we’re looking at, again, the Dollar index, where we begin a major driver of the global markets. So what we see here now with the VantagePoint software, the indicators are point in time. We have our weekly, our monthly, and our yearly opening price, all converging, as you can see, around $103.66. This is the critical level we’ll be watching to begin the week. We’re closing the week below $104.51, which is technically bearish on the Dollar, but we need to break down under $103.66 In order for the Dollar losses to accelerate.
Now, we do have the CPI number coming out, I believe, Thursday next week, and this will be a major driver of equities, commodities and, of course, the Dollar. But the current situation starting into next week, we have our Neural Index down, Neural Index strength is down, and our predicted differences are also pointing down, but right around the zero line by clearly a bearish tone, despite that very, very good payroll number on Friday.
S&P 500 Index
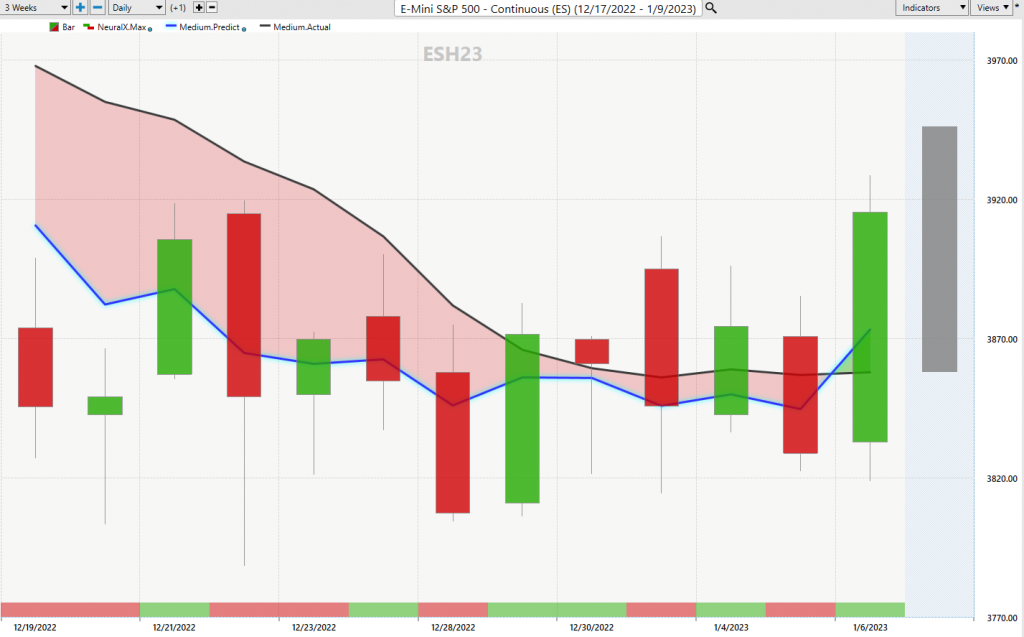
Now, the stock markets, we’ve got a very similar situation. The yearly opening price is a very, very important level at this time of year as the market tries to carve out a trend. We don’t have that trend yet, but right now, the S&P 500 has closed above the yearly opening price, $3853, but just barely. Once again, we’re closing $38.95. Not a definitive move at this particular time, but the predicted low for Monday is $38.42. This is a very key level that you want to watch. Now, their T-cross long is coming in at or about, when we look at this right here, we can bring this in, our T-cross long $38.62. The yearly and monthly opening price, they’re coming in basically at or about $38.53. So all of the support is pre-identified. The indicators in VantagePoint are bullish on the equity markets. For next week, our Neural Index is up, Neural Index strength is up, and our predicted differences are rising with a medium-term crossover recently taking place, but we must hold above this critical $38.53.
Gold
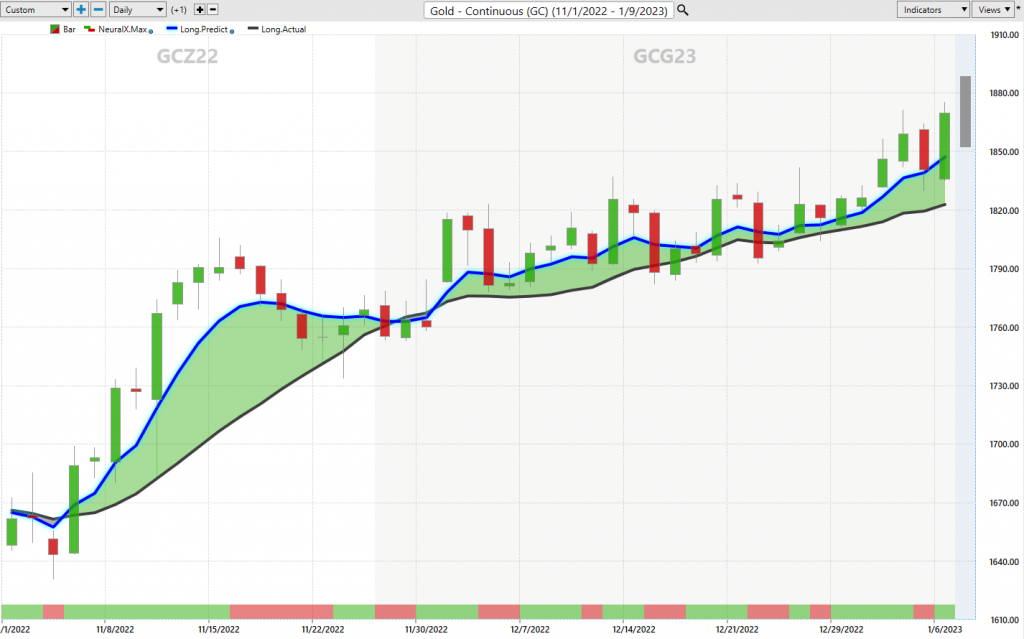
Now, as we look at gold prices into next week, gold remains bullish on the year. We’ve got a clean break holding above the VantagePoint T-cross long, we’re holding above our yearly opening price. As you can see, $18.24. This is the critical level we want to look at in 2023 is can we hold above $18.24, and of course, the VPT-cross long? Now, if the predicted moving average crosses over the yearly opening price, that’s usually a very bullish signal, so watch for that. But again, right now, the indicators remain bullish for now on gold going into at least next week.
Bitcoin
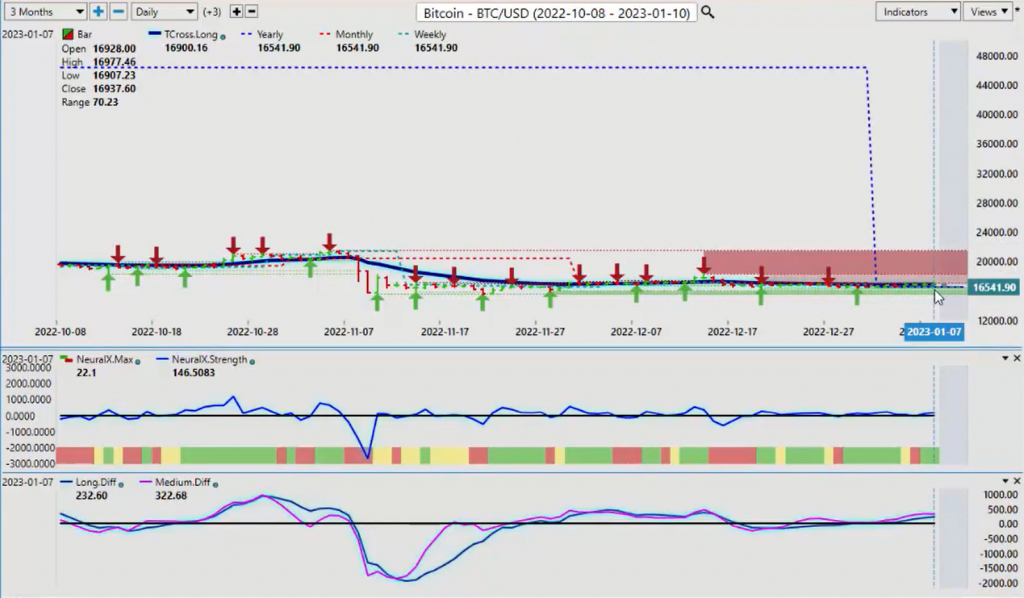
Now, Bitcoin, once again, dead flat, don’t have a lot of buyers or sellers. But what I can tell you, despite everything you’ve heard, things you’ve been told, Bitcoin is 90% correlated to the global indexes, mainly the S&P 500. So if it moves higher, Bitcoin’s going to follow. We have a buy signal on the S&P 500. If it does move higher, then Bitcoin will do the same. The yearly opening price, a very big deal here, guys, $16,541.00. Our T-cross long, $16,900.00. If we could hold above these two levels next week, we could see Bitcoin extend higher, possibly to our first resistance zone high at $18,335.00. I would particularly watch for that move, but it will be dependent on the global stock markets, that main inner-market correlation.
Crude Oil
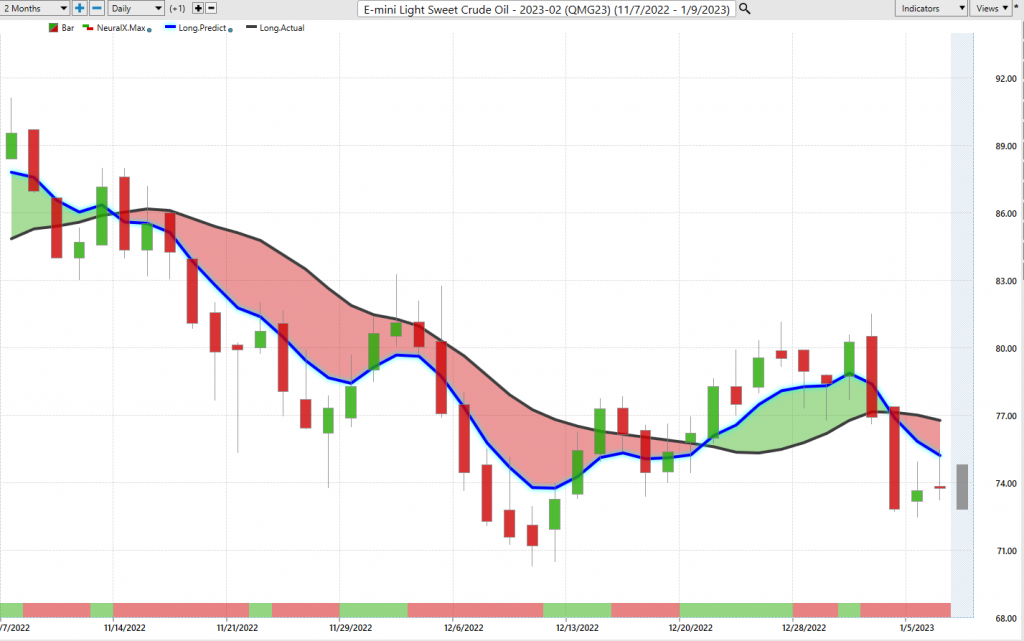
Now with Light Sweet Crude Oil, still struggling here, and that’s coming off of 2022, but 2023, not starting great for oil. The yearly opening price here, $80.57, T-cross long, $77.91. So your sell points are $77.91 up to $80.57, and stops above $80.57. The indicators on VantagePoint are mixed. Our Neural Index strength is pointing up, but we’ve got a caution sign of a yellow. Predicted differences are still down, but they’re flattening out. So again, if globally we go into a recession, then that’s not going to bode well for oil. The main primary sell signal on oil occurred back here, again in early April, or excuse me, early November, so we’ve had a couple of good retracement points, mean revision replacements back to the T-cross long, only to have multiple failures in that particular area. But now again, to start the year, $80.57 is the key level you want to watch.
Euro versus U.S. Dollar
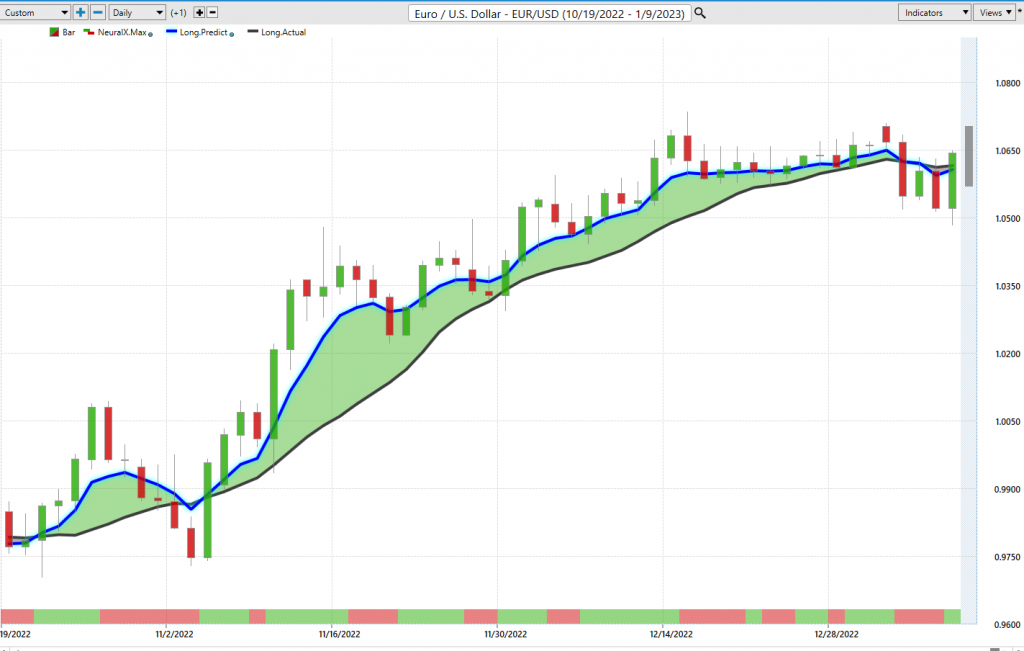
Now, if the Dollar index continues to slide next week, the Euro will rise. The yearly opening price coming in at approximately $107.00. I would look for a potential move on the Euro towards the $108.00 area before we sell off near the end of the month. The seasonal pattern in the Dollar, it’s usually strong from late January, early February into about April. We’ll see if that seasonality comes to fruition, but for now, the immediate obstacle for the Euro is to hold above the VPT-cross long, that’s coming in at $105.95, and the yearly opening price. We must overtake this quickly at $107.04, so we can target up towards the $108.00, $108.50 level.
British Pound versus U.S. Dollar
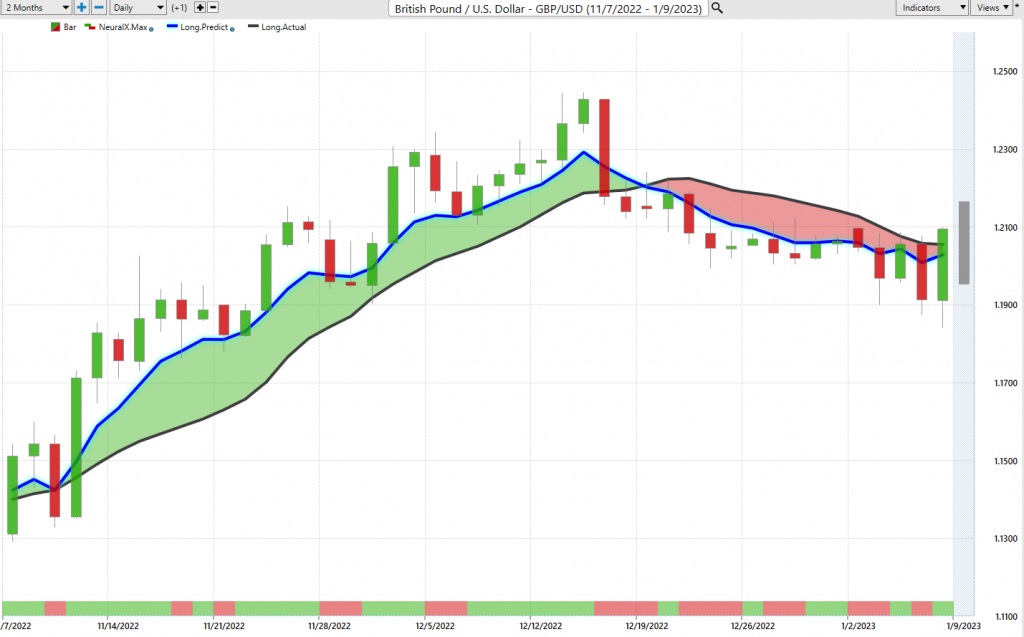
Now, the Pound-Dollar going into next week, very similar situation. You can see that we have been banging up against this VantagePoint predicted moving average going all the way back to the latter part of December, the 22nd. Every single day, we’re in contact with this, so this is telling me that a bigger move is coming on the Pound-Dollar, if and only if we can break through the yearly opening at $129.97. This is a suggested strategy here, a pending buy limit order at about $121.20. If we clear, get above that, then we’ve got a breakout point. Then we can target our upside resistance that’s coming in at $124. Very, very strong possibility of that occurring, but the Dollar index must break down through those key levels, and the Pound-Dollar must break through $121.00.
U.S. Dollar versus Japanese Yen
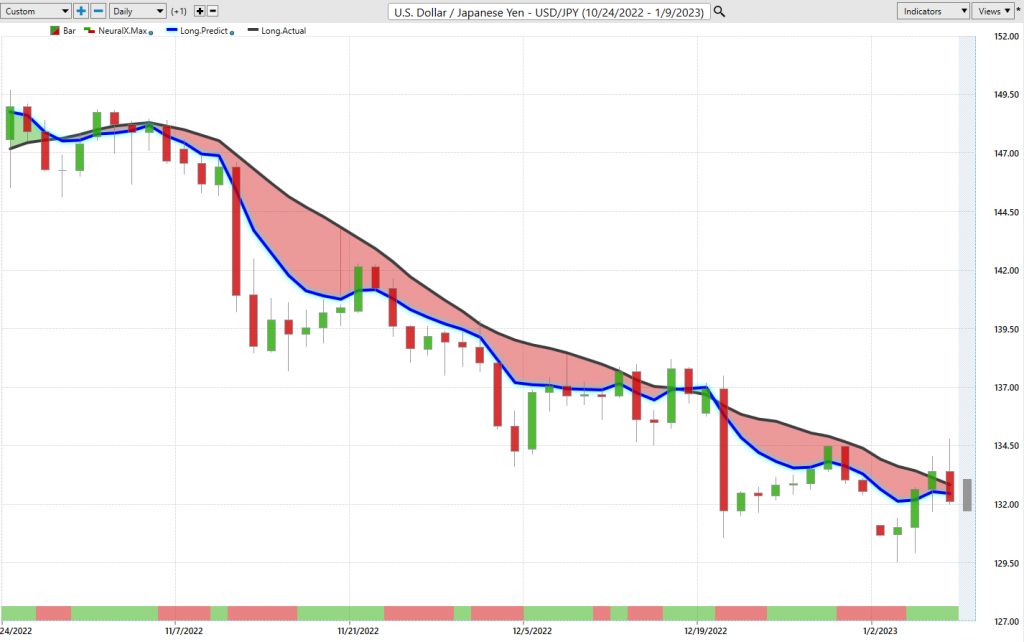
Now as we look at the, once again, the Dollar-Yen, this is the carry trade, but even with the carry trade, it could be tough, but right now, the Dollar-Yen has retaken its yearly opening price that’s coming in at $131.10. That is a critical support level. If we lose that, we could see the Dollar-Yen in a bearish move this year. But again, this pair, by definition, is the carry trade, meaning buy Dollars, sell Yen. The interest rate differential between the US and Japan is substantial. So again, a lot of players are going to be looking to buy this pair and hold it for several weeks or, preferably, several months, so they can collect that broker interest or swap payment on a daily basis, times three on Wednesday, which makes longs attractive, but only if we can maintain above $131.10.
U.S. Dollar versus Canadian Dollar
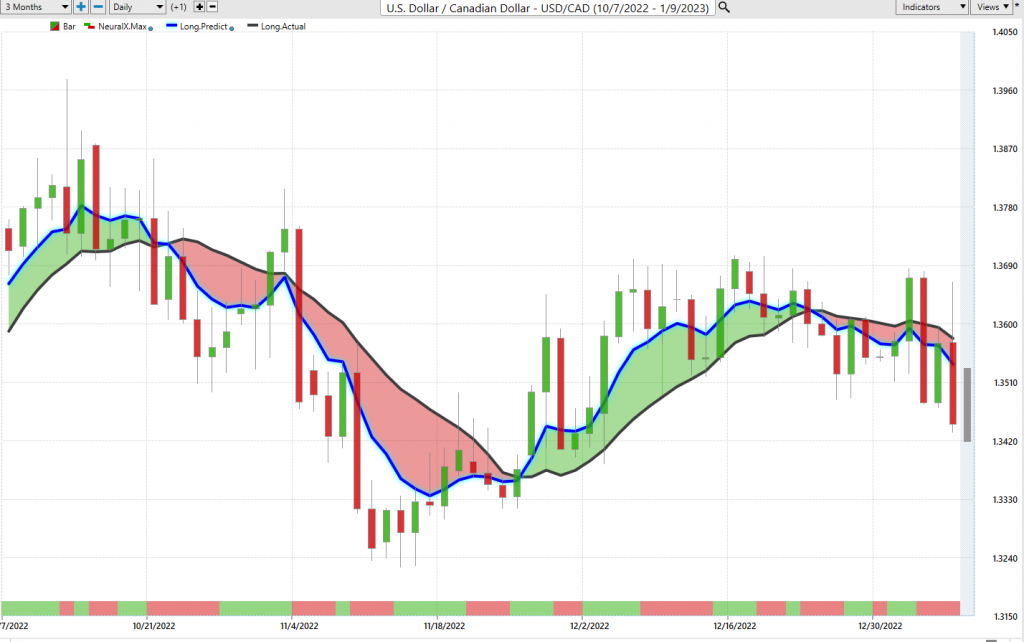
Now, as we look at some of our main equity-based currencies, looking at the US-Canadian Dollar, this pair, very, very choppy at the start of the week. You can see the Monday-Tuesday reversal thing in clear view, but there was very, very low liquidity last week. We’re going to be looking for much higher volume coming into the market, the kids are back to school, the banks are back, so liquidity will pick up. Volatility is going to pick up with the US CPI number, but right now, the Canadian Dollar is dependent on commodity staying high, equity markets turning around. If that’s the case, then US-Canada will move lower, but the yearly opening price here, $135.51, our monthly price, same obviously. So we’re looking at this particular pair.
We’ve closed very bearish, all the way down to $134.45. So our retracement point is the T-cross long at $135.63, with the yearly opening price residing at the same location, $135.51. So all of our resistance is sitting here, our mean revision points are sitting here. The additional strategy you can apply for next week is to sell into $135.63 with a buy limit order ready to go just above $136.00. In order for shorts to work here, guys, the indicators are pointing down, but the market must maintain its position below the yearly opening price and the VPT-cross long.
Australian Dollar versus U.S. Dollar
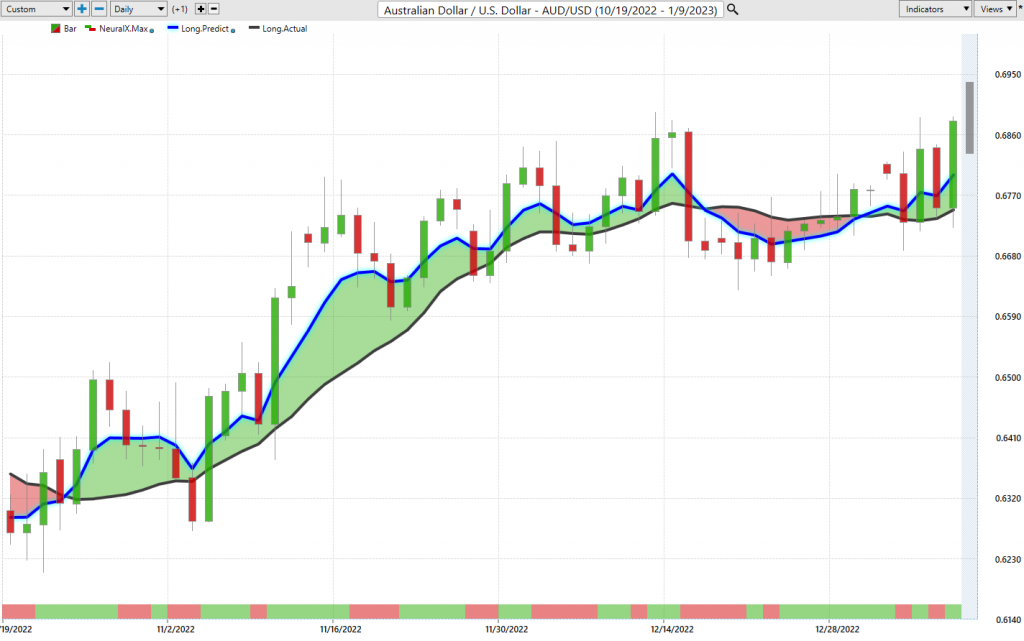
Same thing in reverse for Aussie and New Zealand. We’ve closed above the yearly opening price that’s coming in at $68.17. The additional support $67.61 with the VP indicators, they’re all positive here. My only concern is that we did have an MA-diff cross here, and again, we’ve recovered from that, but the question is can the S&P 500 and the global stock indexes move higher. If they move higher, they will pull the Ozzie up with it.
New Zealand Dollar versus U.S. Dollar
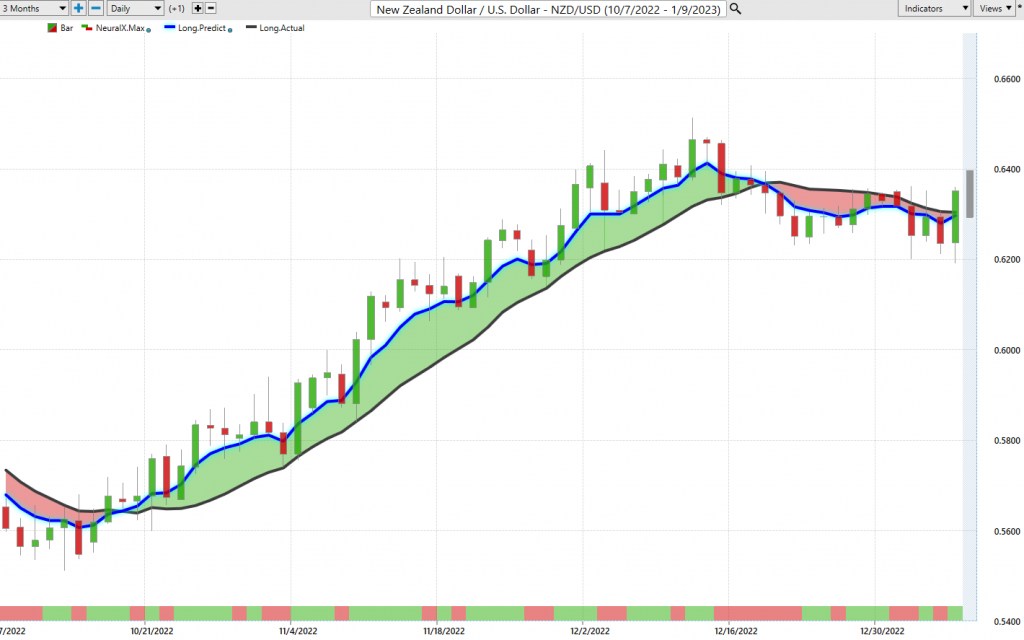
They will also pull up the New Zealand-US Dollar. Both of these pairs, you can see New Zealand’s slightly weaker. It’s staying below the yearly opening price, but we did close above the T-cross long at $63.02, closing the week at $63.52. This is the level you want to keep your eye on, along with $63.50. All of that support is sitting there. If we can maintain above that level, then New Zealand will extend higher, Ozzie-US will extend higher, US-CAD will move lower, but expect a very choppy week ahead.
So with that said, this is the VantagePoint AI Market Outlook for the week of January the 9th, 2023.