


Welcome to the Artificial Intelligence Outlook for Forex trading.
VIDEO TRANSCRIPT
Hello everyone and welcome back. My name is Greg Furman and this is the Vantage Point AI Market Outlook for the week of January the 17th, 2022. Now to get started this week, we’re going to begin where we always do with that very important US dollar index, but first let’s have a look at what indicators we’re going to be using in this week’s presentation. We will be using bars, not candles. We will have our long term crossover, which has been modified to remove the black line. We’re only using the actual predicted moving average, our predicted short, medium and long term difference, our neural index, our point in time, which is set to the yearly opening price, our predicted RSI to gauge momentum, our triple EMA cross, also being modified to remove the short and the medium. So we’re looking at that major pivot point and of course the very popular, verified support and resistance zones.
U.S. Dollar Index ($IDX)
Now to get started this week, again, we’re looking at that dollar index adding the T-cross long and the long predicted. We now have two predicted moving averages in here. The dollar index slipping below the yearly opening price but not by very much. Now we can see that that price on open is 95.64. Our predicted RSI is rising. Our neural index is positive. The predicted differences are starting to turn back up but for the current time, it’s corrective in nature. We’re looking for dollar strength but not for about another week, week and a half, but we could see it towards the end of this week. If we look at that seasonal component, you can see that the dollar really started to shift to the up side last year on January the 21st. That’s consistent with the dollar cycle and that first quarter strength. But again, we need further confirmation from the VP indicators to start buying dollars.
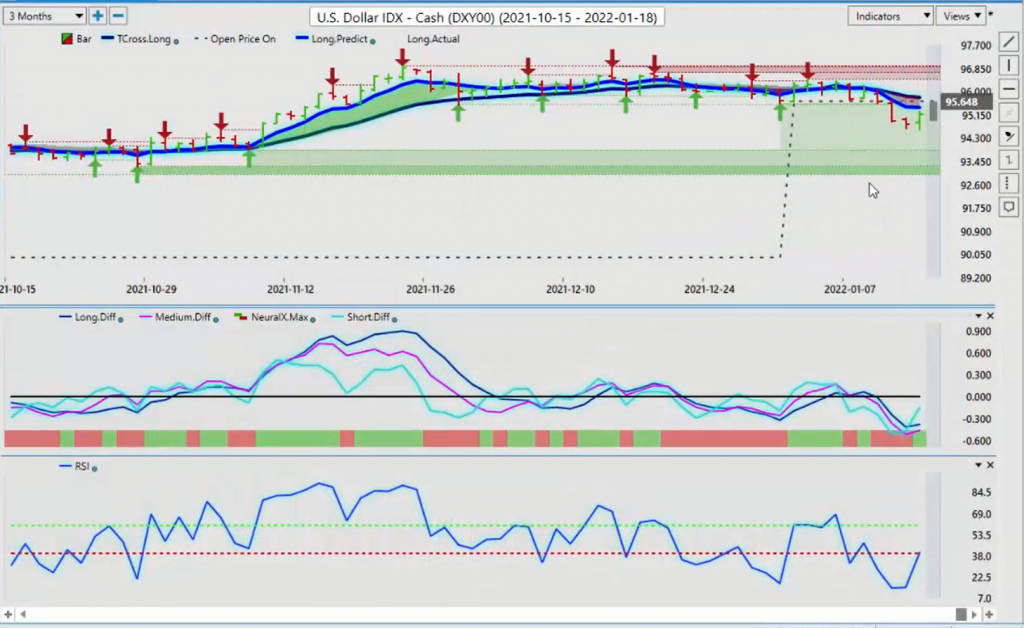
Now it looks like we’re starting to form a little bit of a support level coming in off that low on Friday, that low 94.62. But again, we’re likely to have one more push to the downside before the dollar starts to turn.
GOLD
Now, surprisingly gold is still not able to breakthrough that yearly opening price. And again, guys, this is why it’s such an important level to use in the first half of the year, but more specifically the first quarter and in the first month or so, because it really… Gold is trying hard to turn bullish but it’s just not happening. That yearly opening price has stopped at every single day this previous week, which again, warns us of pending dollar strength and pending Euro weakness is actually coming. So those key levels, the first level that we need to breach on gold would be 18.14 our long predicted, but if we through our T-cross long at 1808 and close below this level, that would signal that gold is likely going to have another tough year.
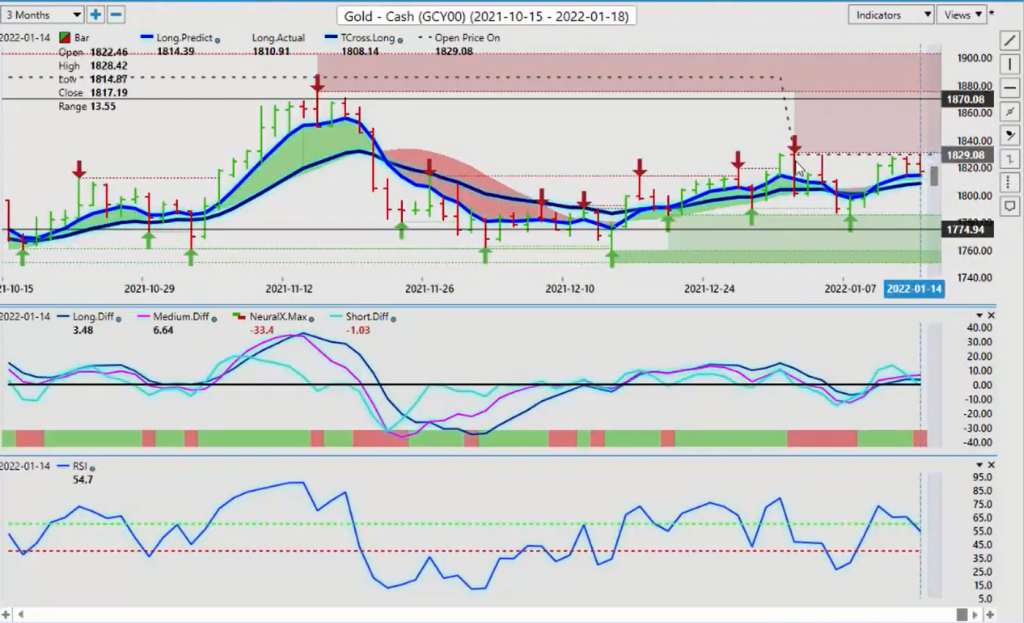
And that is what I’m forecasting currently but things can change very quickly. We can assess here, we’re losing momentum from our predicted RSI, but we’re still above 50 and we’re still above the 40 level. So any move lower currently on gold is corrective while we’re holding above that critical T-cross long at about 1808. Now, when we look at the global equity markets, they’re still hanging in there guys, but there is a clear pattern here. We can see that this low going back into early December, we’ve come back down. We’ve made a higher low. We did it again over here on January the 10th. And we actually did it again this past week. Then we rally right off it. So there’s a clear pattern for me here. The equities are soft on Friday and soft on Monday. Then they often completely reverse on Tuesday.
S&P 500 Index
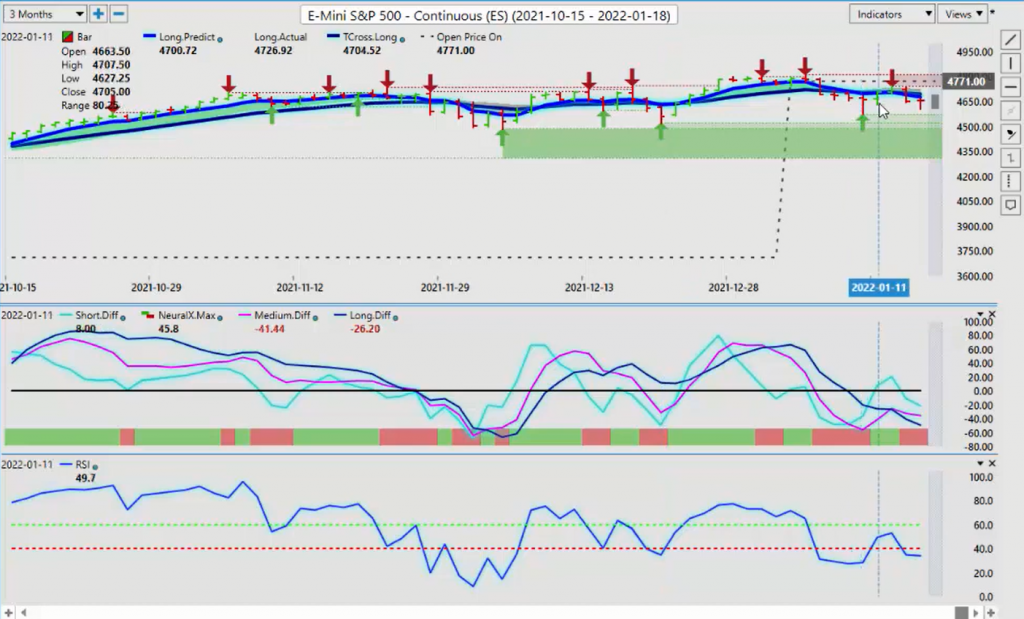
So my strong advice is to turn off the TV on Monday, don’t turn on CNBC or Power Lunch or any of this stuff, because they’re literally like a dog chasing their tail. Until this channel breaks and this channel is in this lower 44.84 area or the top side, which is coming in at approximately 48.08. That’s what we’re really looking for. Now, I will point out surprisingly, the S&P 500 is holding below its opening price, which is the yearly opening price at 47.71. As I had stated in the opening webinar of this year, setting a very tall order for equities this year. More specifically, your tech sectors and the S&P 500, because in order for them to be bullish or profitable, they have to be above that level. So right now our indicators are very mixed. It’s still saying a little bit more downside, but this is something common I’m seeing almost every single week now is this dramatic, this drama on Monday, only to completely go away Tuesday, Wednesday, and part of Thursday, and then it sells off again on Friday.
So we’ll follow this for now, but there is a bearish undertone to the S&P 500 indisputably while it’s below 4770. Now with oil contracts, they continue to advance, but this is literally a make or break area. When we look at this verified resistance high that is coming in at or about this… When we look at this area here, you can see these verified zones up there. This is going to be a bit of a tall order also for oil to get this high. Now that verified high is about 8357, so be very cautious of a bull trap up here. I know energy is the hottest sector out there right now. I’m fully aware of that, but nothing goes straight up and nothing goes straight down. The markets just don’t work that way, guys, or else we’d all be millionaires.
Crude Oil
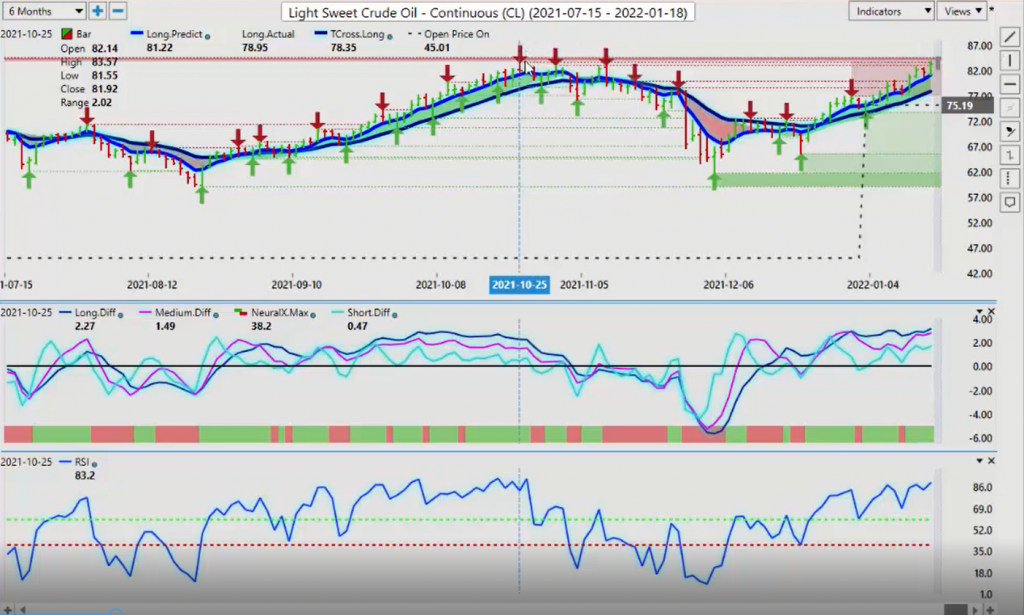
So right now our predicted RSI is at almost 90. I’m not a big believer in over bought, oversold, but when we hit a major resistance level, very often what happens is the market goes slightly above that. Then it turns and there’s a dramatic reversal. So be very cautious of that, but keep a very close eye on the S&P 500. If it recovers, then that’s what will truly help oil. But our key support levels on the downside, our long predicted, 8116, and our T-cross long 7791. Two very critical levels here identified with these predicted moving averages. Now, when we look at Bitcoin going into the beginning of the quarter, perfectly normal for Bitcoin to be a little bit soft here at this time of year. But we can see that we’re still starting to gain some momentum to the upside. Now, if we look at this from one year ago, that big rally, we can see that that rally started almost at the exact same time the US dollar did.
Bitcoin
I’ve often made this comparison that not only did the Bitcoin correlate to the S&P 500, but it also correlated to the dollar index. All three of them had a very good year last year, so the question is, can there be a repeat? That’s what we’ll be looking for. So when I’m looking at the levels right now, we need to take over some of this big level. We’re challenging our long predicted at 4352, but our T-cross long is still the one we’ve got to break, 44,445. That’s the level that we must break above. Our medium term predicted difference is starting to move higher. So when we look at that medium term crossover breaking the zero line, if we click on F7 in our Vantage Point software, we can see that we have a newly formed crossover that is trying to take place.
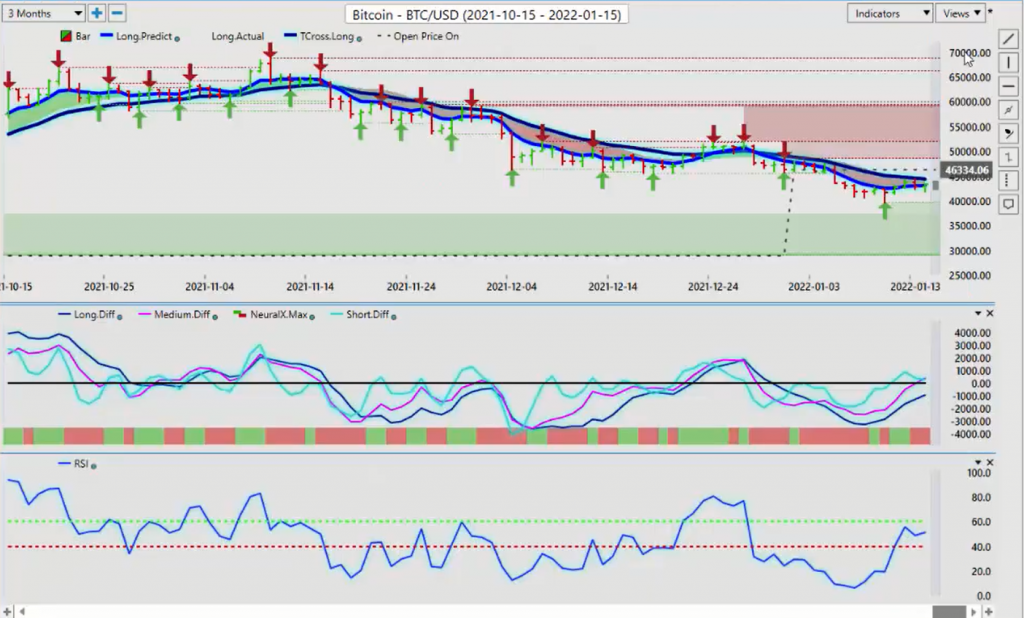
So again, this could be a very early warning sign that the dollar is getting ready to turn around, but so is Bitcoin. Now again, nothing goes straight up and nothing goes straight down. The markets don’t work that way, but it certainly does look like we have a buy signal forming here. We just got to get that… Again, get over that T-cross long or the long predicted, and get over both of them, and stay above them. And then we should see, at least, a medium short to medium term rally in Bitcoin.
Euro versus U.S. Dollar
Now, when we look at going into some of our main Forex pairs for next week, the Euro is enjoying some strength here as it’s broken that channel. We’re holding, but this is a relatively easy play. I should take that back. Nothing in trading is easy, but when we look at this, the yearly opening price here is set at 113.67.
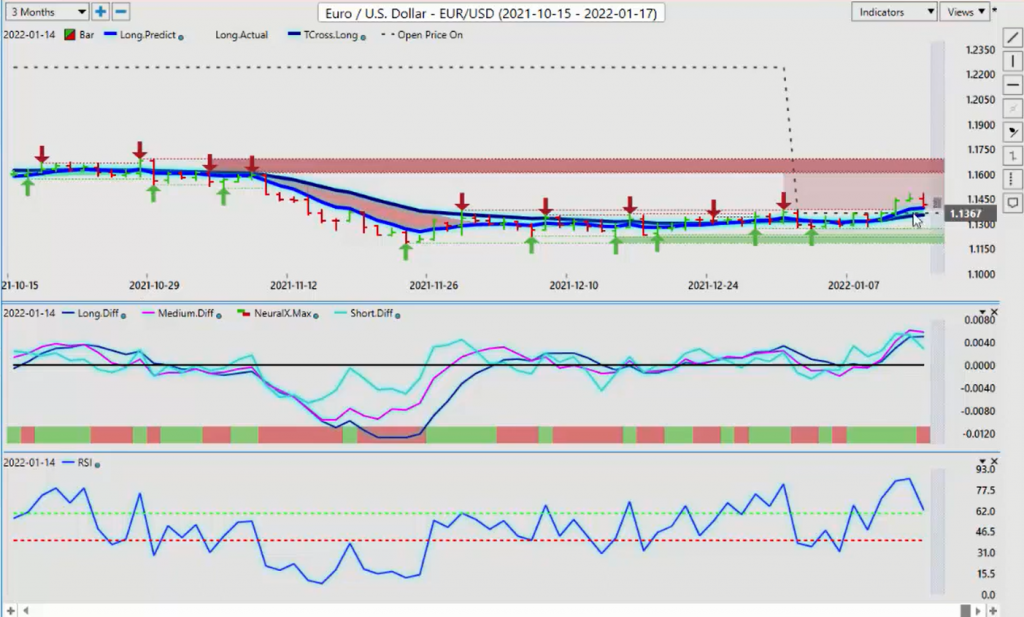
As you can see, the T-cross long is at almost the exact same level here guys. So when we’re looking at potential trades, or whether or something is bullish, then the answer is easy at this time of year. It’s bullish while it’s above those two levels. So the second, if you’re a firm believer that the Euro is on borrowed time here, which I would agree with that. That by February, the Euro is starting to move lower. Then you can continue to play the long side for now, or you can just say, okay, I’m going to set up sell limit orders underneath 113.50. So when this starts breaking down, you’ll just be sitting there waiting to go short. That is a very, very reasonable play. In my respectful opinion though, we’re still at least a week and a half away from that happening. But I could be wrong, it could be sooner.
We’ve got our neural index turning down. Our predicted RSI has got a strong line pointing downwards. And our predicted differences here are starting to flatten out, as is the T-cross long, or excuse me, the long predicted 113.98. So the first step in this turning bearish is to close below the long predicted. And then ultimately close below 113.53. So to start the week, we’re likely to see a little bit of downward pressure on the Euro, but of my optimism on a full blown break of 113.50 next week remains heavily guarded. Now, when we look at the US Swiss franc, again, it will follow the dollar index. So we have our yearly opening price that’s being tested, but as you can see, we can’t seem to close below it. So again, only in my respectful opinion, I’ve seen this year after year, it’s going to try and make a move here.
I would anticipate still a little bit more downside before we make that big rally towards the end of the month, back up towards the 93 area. But a greater concern is we do have our T-cross, or excuse me, our long predicted crossing over our T-cross long. That’s a pretty strong signal, to be honest to here guys, it’s very seldomly wrong. So right now, as I’ve said, I think we’ll have a little bit more downside, but I’m watching this reverse check mark here on the predicted RSI, because it’s telling me we’re losing momentum. What I will often do, as you guys can do yourself, should you be so inclined, you can actually draw trend lines off the predicted RSI. This is a very cool trick, because it still acts as a trend line, guys, nothing’s changed. And the fact that we’re getting a snapshot of the predicted RSI, not a moving RSI, it takes some of that noise out of it.
U.S. Dollar versus Swiss Franc
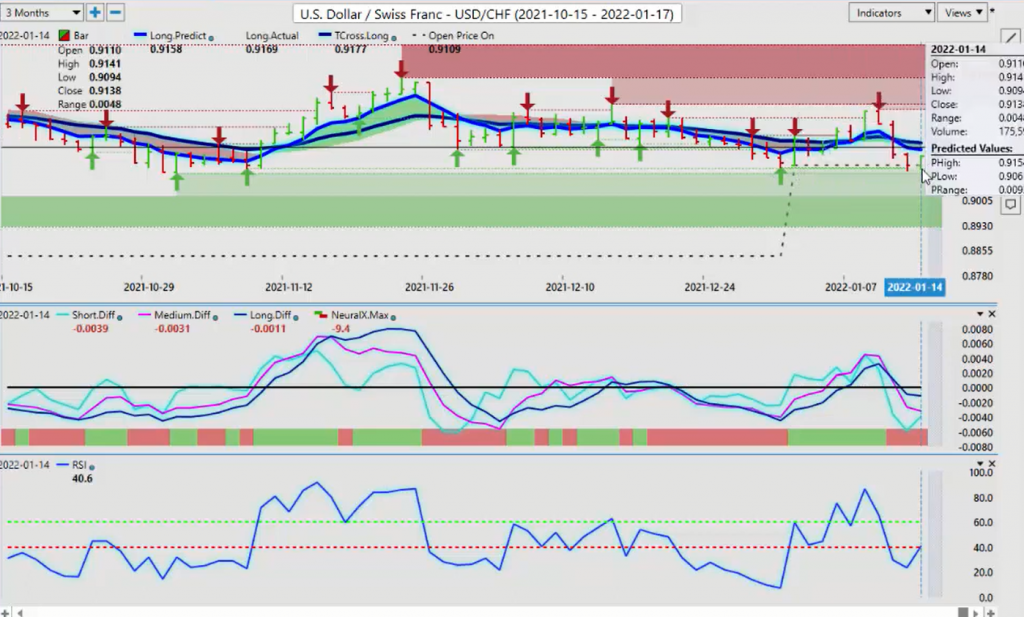
So the theory here would be is that if RSI can hold above the 23.5 level, then the US Swiss franc is getting ready to turn higher, and that’s already in progress. So, that’s just another thing you can add to your toolbox using your Vantage Point software. But for now, again, if those stocks crash, US Swiss franc is absolutely going down with them. Now, the pound dollar getting a little bit overextended here, but this is a period of known strength that we’ve discussed in the Vantage Point Live Trading Room. There’s a seasonality attached to this.
British Pound versus U.S. Dollar
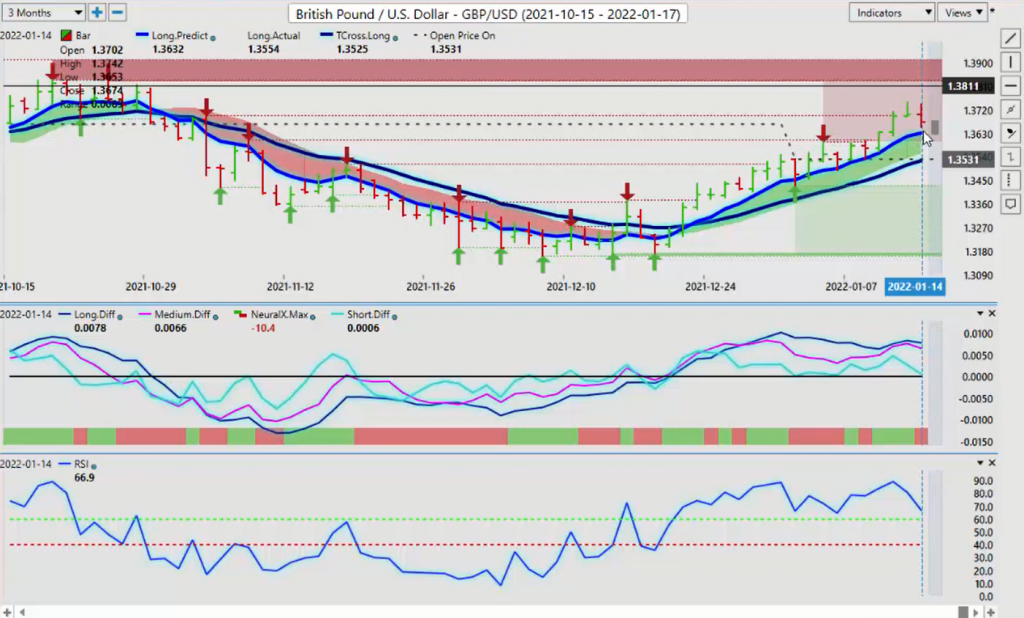
But it’s also coming very close to its end, and that usually happens around the beginning of February. So we’ll be keeping an eye on that, but right now we are above our yearly opening price at 135.31. Our T-cross long is also sitting there at 135.25.
So in my respectful opinion only, we’re going to see some kind of retraced here is coming. It may not necessarily be a trend reversal. That will only happen on a break of 135.31. That will confirm the dollar cycle at the end of this month, the beginning of the new month. And it could point to a broader British pound sell off. So we’ll be monitoring that very closely. But right now, at least for this coming week, the trend remains up.
U.S. Dollar versus Japanese Yen
Now the dollar yen, again, only in my respectful opinion, I must stress that, that applying what I’ve seen over the years, this looks like a no brainer sell. But we do have very, very heavy verified support at 112.50. Either way, I will be a buyer at that particular level, because this also is consistent with a seasonal pattern, where the dollar yen is usually not that strong in the month of January anyway.
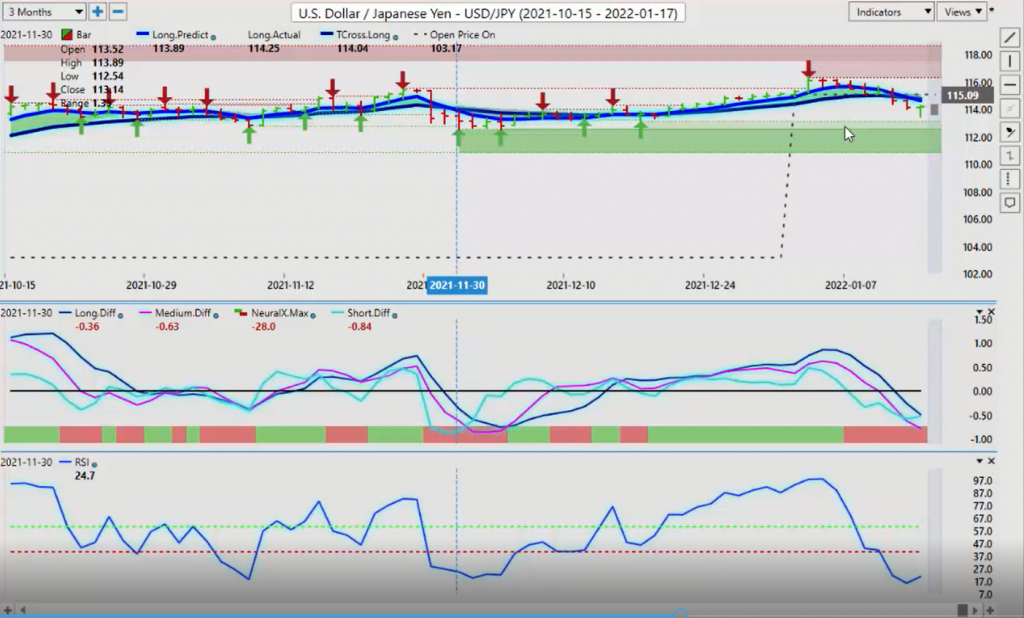
And there’s certain percentages that can be calculated to the upside and the downside. The upside has been hit within almost 30 pips. But 112.50 is almost bang on where the lower end of that percentage would be. So for now, I believe we are heading towards 112.50, and we can reassess when we get there. Because again, this is a weekly outlook, that’s as far as I’m going with this. I will make comments about particular markets that I think are happening, like the dollar index cycle, at the end of the month, but we’re not there yet and a lot of things can happen between now and then. But for now, all of our resistance is piling up on the dollar yen, and that’s coming in at 114.64 at the long predicted, and 114.79 at the Vantage Point T-cross long.
Now our predicted high, which is 114.31, this is an excellent way to apply the predicted highs and predicted lows. So we would target shorts between 114.31 and 114.79, and all stops should, in theory, be above the high at 116.34. Now with the US Canadian pair, we’ve had a big move down on this thing in a very, very short period of time. But as you can see, we’re stalling out down here. I’ll just remove some of those things that I had on here, so we can see this clearly. This is a classic fake right here, guys. This one here, this low at 124.92, you can see that we came down, we hit that, and then the next day we broke below it, but we didn’t close above it. And then we came back down again, but not even on one of these three days last week, did we actually, physically close below 124.92.
That is a big tell signal for me. If I’m sitting at a poker table, that’s a tell for me against my opponent. So I would anticipate the US Canadian pair turning around and, at the very minimum, we’re going to come back to the T-cross long 125.77. And more specifically, the T-cross long 126.64. I anticipate we will target that area very early in the week. We’ve got our predicted differences rising. Our neural index is positive, and we’ve got a rising predicted RSI. But to be clear, it still remains bullish. Our yearly opening price is now coming in at 126.37, the T-cross long sitting right beside it at 126.64. So if you’re so inclined to short guys, that’s the level you want to hold out for. But I think we are going to go higher first, the predicted high 126.11. So again, if you want to target those shorts right around those key Vantage Point pivot levels is a fantastic place to start.
Australian Dollar versus U.S. Dollar
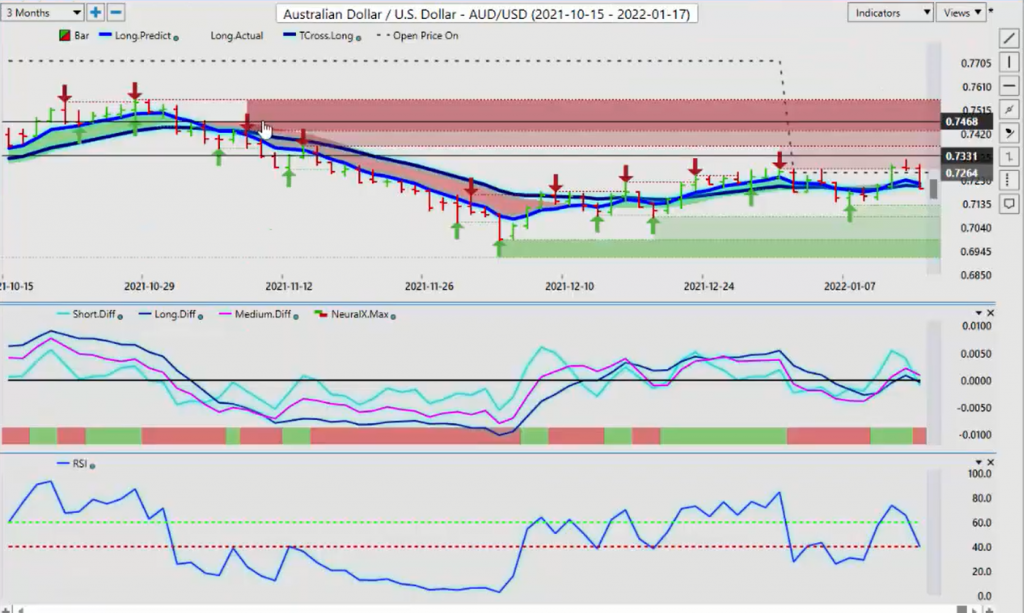
Now, the Aussie usually doesn’t fare that well in the month of January. The Kiwi is usually the stronger currency of these two. I would advise, on a side note here, to keep an eye on Australia and New Zealand this coming week. I think there may be a very good short there, if I’m correct and New Zealand strengthens and the Aussie doesn’t. So right now, the Aussie is a sell signal forming. Predicted differences pointing down, our neural index is down, our predicted RSI 40.1. We’re looking for a breakdown below that 40 level to get this to start building some momentum here. And momentum to the downside by February, I would say there’s an 80% probability that it would be there now. So this could be a very early warning sign for us with our price on open at 72.64, our Vantage Point predicted high for Monday is coming in at 72.31.
Our stocks are a little bit soft, at least right now, so that they’re not going to help the Aussie. So keep an eye on these main levels, but again, the Aussie remains a sell, at least, for now, until such time is we can get above our yearly opening price. And of course, that yearly opening price is 72.64. When we look at the Kiwi more specifically, while it is the same trade, I don’t believe, and you can see that predicted RSI, the difference between the predicted RSI 45.6, where the Aussie is at 40. So the Aussie is the weaker of the two of these.
New Zealand Dollar versus U.S. Dollar
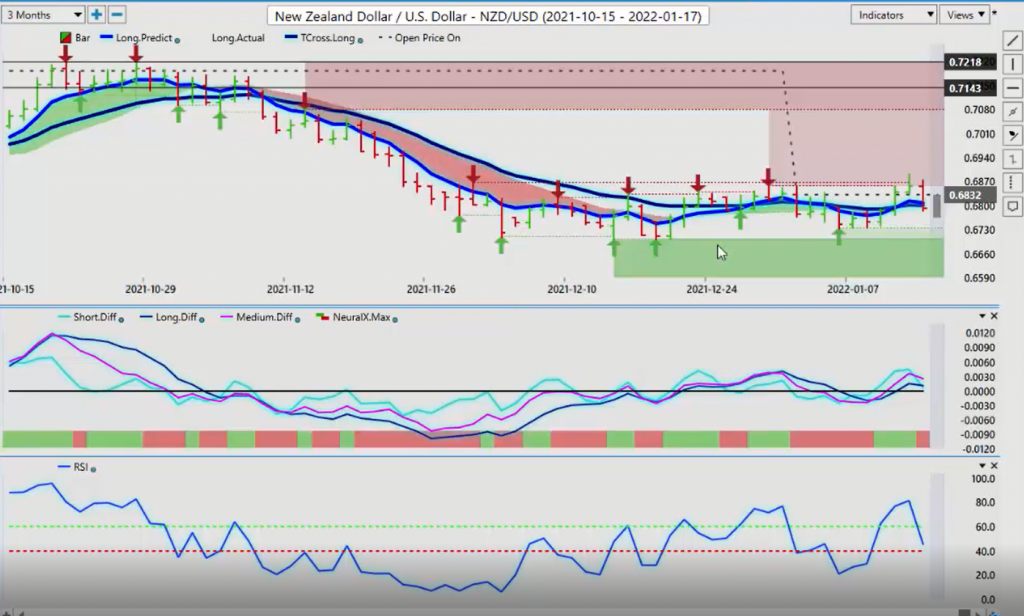
So if you’re looking for a long trade, my advice would be looking at New Zealand US, or if you want to avoid Aussie US and New Zealand US against the US dollar, then I would respectfully submit that Australia New Zealand shorts are one to look at next week. And you’re not going to have the volatility that you will with the G7 pairs.
So again, we’re likely to see more volatility next week, but with that volatility, definitely we will have some opportunity. So with that said, this is the Vantage Point AI Market Outlook for the week of January the 17th, 2000-


