Welcome to the Artificial Intelligence Outlook for Forex trading.
VIDEO TRANSCRIPT
Hello, everyone and welcome back. My name is Greg Firmin, and this is the VantagePoint AI Market Outlook for the week of February 7th, 2022. Now, to get started this week, again, we’ll do a quick review of the indicators we’re using in this week’s presentation. We’re using bars, not candles. We’ve got our long-term crossover modified to remove the black line, long-term predicted difference with our medium-term predicted difference, and of course, the very powerful neural index.
The point in time set at the yearly opening price, which we’ll discuss in a moment. The predicted RSI to show us momentum in the market. The short-term predicted difference, our triple EMA cross that’s been modified to use the T-cross long only to get that critical VP pivot level, and, of course, the very popular, very verified support and resistance zones.
U.S. Dollar Index
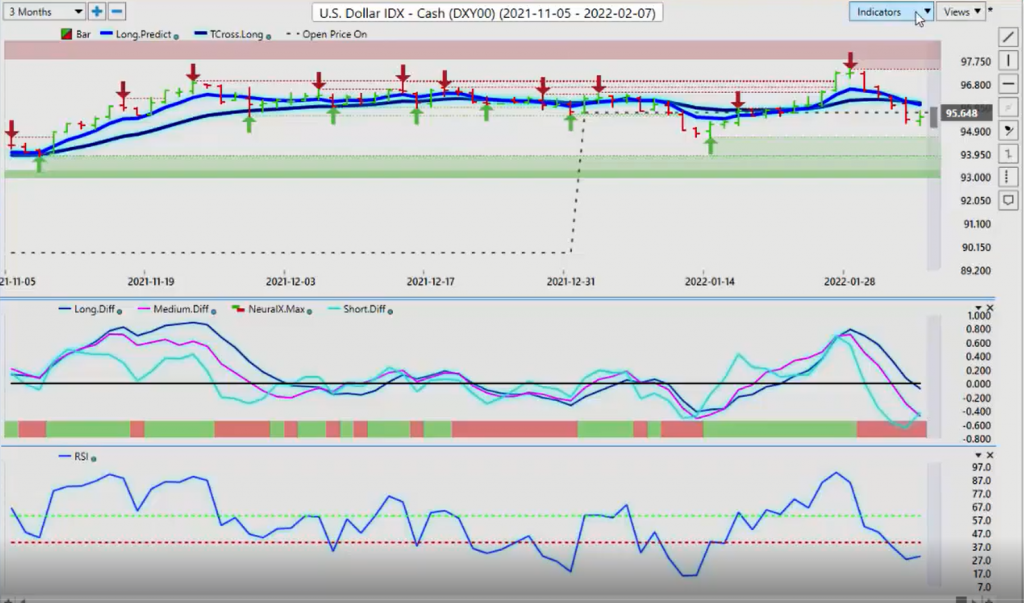
Now, when we look at the dollar here, the dollar corrective moved lower, which I discussed in last week’s weekly outlook, became more of a corrective move after, once again, that ADP Report came out that we were going to get negative 300 and some odd thousand jobs I had stated in the VP live training room on Monday and Wednesday. I did not agree with that. I believe we have COVID distortion. The number came out rock solid. The previous months all revised higher. The U6 number moving lower.
Nothing really bad in that report, except maybe the unemployment number itself rising slightly. But again, that’s not supported by the U6 and I believe that that’s just COVID distortion. The dollar took the heat on that, but more specifically, what really caused this plunge on Thursday was, of course, the surprise from the European Central Bank discussing the fact that they are thinking, flip flopping back and forth that they may be hiking rates. I can almost guarantee you that that is not going to happen anytime soon.
They still have their QE and their forward guidance, Lagarde is way, way out in left field by even suggesting that. Again, I believe that the dollar still will recover from a tougher week here based around the payroll number and going forward. Now, when we look at the key levels, our yearly opening price is the one you really want to pay attention to next week and this closing price for the week of 95.47, because your weekly opening price and your yearly opening price are going to be almost the exact same.
If we can hold above 95.42, close above that by the end of trading on Monday, that would suggest the dollar’s about to have a decent week. But again, the highly accurate MA diff cross, which had me nervous last week, because again, as you can see, before the week even started, that MA diff cross, which measures the strength of the medium-term crossover against the long-term crossover. A multiple market analysis in that pink and blue line, but that crossover, again, happened before the market made the move down, not after.
But again, I had assumed that this would be just a natural corrective move before the next leg up on the dollar. But I think we could see that next week, but we must get above the yearly opening price and stay above that. Our indicators on the neural index is still down, but our predicted RSI has now flattened out. It’s losing that downward momentum. All we have to do is overtake these critical VP levels, the long predicted 95.96, the T cross long at 96.04. And again, that price on open, 95.64, once we get above that, assuming that we do, the dollar should take off.
Now, with that said, if the dollar was really as weak as what they’re trying to sell us, then gold would easily have cleared the yearly opening price… The price on open at 1,829, but it couldn’t even get above the VantagePoint T cross long at 1,809. Again, I think gold could be in for a tougher week, but that same ominous signal that was on the dollar index, the Euro, a number of different currency pairs in last week’s presentation presents itself on gold with the neural index in a rising RSI. The one thing with gold is you can never really count it out.
I’ll be monitoring, monitoring these levels, but I’m not overly interested in longs unless I can get positive on the year. That’s the way my mindset. Everybody does things differently. My mindset is that if I’m buying something, then it has to be at least positive on the calendar year, unless I’m going for a contrarian trade. For now, we must clear this. The very minimum we have to clear is 1809. I suspect we will see a fake move higher on Monday, only for it to sell off the remainder of the week.
GOLD
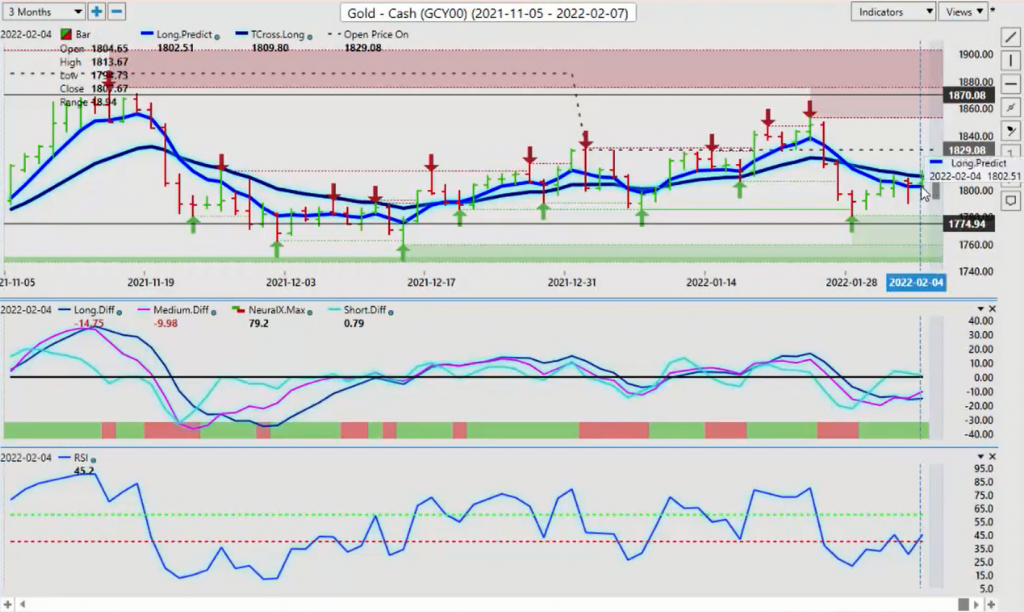
But again, I am a happy buyer of gold if we can get back up above 1,829 and stay above that level. But right now, the indicators from VantagePoint are telling us it’s simply corrective in nature.
S&P 500 Index
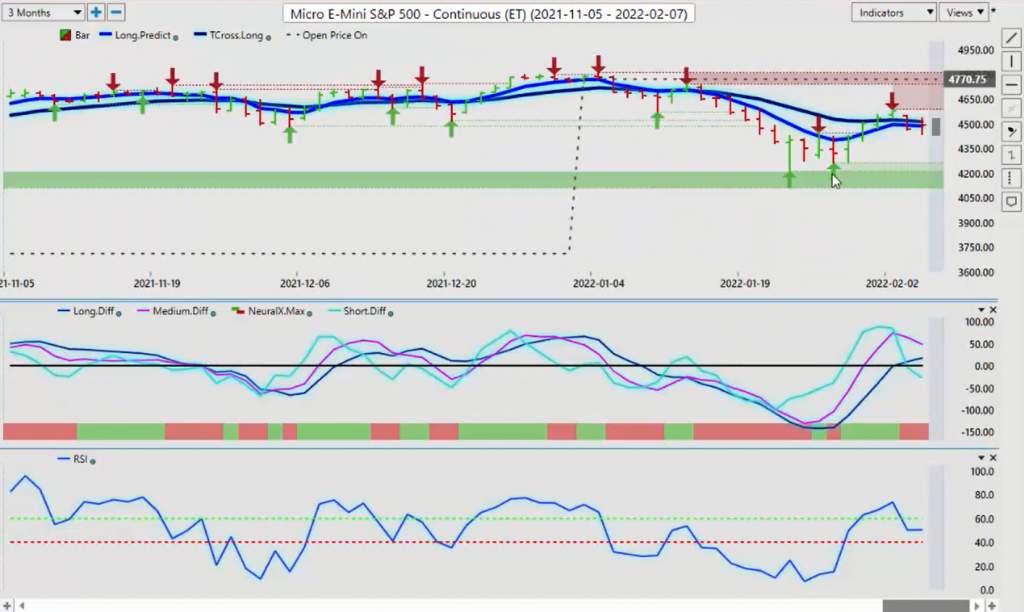
Now, with the S&P 500, again, this thing is really all over the map. Now, we’ve had a corrective move back up, but again, we’re stopping right on that T cross long 4,514. The one thing that I’m not hearing from a lot of the pundits is talking about the fact that the S&P 500 remains negative on the year. Again, it is a big number right off the beginning of the year.
I’d stated it’s a tall order to have a yearly opening price this high. Whether the equity markets can get back above this level will left to be seen. But the longer it stays below it, the more bearish this market appears. Again, we look at our T cross long, 4,514. If we’re going to go long, we have to get above that level guys, and we have to stay above it. And then we have to overtake this very difficult 4,770. The short term predicted difference is already heading lower. Our medium-term crossover, the slope of that is starting to turn down, and the RSI is dead flat at 50.
There is no momentum in either direction. Once again, watch your weekly opening price. If the market stays below that weekly opening price, then shorts are still in play. But if we get above the weekly opening price and stay above it, then it has a shot at least retracing back to these higher levels. But my optimism on that at this current time does remain heavily guarded. Now, the counter to those equities is oil. The energy sector continues to advance. We’re firmly above the yearly opening price.
Now, this is something I haven’t seen too often where the S&P 500 or the global indexes are below their yearly opening prices and oil is above there. Very interesting dynamic. Either the S&P 500, the Dow, et cetera, are going to turn higher, or oil is on borrowed time up here. Again, we will continue to monitor this, but there is no signs of shorts just yet, the bulk of the indicators. But just remember a trick.
Crude Oil
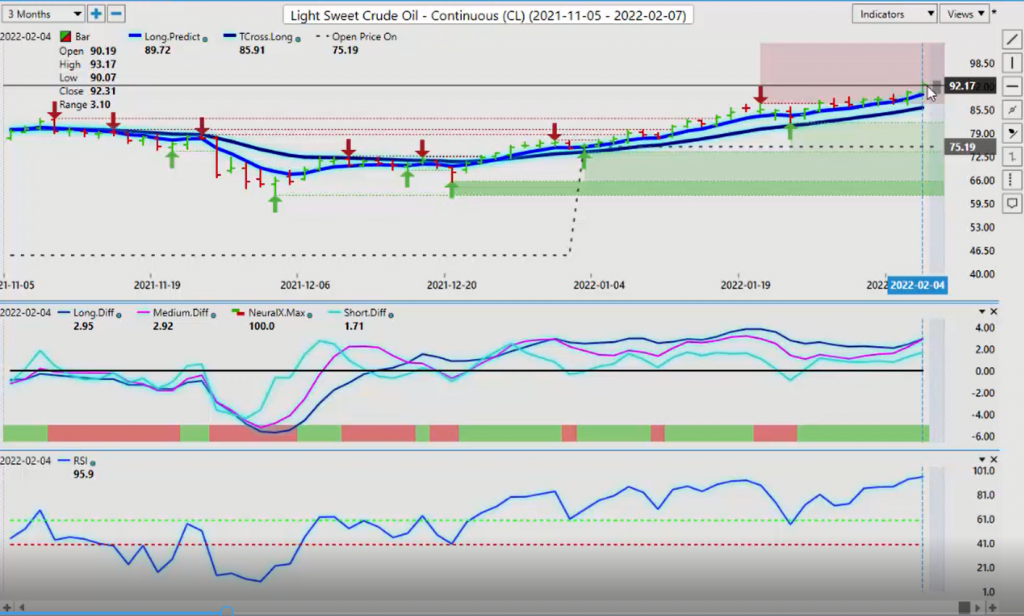
If we look at the closing price of 92.31, in your VantagePoint software, if you just put a line on there to start the week at 92.17, that will approximately be your weekly opening price. You want to see if oil can hold above that. If it can’t hold above that, then that doesn’t just tell us that oil would be going lower, but it indirectly warns us that those stocks could be getting ready to go lower also. Very high correlation there, even though there are slight differences that I’ve mentioned here. Keep an eye on that particular level.
Bitcoin
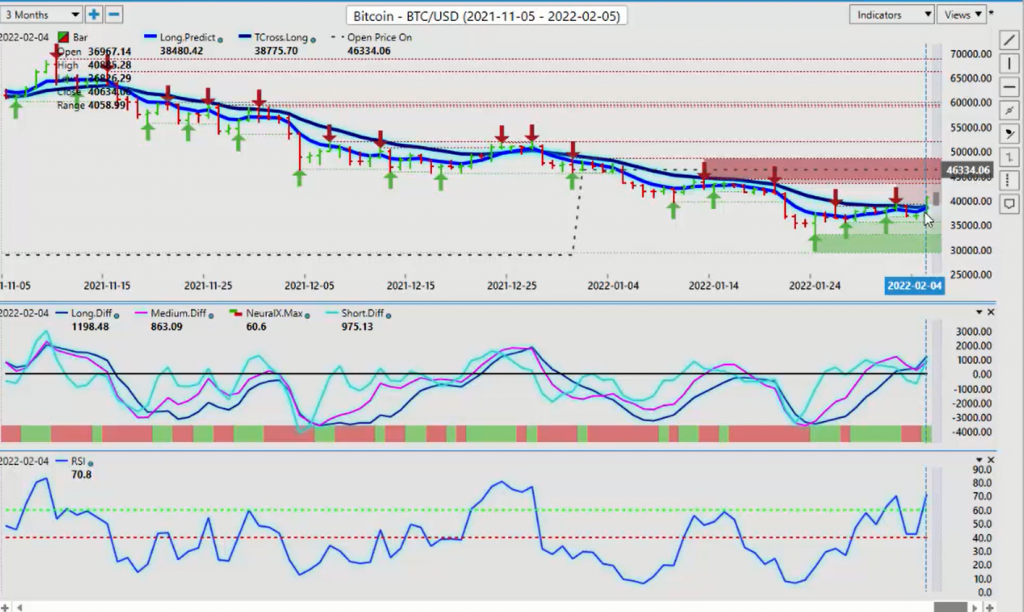
Now, Bitcoin at the time is already starting to accelerate. Been a very long time since we’ve been above. It was back in 2021 that we were actually above the VantagePoint T cross long. This is kind of big here. And again, I see a very high correlation from the US dollar and Bitcoin, a positive correlation. If this is a true price, which it appears to be, then it would also indirectly suggest that the dollar could follow Bitcoin in this case. Now, it’s not 100% correlation. Don’t get me wrong, but it’s at least 70 positive correlation. We will monitor that.
Now, the price on open, Bitcoin is well below that, but we’re advancing back towards it at 46330. We’ve overtaken 38,480. The T cross long at 38,775. As long we stay above these two levels, then that would tell me, at the very least, we’re going to retrace back to the 46,000 level. Now, our neural index is positive or green. Our predicted RSI is above the 60 level, suggesting that we have momentum building to the upside. Watch Bitcoin for possibly a pretty decent week next week.
Euro versus U.S. Dollar
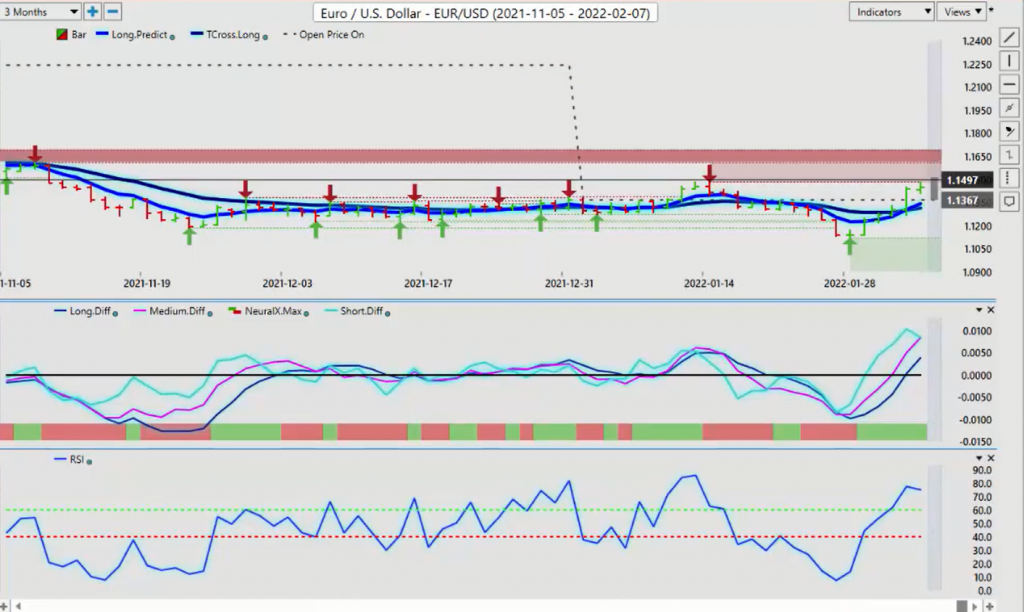
Now, as we move into some of our Forex pairs for next week, once again, somewhat of an unprecedented move from the ECB, which is still a head scratcher here, guys. Because again, the comments made by the new head of the European Central Bank, she flip flopped all over the place in the press conference. She’s hiking. Maybe hiking. No, we’re definitely not hiking. We’re thinking about hiking. It was pretty comical actually to watch. I don’t think she had a clue what she plans on doing, but we do have a very strong verified resistance high at 1.1483.
The Euro has advanced originally. Again, what I had said in the beginning, I thought that the Euro had advanced or the dollar declined based around that very dismal ADP Report. But then again, I realized something far more insidious was in play here, when all of a sudden, the Euro started or the ECB started talking about rates going higher, which again, fundamentally, I don’t see that until, if it did happen, the end of the year where the US Federal Reserve, they’re at the forefront, they are going to hike probably next month.
Again, when we look at this, it’ll be interesting to see if the Euro can break through here. But the bulk of this move happened again on Thursday. This was a perfectly acceptable retracement back to the mean or a mean revision to the T cross long at 1.13, but it blew through it on the ECBs’ comments. Again, is the market going to continue to buy that? Well, the predicted RSI has a reverse check mark warning us that we are losing momentum up here that this could be it.
Once again, a little trick for you VantagePoint users is you look at the close price from Friday. You should really use the opening price on Sunday night, but I can point you in the immediate direction, 1.1454. You want to monitor to see where the market actually closes on Monday if it closes above or below this particular level and whether it can stay above it. If it’s truly bearish, then the Euro should easily be able to stay above its weekly opening for next week at 1.1454.
But I don’t think it will be able to do that because of the high correlation the Euro has to gold, right, and the inverse correlation to the dollar index. If the dollar index goes higher, the Euro only has one way to go, guys, and that’s down. Watch that level very closely. We are losing momentum.
U.S. Dollar versus Swiss Franc
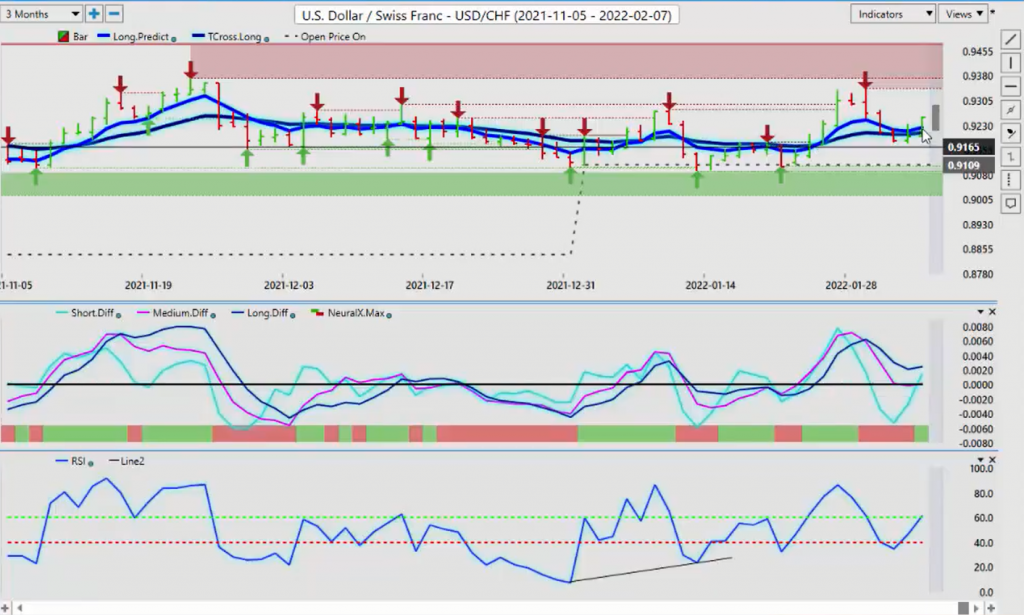
Now, with the US-Swiss Franc pair, again, this could be a very, very good opportunity for longs next week. We’ve got our yearly opening price way down here that wasn’t even tested. The price on open .9109. Our T cross long is now .9208.
The long predicted .9224. We’re closing above all of those levels, so our support is all below the market price that we have. Now, it is setting the bar a little bit high here for the weekly open with that close coming in at .9254. Again, watch where we end the trading day on Monday. I wouldn’t recommend jumping into the market. Let everything shake out a little bit here and see where we go, and then see if we’re holding above these levels in the week. Our predicted differences in our VantagePoint software are starting to turn back to the upside.
The predicted RSI is building momentum above the 60 level. The neural index has gone from red to green. Everything looks ready for this one to move higher. But again, watch those lower support levels.
British Pound versus U.S. Dollar
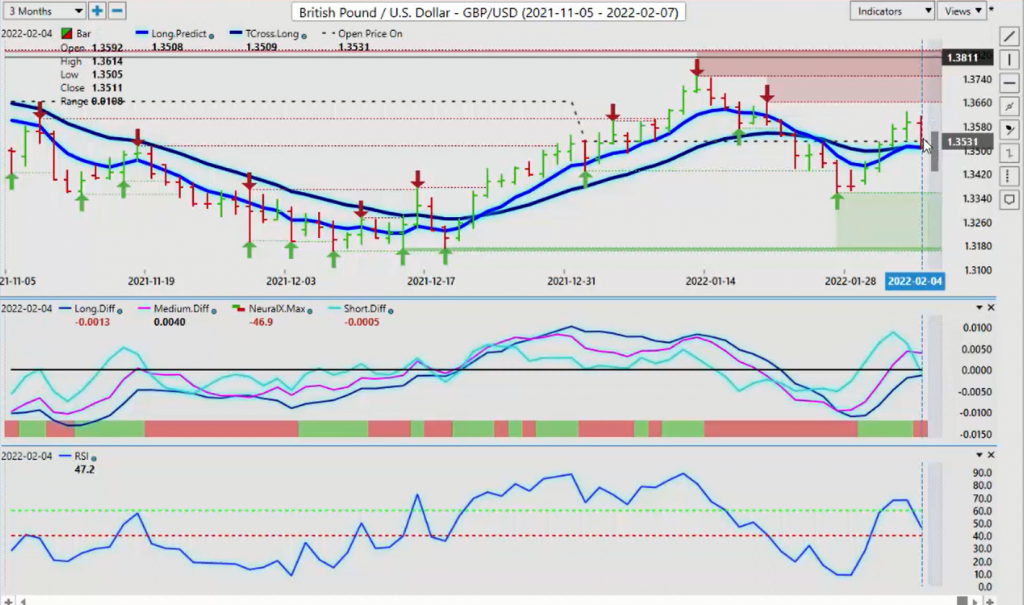
Now, with the pound-dollar, the pound dollar to finish the week, this is a tricky one because all of our major resistance or support, which they were support, they’re now technically resistance, the market or the pound-dollar has slipped below its price on open, the yearly opening price at 1.3531. We now have our T cross long at 1.3509 and 1.3508.
We are closing at 1.3511. Once again, this added trick is you can just take that price on open or, again, just the close of the week at 1.3511, the numbers are close, and see if we can hold above that to the upside. That’s a very easy way to determine whether this is going to continue to advance higher or if this thing is getting ready to tank. I suspect the latter. Now, again, the pound-dollar like Bank of England, it got a boost, but didn’t last very long. The Euro has actually put some pressure on the pound here also. When we look at these indicators, we’re losing momentum on the RSI.
The predicted differences are starting to roll over. The neural index is going from green to red. Again, watch the end of day on Monday. But if we’re closing below that weekly opening price and the key VantagePoint levels along with the price on open set to the yearly opening price, that would suggest that a bigger move down is likely coming. That target level would be the low at 1.3358 and it does have the potential to break through there on any more hawkish Fed rhetoric.
U.S. Dollar versus Japanese Yen
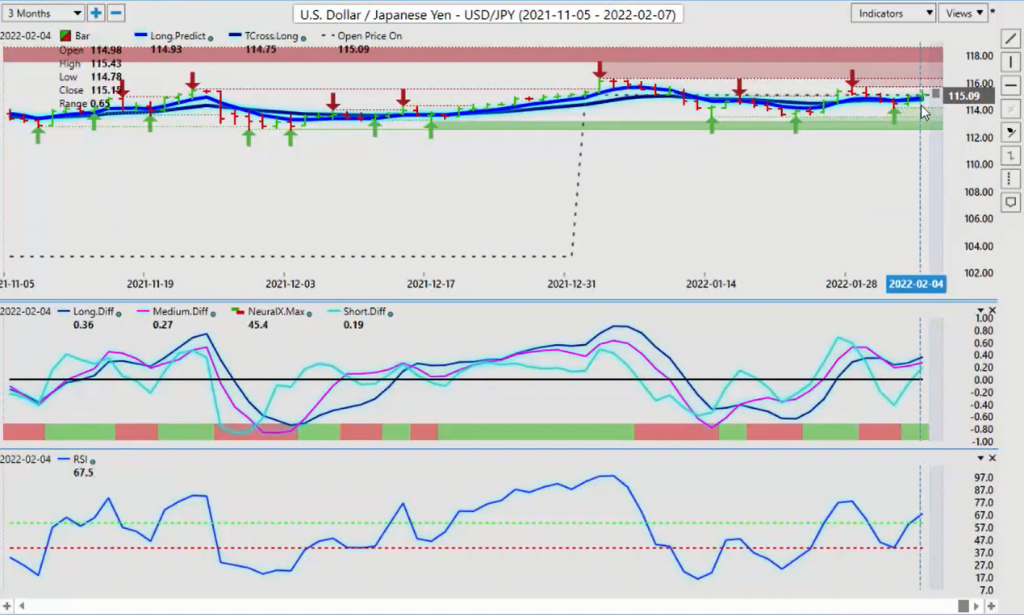
Now, with the dollar-yen, once again, the dollar held its ground this entire week against the yen.
It slipped below there on Wednesday, again, after that bogus ADP Report, which I knew was wrong. Again, when you look at the U6 number here, guys, briefly over the last several months, it doesn’t support a minus 300,000 job. The U6 number has been moving lower, meaning more jobs by 300,000 a month. A negative 300,000 jobs number just wasn’t in the cards for me based on the science of it, if nothing else. The U3 number is a household survey number. Eh, take that with a grain of salt.
And by the way, all of those numbers from the previous month were all revised up. Once again, a strong labor report here, guys. The dollar-yen is reversed. I think we may have some pretty decent longs, providing the S&P 500 and the global equity market stabilize, then we would be looking at longs 15.09, 14.47, and 14.93. Again, watch the weekly opening price on this one too at the end of trading on Monday to see if we’re holding above that weekly opening price. Now, if we use the close, that’s 115.15.
If we hold above that, that would tell me that we’re going to get ready to target probably towards the 116.34 area. I would be pretty surprised if the yen was able to make any kind of real gains against the dollar next week. Now, the main indicators, we do have an MA diff cross, but our predicted differences are turning. They’re moving higher. Predicted RSI above the 60 level. Momentum is building here and, of course, a positive neural index, all pointing high.
U.S. Dollar versus Canadian Dollar
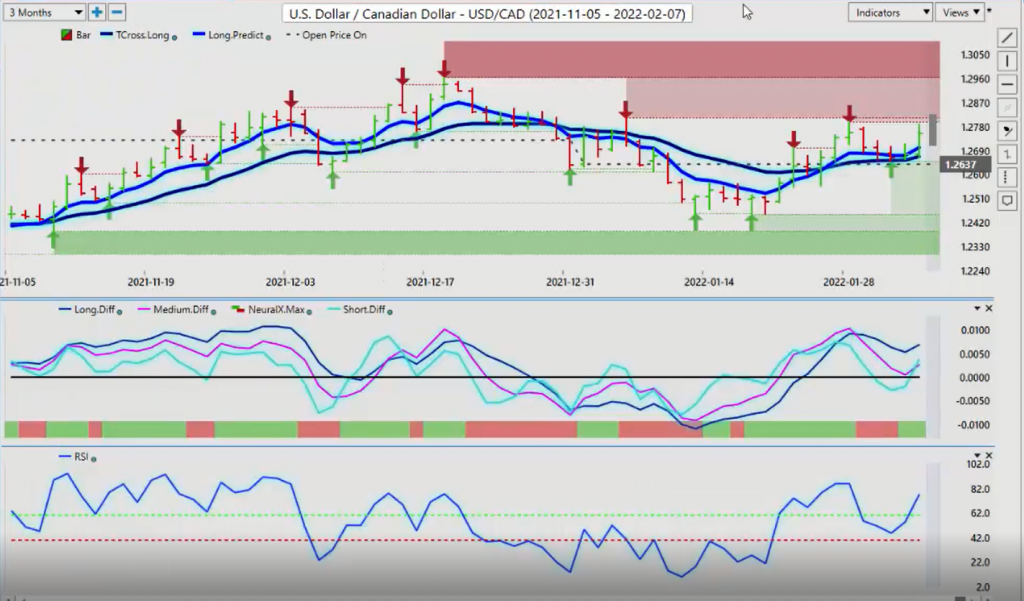
Now, with the US-CAD, the Canadian unemployment number came out on Friday also.
Just a horrible number. I think it was minus 200,000 jobs. It’s almost like the pundits got the reports mixed up that the Canadian report was supposed to be the American report, vice versa. It’s kind of funny there. But the main levels now, we have solid support down here. The price on open, the yearly opening price, 1.2637, the long predicted 1.27, and the T cross long at 1.2668. Now, what I love about this with the VantagePoint software is you can see that for basically three days in a row, the market stopped dead on the T cross long.
We don’t need Fibonacci or waves or any of this nonsense, guys. We just need a hard number with the predicted moving average. The market is hitting that VantagePoint key level. The theory is if it’s above it, we’re long, below it, we’re short, unless we’re playing a mean revision, right? We hit that level three times in a row. And again, after the non-farm payroll number and the Canadian unemployment report, boom, up it goes. Now, again, we’re hitting some pretty stiff verified resistance up here at 1.2813.
But if oil gives back some of the gains and the equity markets turn lower, then the CAD, the Aussie, and the New Zealand will all react to that. Right now we’ve got to clear that level, but I think the VantagePoint predicted low at the 1.2710 level is a reasonable area to look at lungs to begin the week.
Australian Dollar versus U.S. Dollar
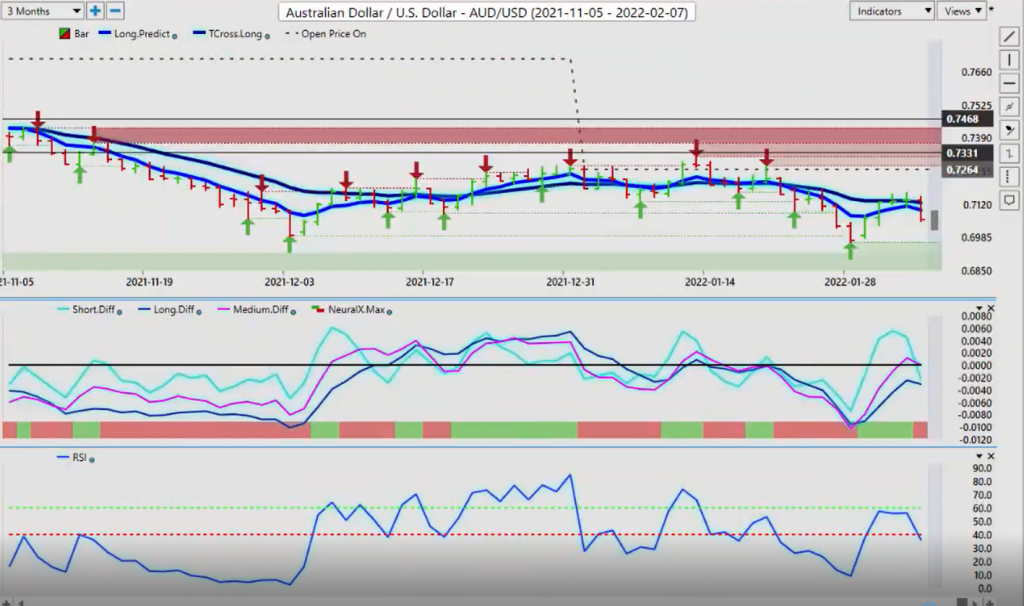
Now, with the Aussie and the New Zealand, again, this is where you’ve heard all week the dollar getting killed, yada, yada, yada. Well, that’s not really true. Again, this was an expected retracement.
You can see the MA diff cross, the pink line crossing the blue line, but it’s telling us that it’s retracing. It’s not telling us it’s a new trend yet. It must clear the T cross long and stay above that. That didn’t happen guys, right? Actually we got all tangled up on there and the catalyst was the labor report sending the Aussie back down. Now, the Aussie a tricky one. But for now, we are below the yearly opening price at .7264. We are below the T cross long, and we are below the long predicted.
New Zealand Dollar versus U.S. Dollar
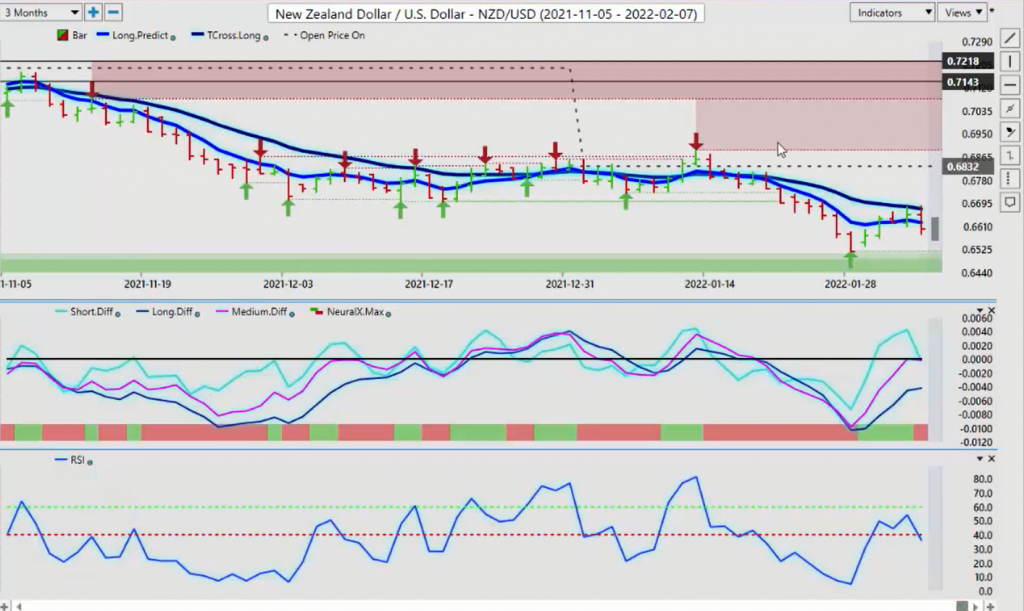
Now, again, a simple trick, guys, just put a line on that closing price of .7061 and see if the market closes below that at the end of trading day on Monday. The end of trading in the Forex market is 5:00 PM Eastern Standard Time. The new trading day on Tuesday starts at 5:01 Eastern Standard Time. It’s 24 hours a day, five and a half days a week, right? We will watch these key levels. But very much like US-Canada, this is just an inverse trade to that. You could see that we poked above it, but we couldn’t close above it.
And then too much pressure, down it goes. You will see the exact same setup with the Kiwi, but the Kiwi was much weaker than the Aussie in this particular case. We did hit the T cross long two days in a row, but the Aussie-US and the New Zealand-US, guys, for the most part is pretty much the same trade. With that said, this is the VantagePoint AI Market Outlook for the week of February the 7th, 2000 and…