


Welcome to the Artificial Intelligence Outlook for Forex trading.
VIDEO TRANSCRIPT
U.S. Dollar Index ($DXY)
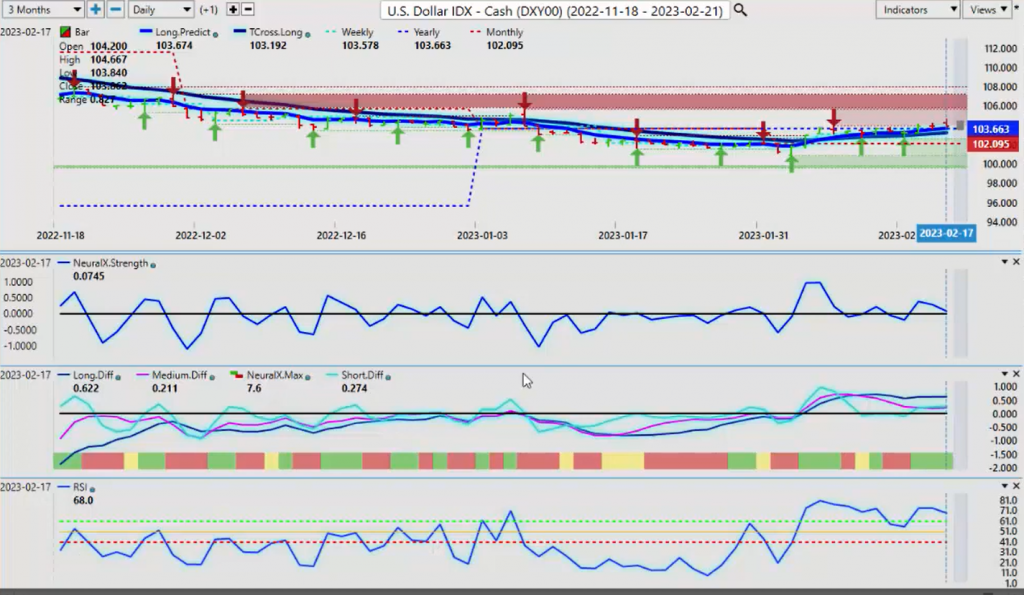
Hello everyone and welcome back. My name is Greg Firman and this is the VantagePoint AI Market Outlook for the week of February the 20th, 2023. Now, to get started this week, we’ll begin where we always do with that very important US dollar index. Now, the dollar attempting to make a bullish move, but just as long as we’re clear and understand why the dollar is advancing. As the Fed continues to flip-flop, the data’s coming in a little hotter than expected, so it’s opened the door to potentially more rate hikes. That’s what the market is now confused by, because again, the CPI’s still elevated. PPI is still elevated. Again, this is fundamental of interest rates is what’s, again, pushing the dollar up. Now, the Fed may come out next week and clarify a few points, or you’re going to have more media chatter about red Fed fund rates, whether they’re going higher, going lower, but it’s important that we understand that the fundamental picture of this may be changing.
In my respectful opinion, only the dollar would strengthen at this time of year anyway, guys, whether it be because of the Fed, because of a risk off scenario with China or Russia. Either way, the dollar usually does very well between February and the end of March, approximately maybe a bit into April, but you’re still going to have your ups and downs. When we look at this current situation, you can see the yearly opening price, they’re trying to close, but again, a rather weak close actually on Friday. 103.64, we’re trying to make a push higher, but again, some very, very significant resistance up here. That’s going to come in at the verified resistance high at 105 and even stronger verified resistance at 105.82. But for now, the first thing we need to do is hold above that very important T-cross long. The T-cross long coming in at 103.19.
Of course, the yearly opening price, which is critical at this point, which is sitting right there at 103.57. As you can see, at the present time, the dollar is not really quite as bullish as what it would appear. The neural index strength is actually pointing down when the market is trying to move up. Neural index is still high, but the RSI, there’s not a lot of momentum up here and the key tool that we want to look here is the medium term crossing the long term predicted difference, saying that there isn’t a lot of momentum here. Once again, we’ll keep a very close eye on interest rates, but as long as we’re above the yearly opening price and the T-cross long, the dollar could potentially extend to 105, 105.85, but you can see this dark red highlighted verified zone in here, and that’s a very, very dark, ominous cloud hanging over the dollar.
Gold
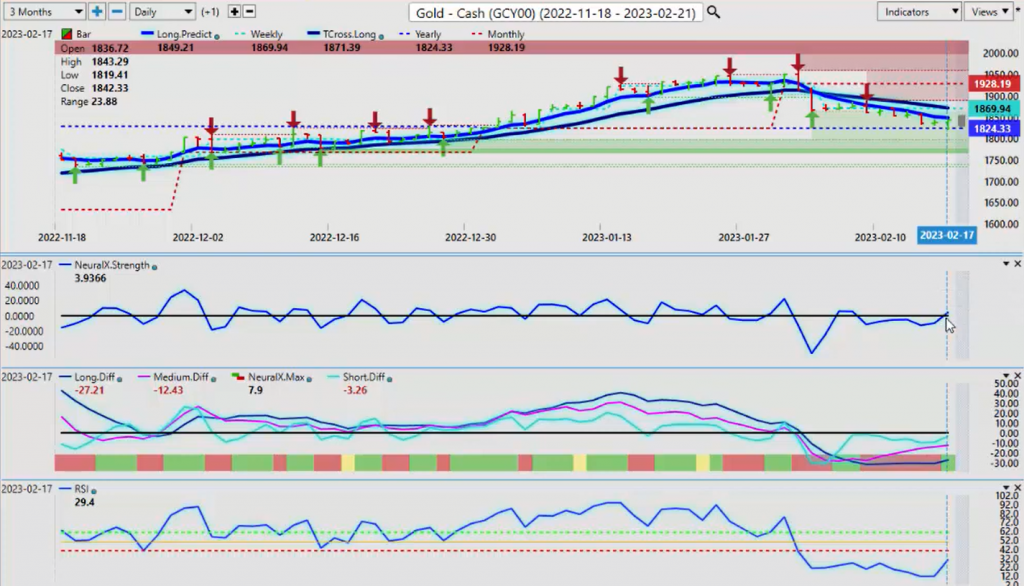
Now, when we cross reference this to gold using intermarket correlations, it’s certainly no coincidence that we’ve stopped. Gold has stopped dead on its tracks at the yearly opening price at 18.24. The neural index strength is actually starting to rise here. The medium term crossing the long term predicted difference, the medium term trend to the downside is weakening. Again, this points potentially that the dollar is not as strong as what the media is telling us that it is. Again, we look to these intermarket correlations to clarify these points. Now again, with that neural index strength pointing up, that’s very interesting. Our neural index is turned down after an extended long period, a very accurate period I might add, of the dollar holding below, breaking down below the vantage point, T-cross long, and then consistently moving lower. But if gold is going to turn higher, then always remember that gold and the dollar can move up and down together, particularly during a risk off scenario or an environment.
Once again, we’ll continue to monitor this, but for next week, 1824 on gold is an absolute critical level. In most cases, gold seasonal patterns usually pick up speed end of March, early April. There is potential for more downside, but the dollar would have to strengthen. Again, the indicators right now are not confirming that.
Crude Oil
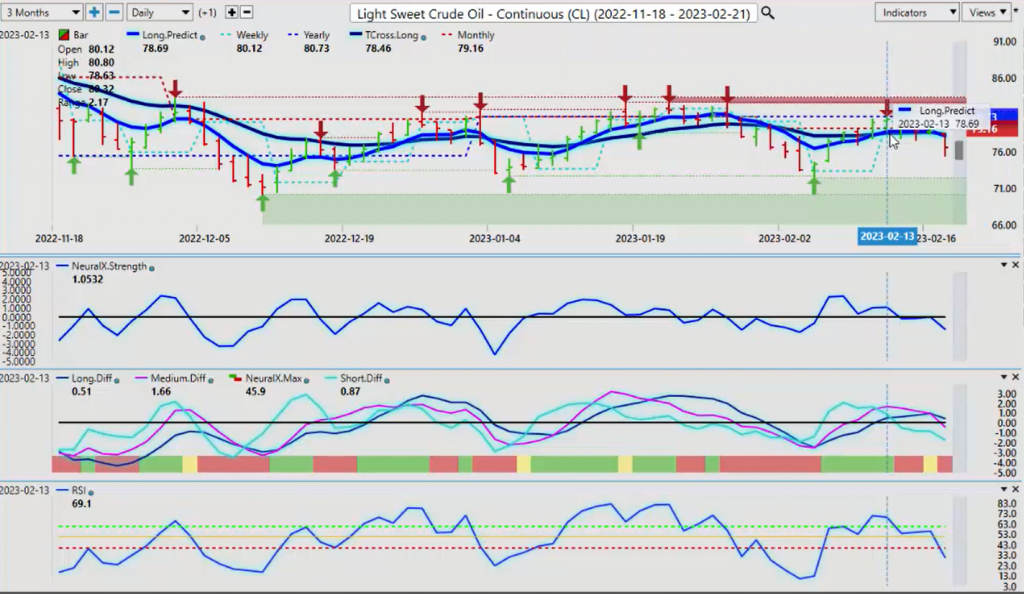
Now, as we look at light sweet, crude oil going into next week, once again, the market is moving into the yearly opening price that’s coming in at 80.78 and having multiple failures at that particular point. We’ve closed down below the T-cross long, 78.32, so that’s your resistance to start the week. We do have an MA death cross that has occurred on Thursday. You can see that that’s pointing down. The predicted RSI breaking below the 40 level. This is pointing to further weakness in oil contracts, so we’ll continue to monitor this into next week.
But again, as long as you know your levels, guys, and again, the T-cross long, that’s coming in at 78.32, our monthly opening price, 79.16 and the yearly opening price, which will be approximately 80.73. We’re below all three of these very strong levels, and the VP indicators are saying that there’s more losses ahead for oil.
Bitcoin
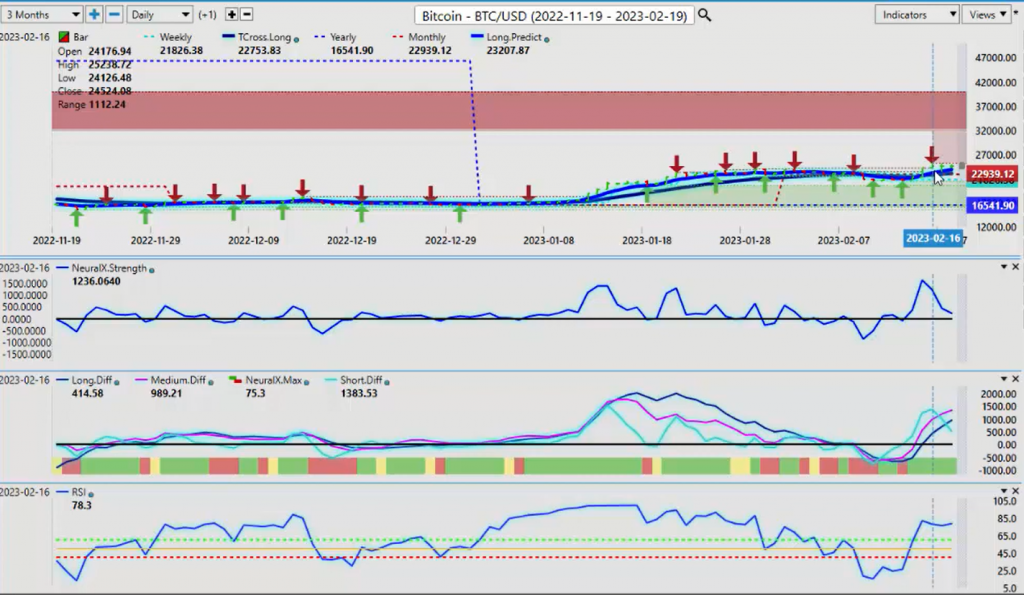
Now, when we look at Bitcoin, Bitcoin once again defying the slight sell-off in the equity markets this past week. Very, very interesting. Ultimately, what I would love to see is Bitcoin become its own asset class. Right now, Bitcoin is about 98% correlated to the global stock indexes. It falls into that risk on category, but right now, you can see that there’s a bit of resistance here starting to build around 25,238. But just remember, guys, the media pundits told you that Bitcoin was going to 12,000 in the first quarter. It went completely the opposite way.
The second stocks reversed higher, Bitcoin followed up with it. But again, a very interesting week last week where I’m yet to really see this where Bitcoin went higher and the stock market went lower and the dollar also went higher. I’m going to chalk this up to a holiday short week that the price action from last week may not be completely accurate because we’re going into a holiday Monday, President’s Day, I believe in the US and Family Day in Canada. The North American markets, the Monday, Tuesday reversal that we usually look for, we would push everything from Tuesday to Wednesday next week, because again, the North American markets are not really fully active on Monday.
Euro versus U.S. Dollar
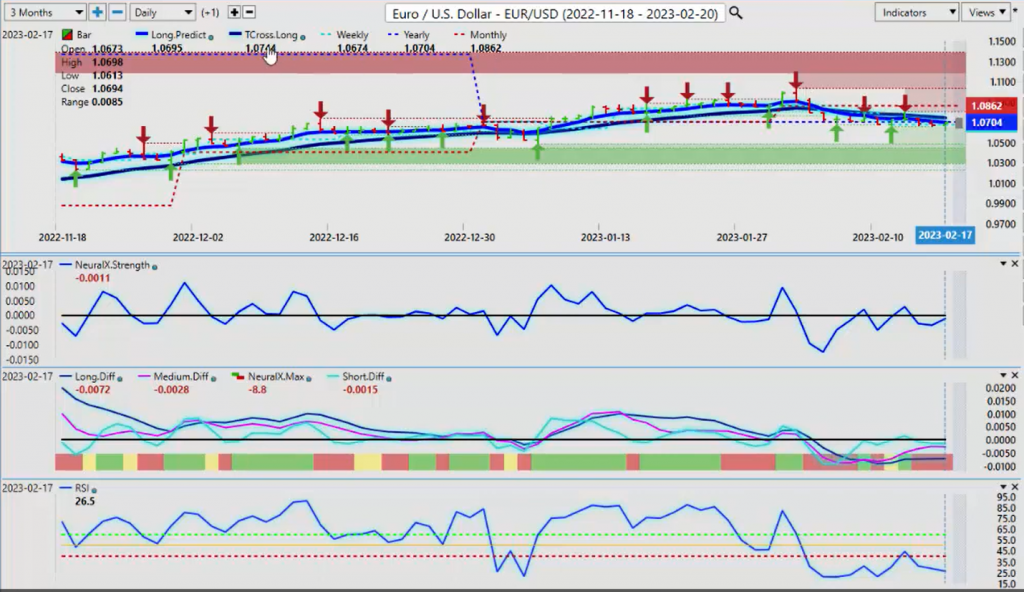
Now, when we look at Euro US, Euro US, you’ve got a lot of support building here. Now, this could be potentially a trending move, but the indicators from VantagePoint are very, very mixed here.
We’re below the T-cross long at 107.44 and the yearly opening price at 107.04, but we’re still not getting a breakout close here where we make a strong push away from the yearly and the T-cross opening price. That coming in at 107.44, so short while below 107.44, but we don’t want to run large stops on this because again, the dollar has been very misleading this year so far, to say the least, didn’t have a good January at all, and it’s struggling to turn positive on the year. Even at the end of this week, the dollar is barely even positive on the year. If the breakout is coming, then we must hold below these levels on Euro US, and we must hold above the levels on the dollar index.
U.S. Dollar versus Swiss Franc
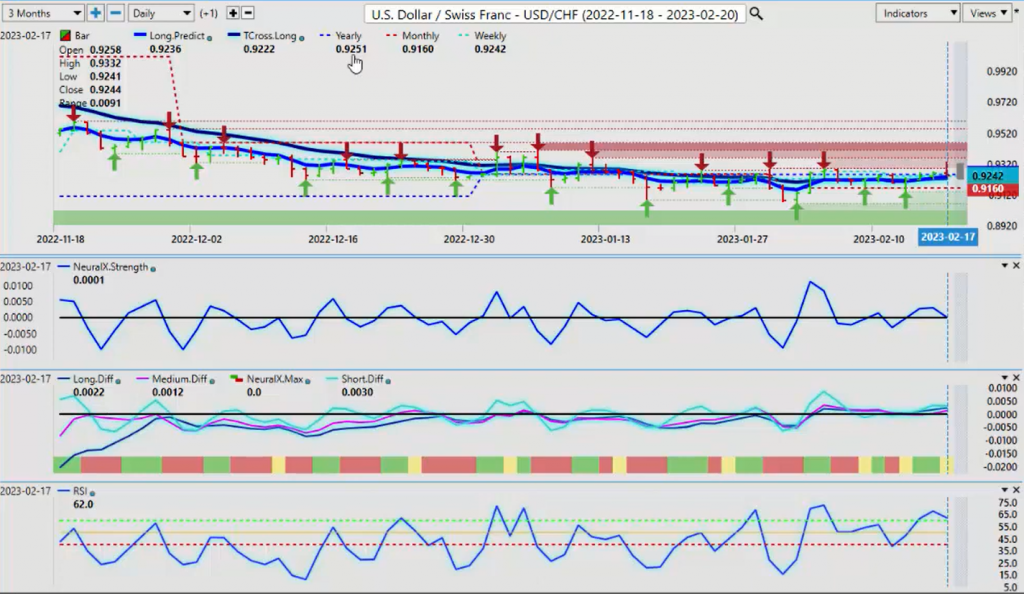
Now, when we look at US Swiss franc going into next week, again, if the dollar, and that’s a very big if. The dollar can break out to the upside, then US Swiss franc is likely to follow.
Again, we’ll look at the long predicted, 92.36, the T-cross long 92.22 is critical, but the yearly opening at 92.51, we need to get above all of these levels and stay above these levels. We don’t want to throw 50 different indicators at disguise. We’ve got to look at the fundamentals of this. What is the Fed going to do? Because again, the little bit of a bump the dollar got this past week was strictly because of the inflation data and it’s reignited the argument of more Fed rate hikes. Again, in my respectful opinion only, if inflation is still going higher and you’ve hiked this many times, then maybe that’s not working. Right? It’s going to be very interesting to see what the Fed’s next move is here, because I would think that the media pundits would start questioning some of this. But right now, the predicted differences are above the zero line.
But you can see, we’ve got a caution on the neural index. Neural index strength is actually pointing down, so it’s not looking as though the dollar is going to make a big move up. But if it does, then we would immediately buy US Swiss franc. We would have that opportunity of a place of value to buy dollars, but I just don’t think at this time, we’re there quite yet.
British Pound versus U.S. Dollar
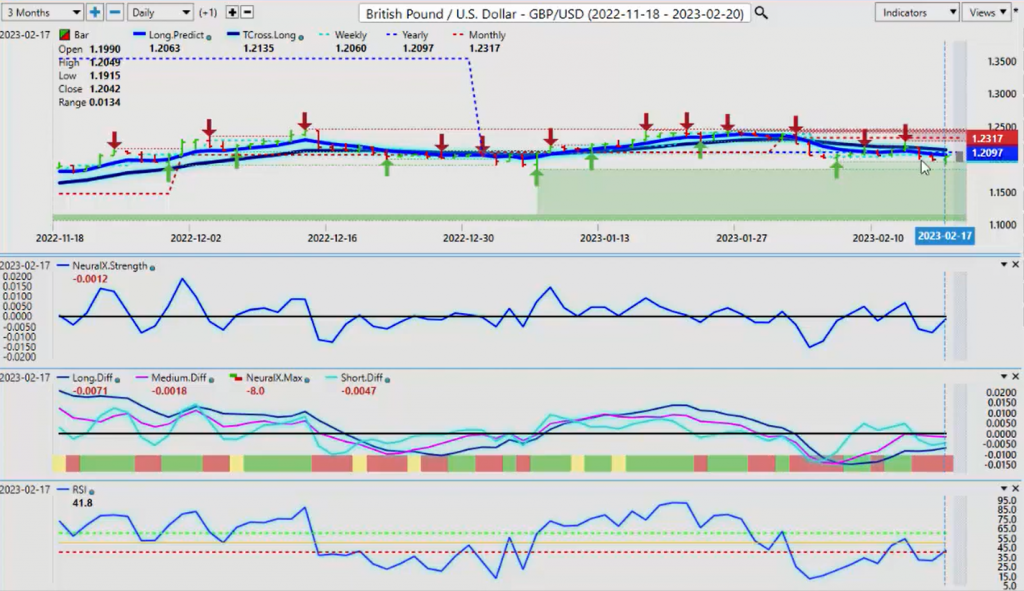
Now, the British pound, still struggling here again and rightfully so, but when we look at this, we’ve had a pretty good breakdown here. But when we look at our T-cross long, 121.35 and the yearly opening price at 120.97. That’s where your resistance is for next week. If we hold below this, then the pound would be likely… We would be looking for a move lower, but we must stay below these levels. At this time, the yearly opening price on a number of the 4x payers, the US dollar index, it really is a powerful tool to use because we’re just simply trying to determine if it’s positive or negative on the year.
Right now, the British pound is still negative on the year, but the close for the week at 120.42, we’re still easily within striking distance of the yearly opening price and the T-cross long. The key thing is understand where those resistance levels are. The predicted differences are actually rising, so is the predicted RSI and also the neural index strength indicator. Again, remember, Tuesday, Wednesday. Wednesday, we’re going to get a much better idea where our price is going. But the key thing is if you know your levels, then you can get out in front of this, because again, this is an outlook, guys, not a recap of something that’s already happened.
U.S. Dollar versus Japanese Yen
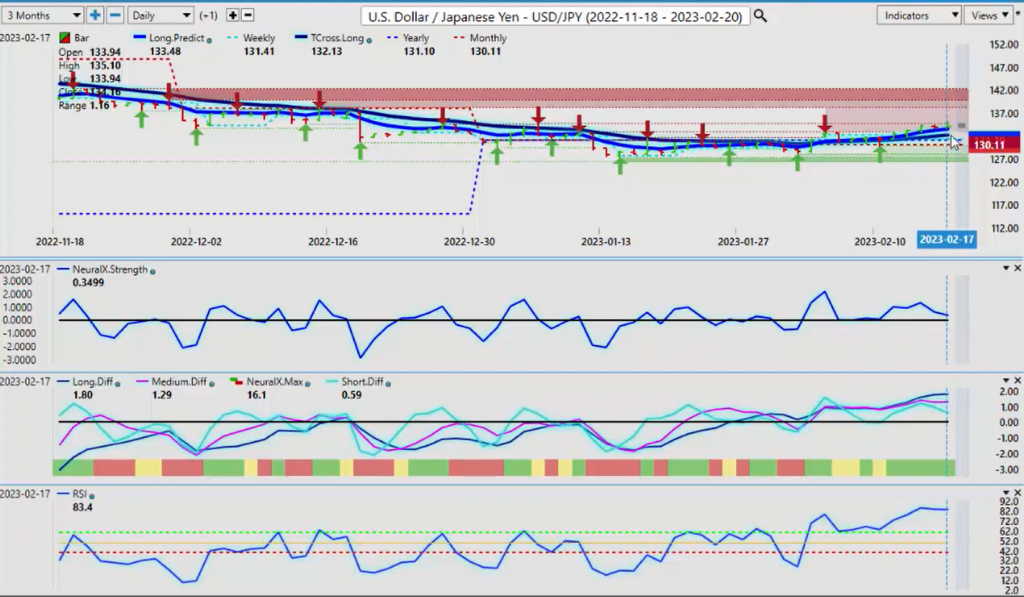
Now, when we look at the dollar yen, the dollar yen this past week has made a big move on the assumption that the Fed is going to have to hike again. There’ll be no pause. There’ll be no cut, none of this stuff.
But again, the dollar yen is going to face some headwinds up here. We’ve had a pretty solid push. We’ve cleared the yearly opening price at 131.10, the T-cross long, 132.13. Yes, there is a fundamental long there while we hold above these levels. But again, the Fed news or the Fed funds rate last week after that inflation data, dollar yen immediately popped on that and make no mistake that that was the fundamental driver across most of these markets last week. Again, when we look at this right now, if as long as we understand these levels, we can trade them them. Now, the neural index strength is not overly strong here. The predicted RSI is obviously an overbought territory, but the dollar yen can very often ignore those types of overbought oversold signals, so be careful with that. But more importantly, let’s see what we get from the Fed next week.
U.S. Dollar versus Canadian Dollar
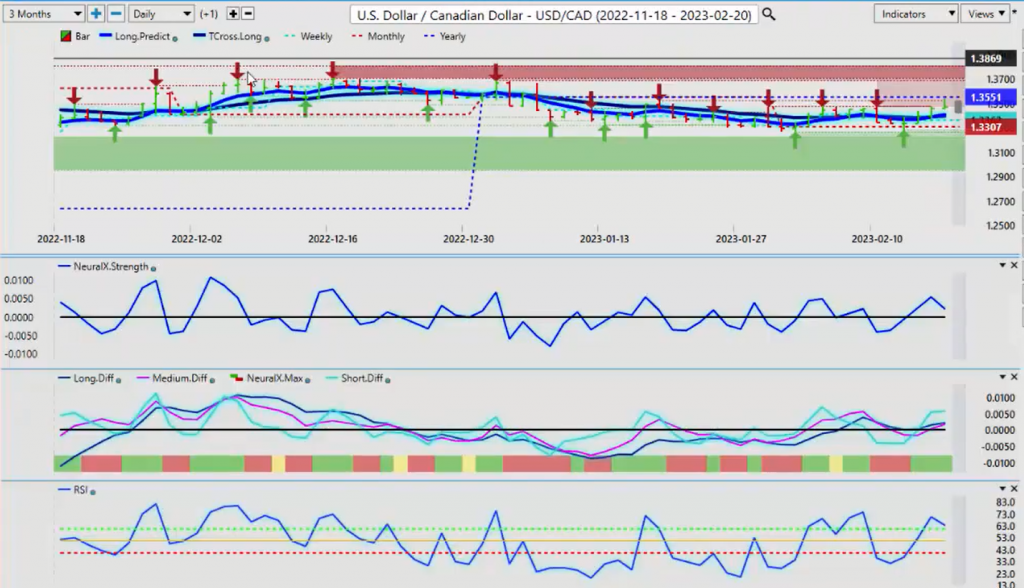
Now, the US-Canadian pair, once again, we have approached the yearly opening price. We did it again last week, hitting the yearly opening price at 135.51 to the number and then immediately backing away from it. Our neural index strength is pointing down, but our predicted differences are above the zero line. Again, this is a warning sign that there could be some additional strength. We’re looking for the pink line here to cross the blue line and that would tell us we’re getting ready to blow through, potentially push through that yearly opening price. But as you can see throughout the calendar year of 2023, that we have not been able to get above that yearly opening price despite multiple attempts, and then ultimately a failure. Again, this could be the one, but if it’s going to break and hold above this level, it likely will not be until Wednesday, maybe even Thursday, guys, with the holiday on Monday. Be careful with this pair because it’s notorious for reversing from Monday to Tuesday.
Next week, it would be Tuesday to Wednesday.
Australian Dollar versus U.S. Dollar
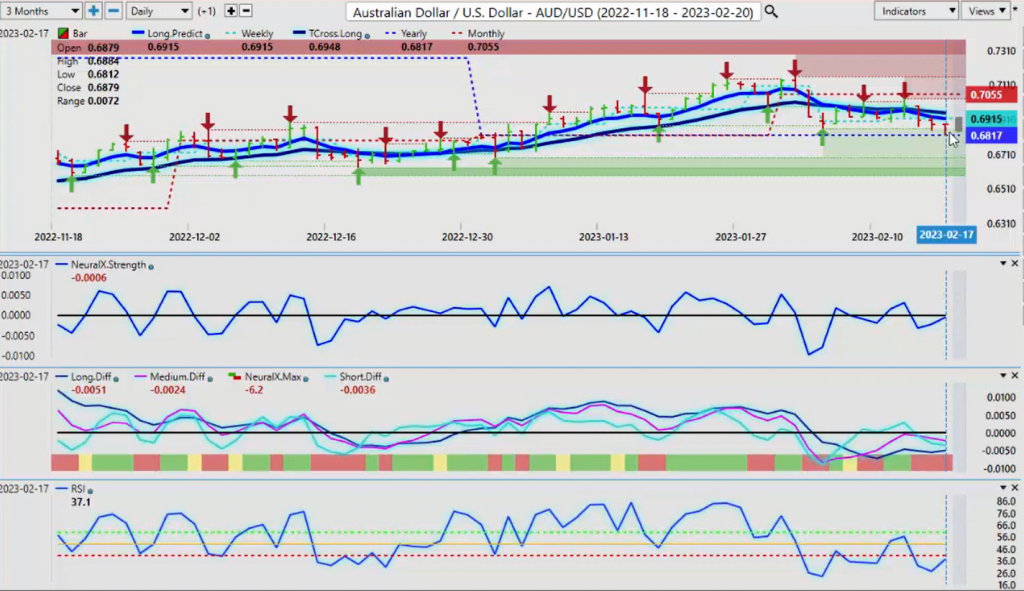
Now, when we look at the Aussie-US, the Aussie is. Again, we’ve got an epic battle going here once again at that yearly opening price of 68.17. We’ve hit it on Friday, and it literally shot out of that area like a cannon. As you can see, there’s no Fibonacci levels or waves or accumulation. There’s accumulation distribution overbought oversold. There’s none of that here. Just strictly a loan number of 68.17, the yearly opening price. Now, again, in most years, this would be a time when the dollar would be at its strongest other than in September. What we would need here to understand the intermarket correlation is we would need the equity market selling off. If they sell off, the Aussie doesn’t stand a chance.
New Zealand Dollar versus U.S. Dollar
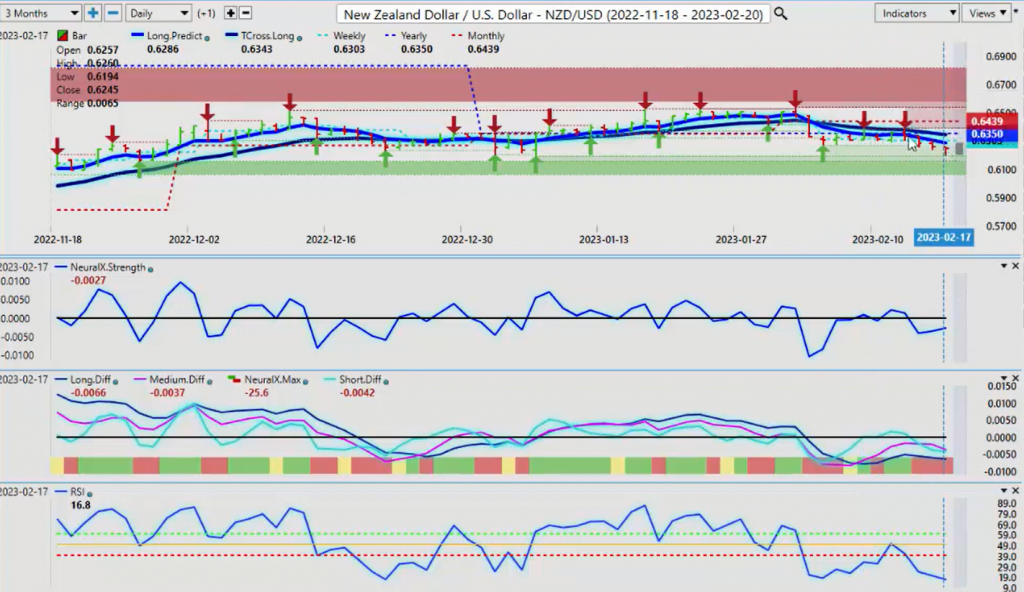
That same thing would apply to the kiwi, but you can see that the kiwi has already slipped below its yearly opening price. We’ve had a few retracements, but we’re not closing above that critical 63.14. We’re now slipping below here. Now, the two predicted moving averages that I have on the screen here is not in the standard blue line in the black line. This blue line is the VantagePoint long predicted. That’s acting as a daily pivot point for day traders. The T-cross long is our more of a trend to finding predicted moving average, where what it’s doing is saying, “Okay. The theory is while below it, we’re short. While above it, we’re long.” But any significant push away from that T-cross long would kick in a mean revision theory.
Right now, I don’t believe there’s a mean revision theory here on a number of different markets, but a potential breakout could be imminent. My concern, the predicted RSI here, again, heavily oversold. We could see a retracement here, but I don’t know if that’s going to translate into a new trend. But with all of this volatility that will be coming up next week, there certainly will be some opportunity. The critical thing is to know your levels in the first quarter. With that said, this is the VantagePoint AI Market Outlook for the week of February the 20th, 202-


