Welcome to the Artificial Intelligence Outlook for Forex trading.
VIDEO TRANSCRIPT
Hello everyone, welcome back. My name is Greg Firman, and this is the Vantage Point AI Market Outlook for the week of February 1st, 2022. Now, to get started this week, the first thing we’re going to do is check the indicators we’re using in this week’s presentation to do a full, thorough and complete analysis of the markets using the Vantage Point software, and the many tools that they have. We’ll be using bars, not candles, we’re using our long-term crossover, our long-term difference, our medium-term difference, our neural index, our point in time, predicted RSI, short-term predicted difference, triple EMA cross, and of course the verified zones. Now, in this presentation, I have modified both the triple EMA crossover and move the shorter term predicted moving averages off so we can focus on the T-cross long.
On the long-term crossover, what I’ve done is I’ve removed the actual black line and we’re using just the predicted moving average, or the long predicted. Now, to get started this week, the dollar has moved higher as predicted for the entire month of January in this Vantage Point AI Market Outlook. This is the difference between basically an outlook and looking at something that’s already happened, which a lot of programs, a lot of indicators, they tend to do that. But we’ve discussed this, going back into the middle of January, that pending dollar strength is imminent. We discussed it in last week’s weekly outlook and the week before that. So what we’re looking for is identifying these actual turning points in the market. Now, what I had discussed was on January the 14th, we had our medium term crossing our long-term predicted difference, that has crossed the line and has moved higher.
U.S. Dollar Index
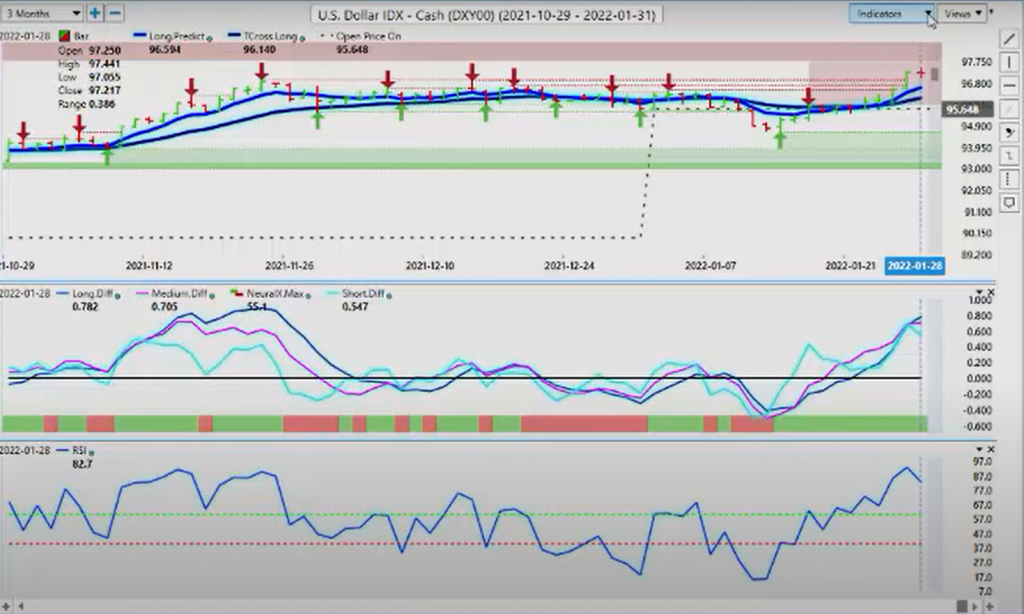
These modified predicted moving averages that I’ve added, they’ve done the same on or about January the 21st, that has led to a substantial rally breaking through all of our main resistance points. Now, what we should be concerned a little bit here is, we have that same crossover that put us long is now warning us that we’re losing a little bit of momentum up here. Now that’s perfectly normal considering the big moves that we’ve had this past week that were predicted long before they actually happened here, guys. So again, when we’re looking at these moves now, we should allow for somewhat of a retracement to begin the trading week. Now our two or replacement points are going to be the long predicted at 96.59 and our T-cross long at 96.49. Our yearly opening price is at 95.46, and we remain long in the US dollar while this level continues to hold. But we should expect some type of minor corrective move lower, but I would be looking at the more around the area of the long predicted.
Now that long predicted at 96.59, we have our predicted low at 96.94. I do not anticipate that that predicted low will hold to start the week, I anticipate we will move lower, for again, if on nothing else, on some degree of profit taking.
GOLD
Now, in the Vantage Point live training room, we discussed this on Wednesday, and I gave the room teaser and said, “Gold is going lower next week, we’ll be discussing it on Monday.” Well, that move had happened a little earlier than I suspected it would, but it did. The fed has pushed it down, has helped gold along, but either way, gold was on borrowed time up here unfortunately. So when we look at the actual shift in the trend here, we’ve got our medium term crossing our long-term predicted difference on or about January the 20th. That is when this move actually started guys. Using these indicators that use two crossovers visually at the same time, the pink line crossing over the blue line, that forewarned us that this was coming. When the neural index came on board, the move accelerated to the downside.
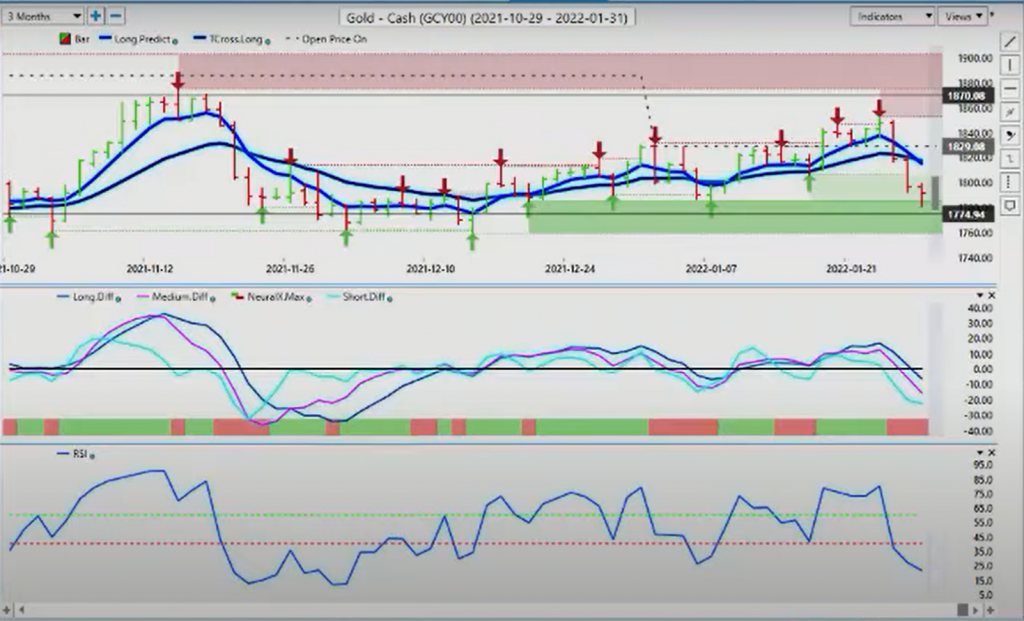
This is actually when we discussed it in the VP live room again, on Wednesday that I had stated that it is very unlikely gold goes higher from here. Now the bigger concern I would have with gold bulls is, we’ve also, again, this year slipped below the yearly opening price. That price on open at 1829, that is your key level to watch this coming week because again, we still have a conflict in the Ukraine. It doesn’t mean that gold is down and out just because it’s sold off on the dollar strength, but it certainly does look that we have room to extend here to the downside.
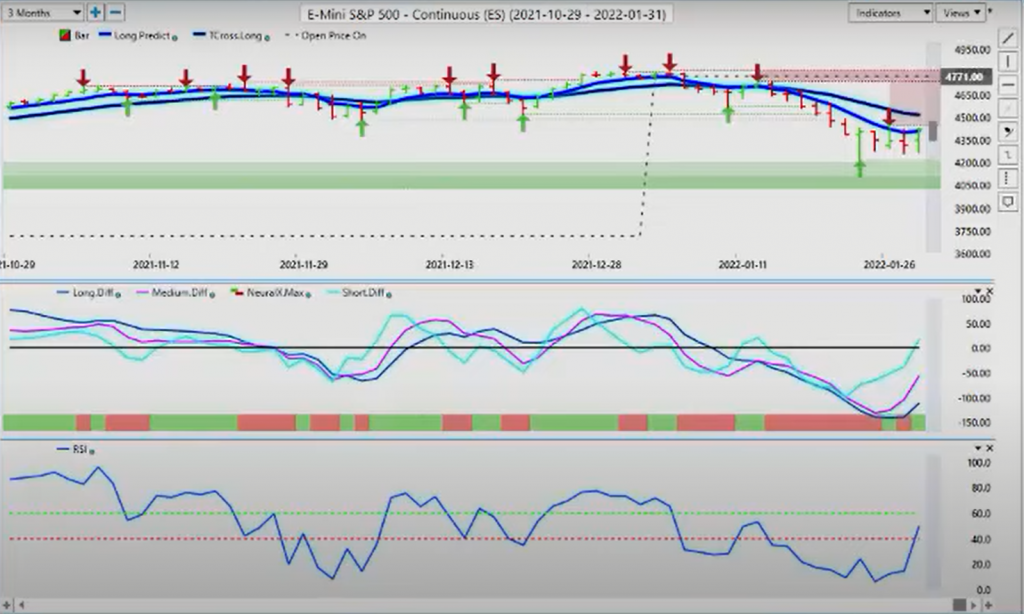
Now, when we look at the equity markets, the equity markets really didn’t stand much chance with everything going on. It was bad enough with the Russia and the Ukraine conflict, then you get a hawkish fed on top of that, of course the equity market’s tanked. Now, when I look at this now, for the start of the week, we have what I would consider to be relatively heavy support at 92.12. So you can see the market is these bars are bunching up down here, and the slope of that long predicted is starting to gradually turn back up. Our predicted differences are rising, our predicted RSI is coming out of heavily oversold territory, but again, right now guys, this is a corrective move to upside, only unless we can and clear that very important T-cross long at 45.19. I believe that would be a very tall order under the current circumstances.
S&P 500 Index and Crude Oil
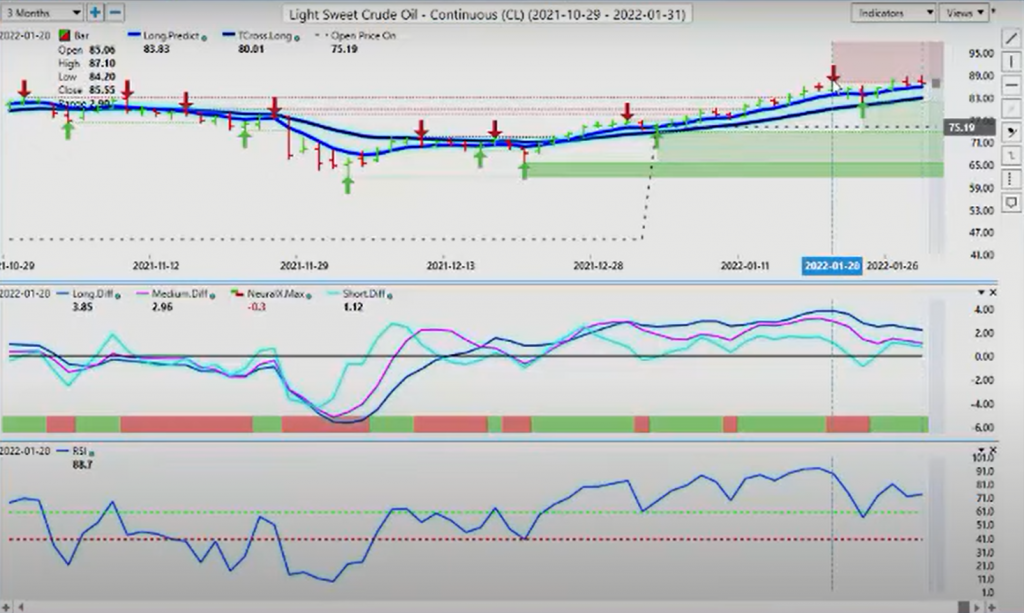
Now, when we look at oil, oil broke its correlation to the S&P 500 and it’s holding its gains, but it’s still struggling up here. We’ve got heavy verified resistance using those very popular, verified support and resistance zones in the vantage point software. That verified high is 87.10. This could be very difficult for oil to push above this next week, but we know that key level. Our predicted differences are basically flat here, but our two key support levels for oil, our first comes in at 85.90, then we’ll be 82.86, and of course the very important, yearly opening price at 75.19, we still remain long while above that current level.
Bitcoin
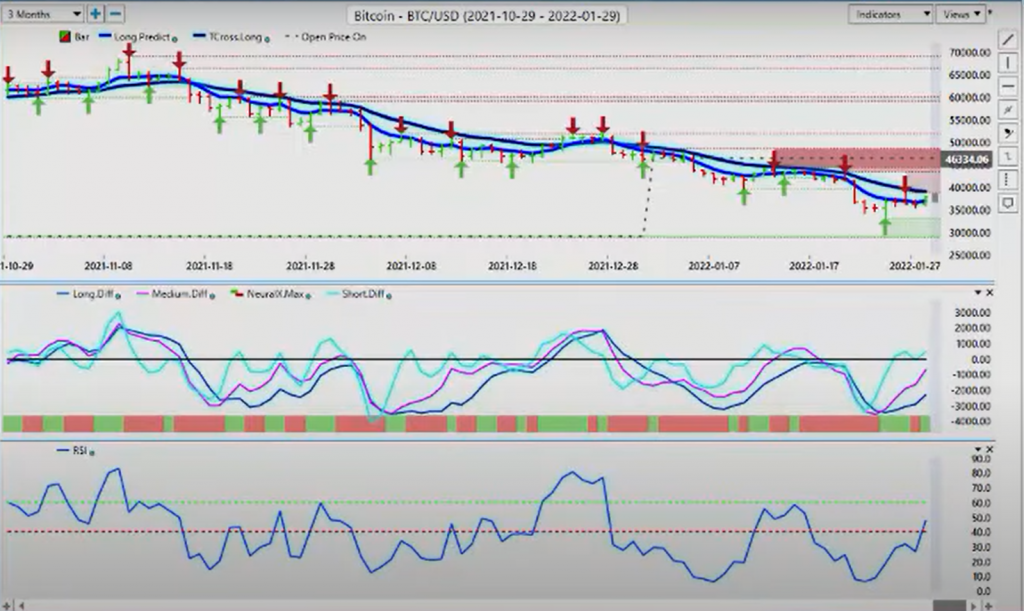
Now, when we look at Bitcoin here, Bitcoin again is benefiting actually from this dollar strength as I’ve discussed on these presentations and in the VP live room, that Bitcoin appears to have a very high correlation actually to the US dollar, not just equities, not just the tech sector, the NASDAQ, there’s also that core relation to the US dollar. So once again, as we can see, this previous week we’ve got our medium term crossing our long term predicted difference, giving us a clear warning that we’ve bottomed out at least for now, at 33,076, but at the current time, this is a corrective move higher. The reason I’m saying that is, until we break above the T-cross long at 39,142, for the calendar year, Bitcoin is bearish on the year so far. I’m not saying it’s going to be bearish the entire year, this is a weekly outlook guys, not a quarterly outlook or a monthly outlook, or even a yearly outlook, it’s for one week. So in the coming week, we’re below the T-cross long, and we’re below what is far more important to me, the yearly opening price that’s now 46,334. We should never lose sight of that particular number, because very often in the first quarter, regardless what the trend is, the markets tend to retrace back to this particular level. Right now, it appears that that is in progress, a retracement moving higher, but we must clear the T-cross long at 39,142.
Euro versus U.S. Dollar
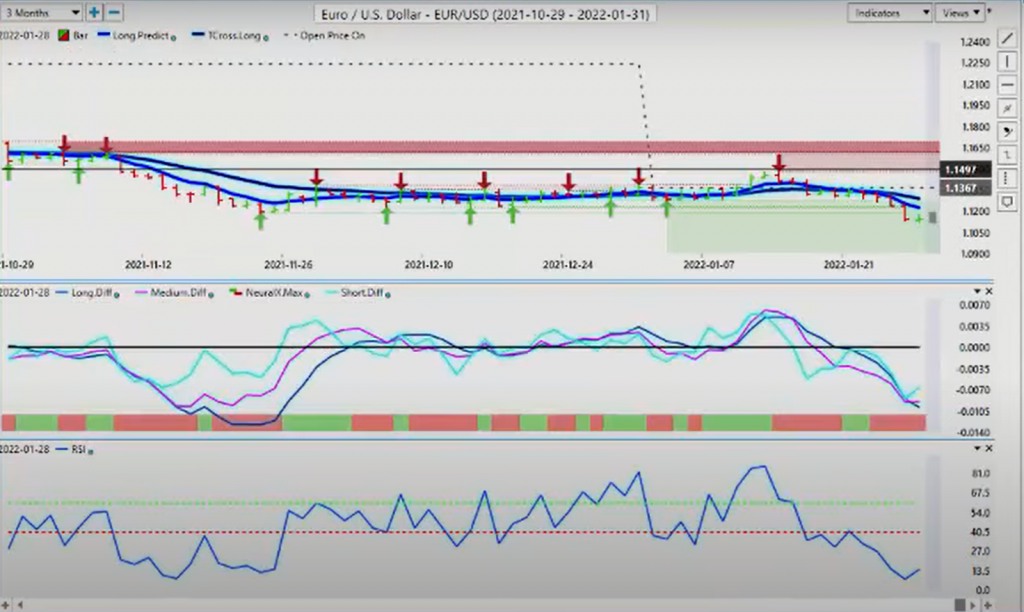
Now, as we move into some of our main forex pairs to start the week, once again, the level of predictability in the forex market in my respectful opinion only, is much higher than some of the other markets because of that dollar cycle that I’ve talked about repeatedly around the beginning of the month, that institutional funds need to buy dollars, or governments need to buy dollars. Once they stop buying dollars, then the dollar tends to soften a bit again, and it’s at the mercy of the market. But for now the dollar is in full control here. Now, our long predicted has crossed over our T-cross long, producing a very, very strong sell signal. To begin the week last week, we stayed below the opening price and below the yearly opening price, and you can see a short anywhere in this area worked very well as we were preparing for this dollar strength.
Now, in my respectful opinion, again only, I realize the Euro is in a down trend. I really realize all of that, but I also realize that nothing goes straight up and straight down. So retracement is likely. If we were to fine tune a retracement point to begin the week, I would be using the long predicted at 112.24. We can also use the Vantage Point predicted high at 111.91, but stops must be above the T-cross long at 112.91, very, very important that I point that out. Very often, I’ve seen traders that are razor sharp on their entry, but their stops are wrong. And that’s because they listen to such nonsense as, “Cut your losers short, let your winners run.” There’s no mathematical equation, at least that I’ve seen, in real money trading, that actually works.
You need to identify critical points and understand that if you put a stop between where the current market is now and the T-cross long, that that would be a sucker’s bet. They are going to target that stop. So keep it away from this, and in my respectful only, stops should be above the yearly opening price on shorts, above 114 is where the real stops should be, excuse me. But again, our primary trend is still down, but that medium term crossing the long term predicted difference, should the neural index turn green, then that would confirm we are going to retrace higher before the next leg down.
U.S. Dollar versus Swiss Franc
Now, the carbon copy, the inverse carbon copy would EUR/USD shorts would be US/Swiss Frank longs. Once again, I had mentioned that in several of the weekly outlooks over the month of January, that we’re using that yearly opening price, and we’re watching it very closely. This past week, we used the yearly opening price and the weekly opening price I might add, as a springboard to get long, but the Vantage Point software was already telling us that this was in progress.
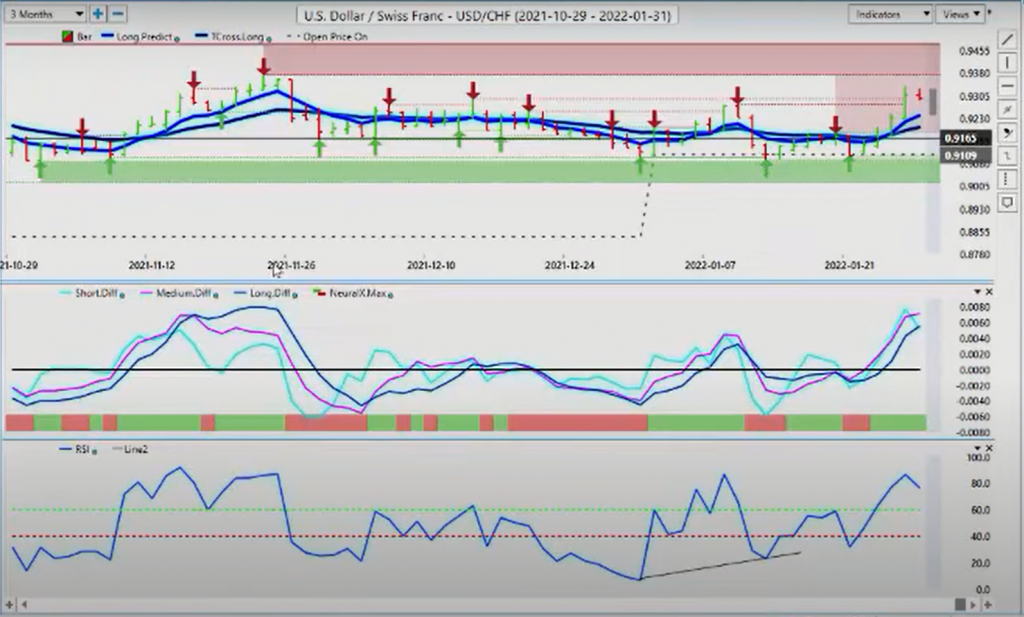
So if we don’t get on the train here guys, then the train leaves the station without us. Right now, we are headed into very strong verified resistance at 93.73, be careful of course, around that area, and I could argue be careful around this zone here too, because again, we’re looking for a retracement. We always want to let the market move lower before we buy it, and we all always want to let it move higher before we sell it, right? So I think that we will have a retracement on this pair also, potentially again, we will use the long predicted at 92.41, our T-cross long at 92, and of course, long while above 91.09, and again, only in my respectful opinion, the minimum stop should be below 92.01.
British Pound versus U.S. Dollar
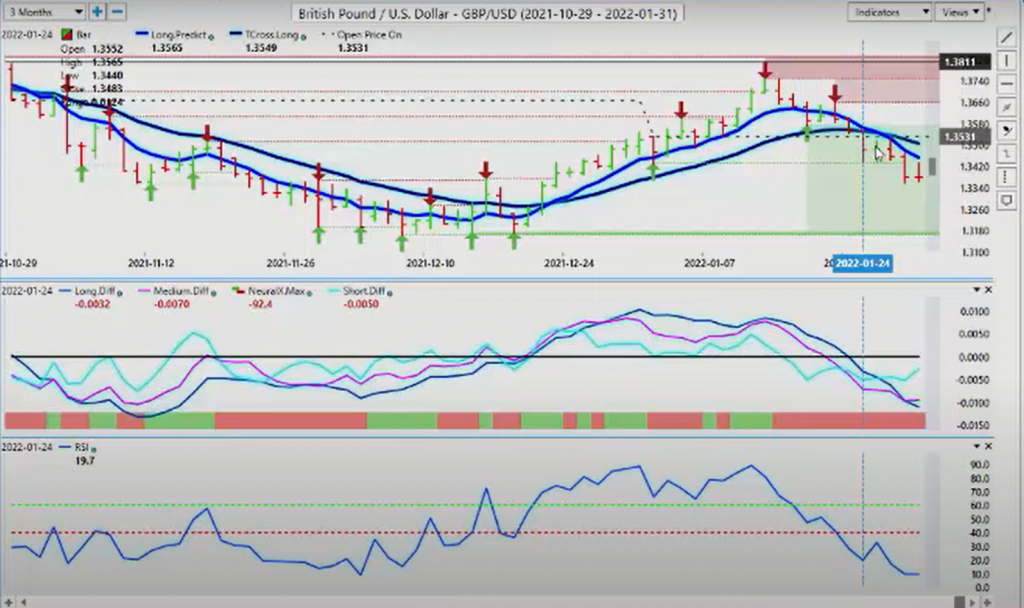
Now, when we look at the British pound next week, again it too, slipping below its weekly and yearly opening price, you can see that that began right at the start of the week. As we anticipated this dollar strength. Over the many, many years that I’ve been on Trader Planet doing these presentations for the Vantage Point AI YouTube channel, I’ve repeatedly talked about this dollar cycle. I don’t hear a lot of people talking about it, but it’s a known period. It’s not an exact minute, it’s not an exact hour, and it’s not even an exact day. So I always round it out. You don’t hear the weatherman for example, saying, “Well, tomorrow we’re anticipating 35,000 drops of rain.” No guys, we hear them say that there’s a 20% chance of significant rainfall between these hours. So again, we don’t want to split hairs, the end of the month, into the first week of the new month is where we would normally anticipate this dollar strength.
So again, the primary basis of forex is, you’re either buying or selling US dollars guys, that’s a game. So when we look at this, this is a place of value, but we’ve got the Bank of England next week, be careful here. They could come out just as hawkish as the FOMC. And while I don’t anticipate the Euro to recover to any real extent, the pound could. So we identify the key levels again, 1.3455, excuse me, on the long predicted, our T-cross long 1.35, and our yearly opening price. 1.3531. All of our resistance is right there guys. And then we have the Vantage Point predicted high to begin the week at 1.3450. So 1.3450 would be a starting point. Not an ending point, just a starting point. And then we would make sure that if we are staying with this primary trend to be, that we would keep all stops above the yearly open putting price.
Again, my concern that I’m warning people of is that medium term crossing the long term predicted difference, the same thing that would put us into a trade, would make us still cautious sellers of this pair. But again, be careful of that Bank of England this coming week, and know your levels.
U.S. Dollar versus Japanese Yen
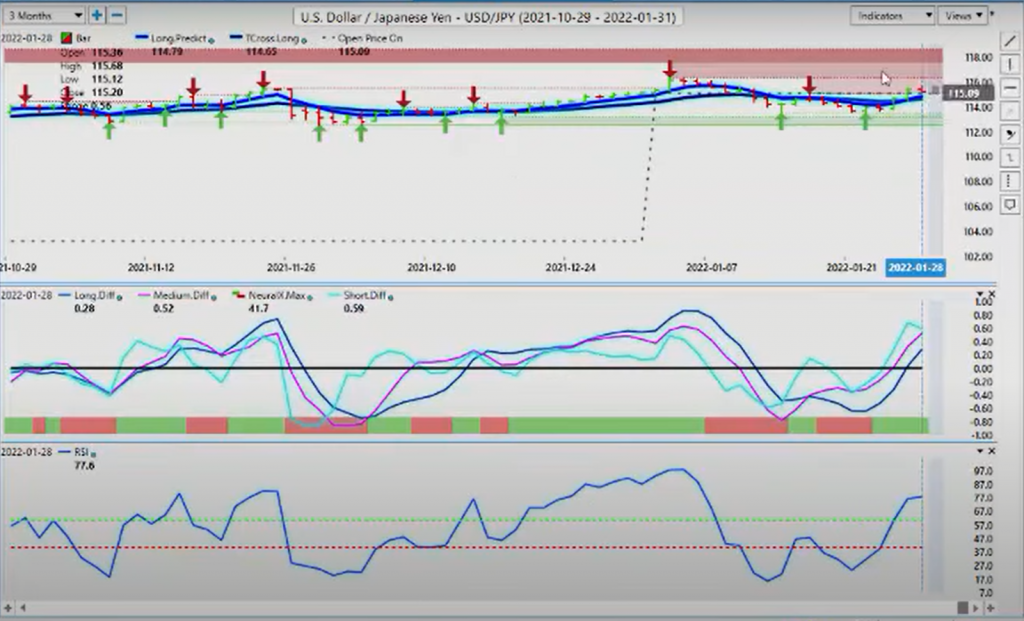
Now with the Dollar/Yen, we’ve got to fresh buy signal forming here. Again, it’s all about buying or selling us dollars in the forex market guys. So right now this could be a place of value, because this channel that’s been running, that I’ve talked about this channel over the last several outlooks, continues to hold. We held right here our predicted differences, turned to the upside, we broke our 60 level on our RSI. So to begin the week, what we’ll be looking at is, again, identifying key support levels. Starts at 114.79, 114.65, and our yearly opening price is 115.09. We have closed just above that.
It is entirely possible guys, that the market doesn’t get below one 115, barring any nonsense out of Ukraine, I have no control over that. If that conflict accelerates, that could change things, but we can’t base all our trading worrying about a geopolitical event. We can’t do that. We’ve got to say, “Okay, our predicted differences are rising, our neural index is good, everything on here is good, we’ve got our modified crossover with our long predicted crossing over our T-cross long, with my own direct client base, I’ve had them going along from the middle of the week. And again, we do have to break through this resistance zone, that’s why those verified zones are there. That verified high is 15.06 in my respectful opinion, we are likely moving this week, at some point during the week, we will be moving towards the 116.34 level.
U.S. Dollar versus Canadian Dollar
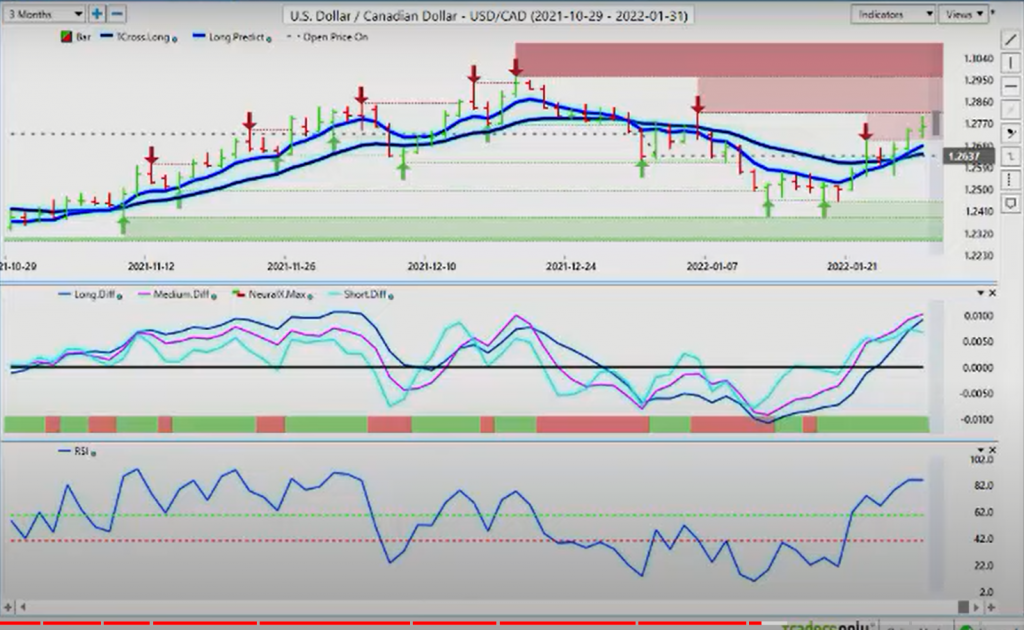
Now, with the US/Canadian pair, our three main equity currencies, the Canadian dollar finally succumbed to the pressures of the falling equity markets, the geopolitical issues, but as I had stated in the previous weekly outlook, it was my view that the Bank of Canada was not going to hike, because again, most people don’t realize that most of Canada is still in some type of a lockdown. So for the central bank to say that the economy is doing well, everything is fine, everything is wonderful, that would not be factual. Most of the economies are shut down and most of the economies in Canada are not running at capacity, restaurants, gyms they’re all closed, so people are still working from home.
So this is starting… It was my opinion that the bank would not hike based on that until Canada comes out of full lockdown, which probably won’t be till April or May. So if that’s the case, then I would suspect the Bank of Canada will be on hold until then. So right now we have a fresh crossover on Wednesday, but again, we’re heavily overbought here. We’ve got a verified resistance high, at the 127 level we took it out, but guys, when we’re looking at long trades like this, we always look below. We don’t just look above, we look below too. So our above resistance to begin the week 1.2813, but on the downside, this is where all our support is. We’ve got the T-cross long at 1.2647 long predicted 126.80, and our yearly opening price at 1.2637. So there’s a common theme running between here.
What the savvy trader could even do is, add all of these three numbers together and then divide by three, and you will get an average price of where the buy point would be. So once again, if we look at the Vantage Point predicted low, that’s coming in at 1.2723, that is simply your starting point guys. Your additional points below that are again, 1.2680 and 1.2640, but all stops on longs must be below 1.2637 here guys, okay? But we should again anticipate, if I’m to give you a prediction for Monday with this US/Canadian pair, the likely outcome is, we have a significant retracement to the downside as equities recover, and then on Tuesday, it continues to move higher. That’s what I would be careful of. This pair is notorious for those kind of contrarian moves or reversal moves on the Tuesday.
Australian Dollar versus U.S. Dollar
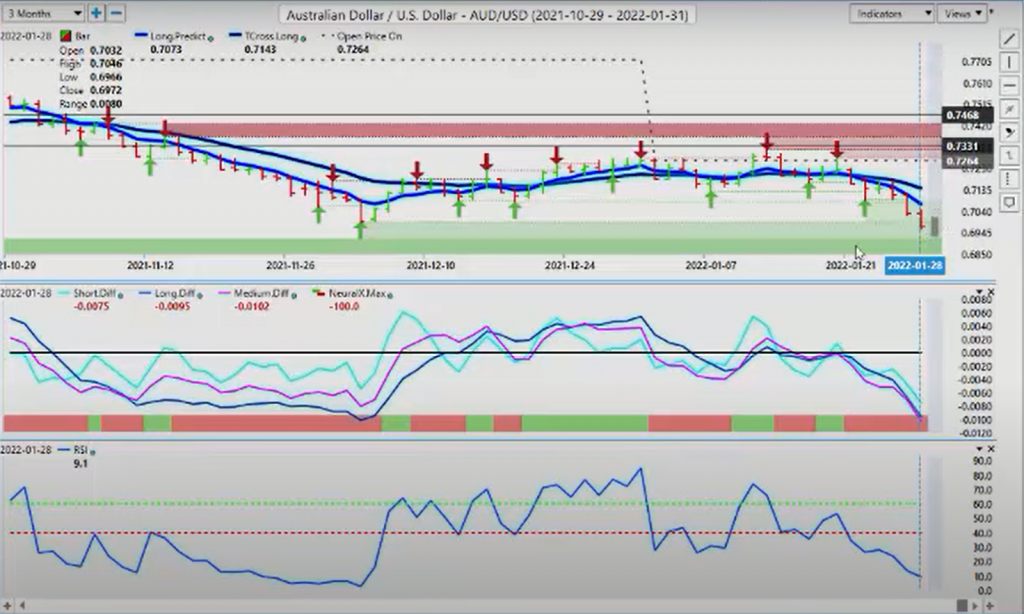
Now, with the Aussie, the Aussie and the New Zealand will be at the mercy of the equity markets. They can’t hang their hat on metals, because again, metals are falling on a hawkish fed. So right now we are moving lower, but with a number of these markets, we’ve moved a considerable distance. I could argue too far, too fast. So a retracement is likely here guys, with the Aussie. We’ve got those same levels, our long predicted 0.7073, our T-cross long 0.7143, and then the yearly opening price at 0.7246. So we have a wall of resistance up here, but it starts at 0.7073. The additional resistance area here would be the predicted high at 0.7014. And again, only in my respectful opinion, there’s a big gap between the predicted high for Monday, and the long predicted. So I would be more cautious with this pair, and would hold out for a price closer to the 0.7073 level.
New Zealand Dollar versus U.S. Dollar
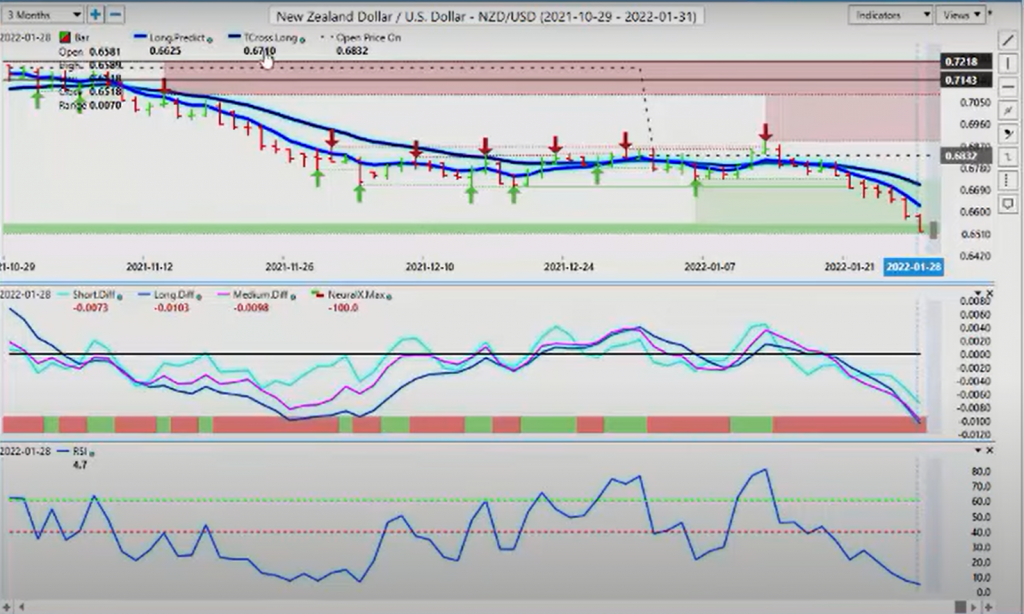
The same thing would apply to New Zealand. We’ve had a big move down, it’s moved down quickly. When we look at the New Zealand/US, you can see again, 0.6625, 0.6710, 0.6832. We have our predicted high at 0.6559. I do not anticipate that predicted high will hold, I would anticipate that the market will move somewhere between the predicted high and the long predicted at 0.6625. So at 0.6625, and the predicted high of 0.6559, we want a blended price to begin the week, because we should expect volatility again, to begin the week. So with that said, this is the Vantage Point AI Market Outlook for the week of February 1st, 2022.