Welcome to the Artificial Intelligence Outlook for Forex trading.
VIDEO TRANSCRIPT
U.S. Dollar Index
Hello everyone and welcome back. My name is Greg Firman, and this is the VantagePoint AI Market Outlook for the week of December the sixth, 2021. Now to get started this week, we’re going to begin where we always do with that very important US dollar index. But first and foremost, a quick look at the indicators we’re using this week. We’ve got our 45 week look back. We’re using bars to keep things simple, not candles. We’ve got our long term crossover, our long term predicted difference, our medium term predicted difference, neural index, neural index strength, which we’ll discuss more at length in this particular presentation. Our point in time to tell us how we’ve done on the week and where we’re going for next week. The very important predicted high and predicted low, our short term predicted difference, our triple E, our modified triple EMA cross using only the key level to help weed out these levels here to avoid some confusion and of course the verified support and resistance zones.
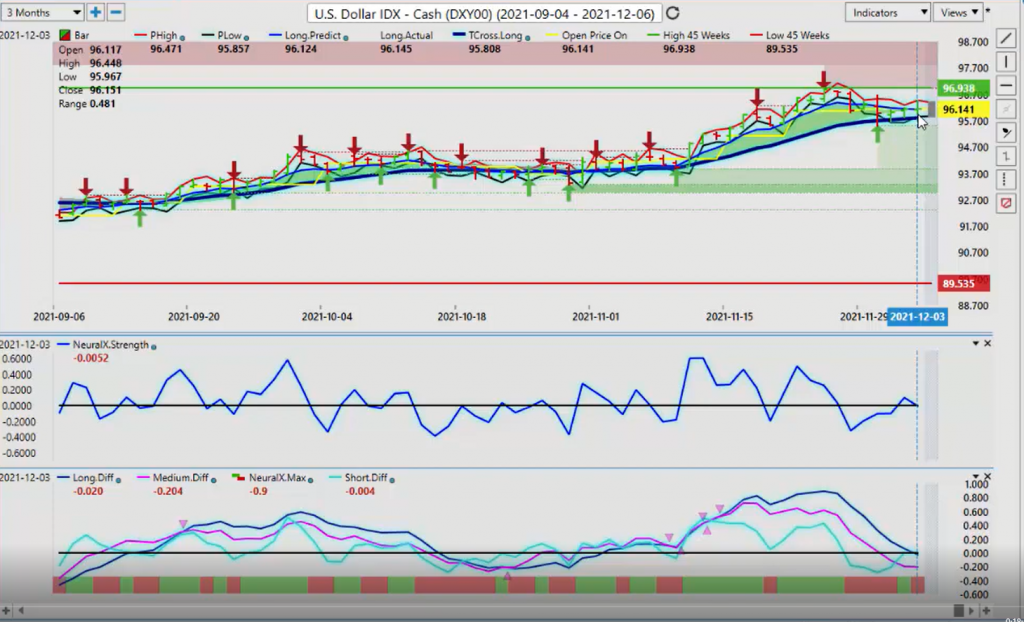
Now to get started this week, brief discussion about the nonfarm payroll number. In my respectful opinion only, it was a rock solid number out of the US. The headline number missed, but you’ve got upward revisions. The unemployment rate is fantastic. The U6 number is fantastic. So I don’t think we want to get too caught up in that. Now what I will briefly say also is that seasonality and trading are very important. And in my view, there has been a seasonality that the dollar has not done well in the month of December. It does very well however, January through the end of March. So I would expect some dollar weakness. So when we look at our VantagePoint charts in last week’s presentation, you’ll remember that I gave you a very specific level to start the week, because is an outlook, not a recap of something that’s already happened.
It’s a forward-looking outlook. So we identify key pivot levels in the market so we can determine if something is bullish or bearish. By modifying the T cross or the triple EMA cross using this key pivot level, that level is now coming in for next week at again, 95.80. So when we look at this 95.80 market, it has held the entire week. Now our neural index has been sloping down and we’ve had a bit of a recovery, but you’ll notice that even if I just put a bit of a trend line onto this particular neural index strength indicator, that’s not looking very well. And now we’re starting to break down below the zero line. So even though we had a good non-farm payroll number, it’s not a given that the dollar is just going to go higher because of that.
And in actual fact, the dollar may struggle next week, because very often what I’ve seen is the week after the non-farm payroll number, usually by around the 18th of the 20th of the month, the dollar starts to get into a bit of trouble here. We run out of buyers, so we’ll watch this very closely. But to begin the week we remain that our T cross long 95.80 is our key support level. If we close below this for two days in a row, then the dollar is likely to shift and start moving back down lower. I don’t know if we’ll go as low as our next verified zone at 94.80, or excuse me, 93.96, but that is possible. We will watch the neural index and the neural index strength to see if we can get it to recover.
But right now our predicted differences are still pointing down. We’re seeing a little bit of short term strength there in our short term predicted difference, but our medium and long term predicted differences are still pointing lower.
S&P 500 Index
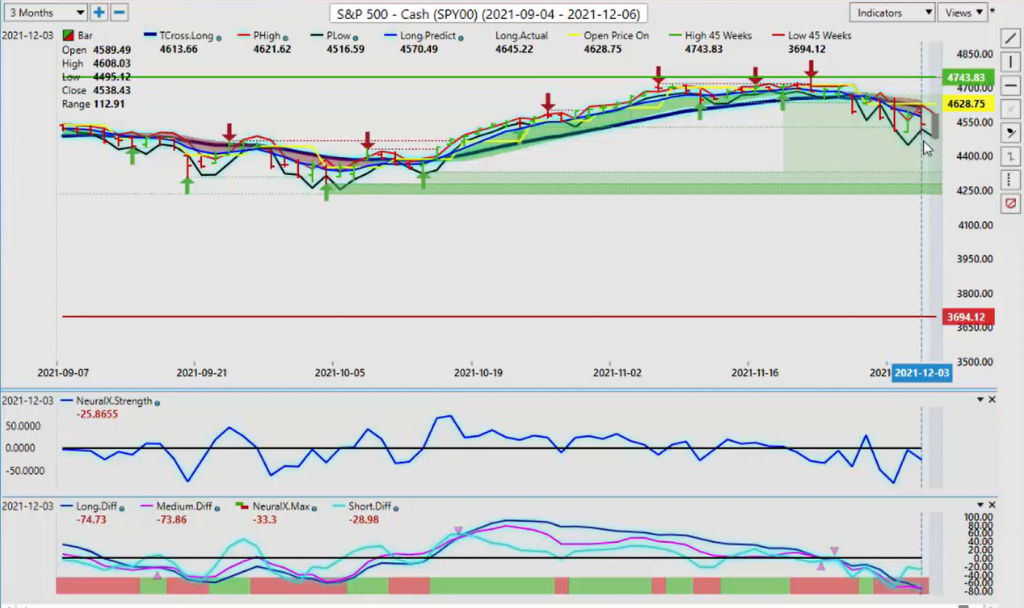
Now with that, this could spell some relief for the S&P 500. My view is that we’ve got a strong, verified support low at 4524. We’re looking to get back up above that. Now on Friday, we’ve come right up to that T cross long to the number at 4613. You can see the high 4608. So we’ve come right up to that level and then sold off. Now, we’ve got a lot of fear going on about this new COVID variant here, guys, but let’s not get overreact to it yet. I think the media is really pushing this narrative. I think we’ve just got to see where we go with this.
The vaccine appears to be doing very well globally, so I’m not going to hit the panic mode here and just start dumping out of equities and Bitcoin and buying dollars, all this and buying gold, all these things because the indicators in VantagePoint are just not supporting that at the current time. So when we look at the S&P 500, once again, our neural index strength is coming up to the zero line and then rejecting it. So it’s warning us that we’re probably not going to start the week off very well, but our medium-term and crossing over our long-term predicted difference is trying to warn us that we’ve got pending strength here. Now I have no control, nor do any of us have any control over this COVID variant and how the governments are going to respond to it.
So that’s a variable, we’re going into thin holiday trade here soon in the month of December, you’ve got governments shutting down for the year. All of these things are happening. So it’s a low liquidity month that usually favors stocks. So I’m not saying that the stocks are going to rally back to 5,000 on the S&P, but I do think that they will recover once everything with the new variant calms down.
Gold
Now, if this variant was as dangerous and everything that they’re telling us, then I would’ve expected gold to make a much bigger push last week than what it did. As you can see, using the point in time, the weekly opening price, gold has been below its weekly opening price the entire week. It has been below its yearly open price at about the 1904 mark the entire calendar year.
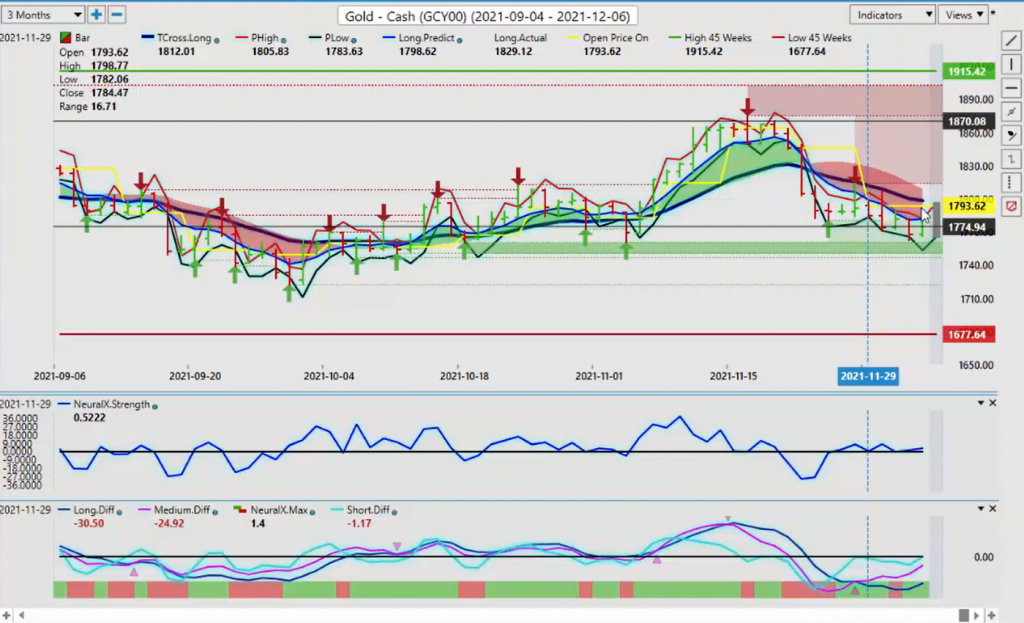
So when we look at these things, our neural index strength is running basically completely sideways. We do have an indicator here that’s warning that there could be some pending strength in gold when we combine that with our verified support low, that’s coming in at 1760. So I suspect because of some of the things that are going on with the COVID variant, that we could see some buyers coming in. But what we really need to see with gold, if you’re a gold bull, is you need to see that seasonality of the dollar selling off in the month of December.
If that happens, that could boost gold prices for if nothing else, a retracement back to the 1781 mark. Or then, if we go a little bit higher, the T cross long that’s coming in at 1789. So that’s our retracement point. If gold is going to go higher, once again, the other strategies that I’ve mentioned in here is straddling that T cross long, selling into 1798 and having a long order ready to go at approximately 1804. Or you could put up a little bit higher at about 1815 above this newly formed verified resistance zones.
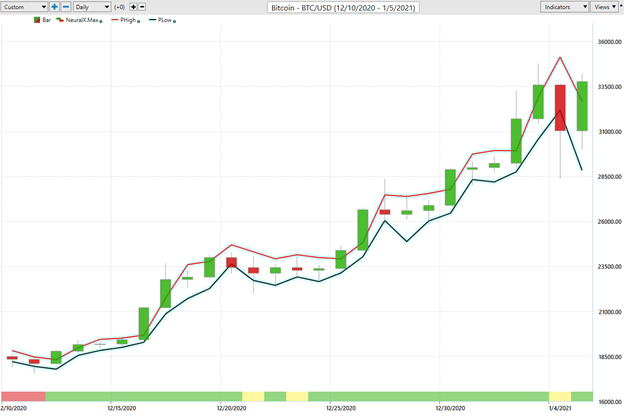
Bitcoin
Now, when we look at Bitcoin, Bitcoin is definitely struggling here this morning. On Saturday morning during this presentation, we’ve pushed all the way down at the current, at this time, I believe Bitcoin is around 40. The live price is around 47,000. So again, we could see, you’ve got a lot of variables going on. Dollar strength, you’ve got the COVID variant. I don’t think we’re going to move all the way down into the low, but it is definitely possible. This verified zone down here is 46,982. So we actually, at the time that this presentation is being done, I believe we are actually very close to that level. So if you’re watching this over the weekend, you could potentially have a long trade forming here right down around this level, around this 40, 46,900 mark. Because again, I don’t think Bitcoin is going to break this overall channel down in the 41,000 area.
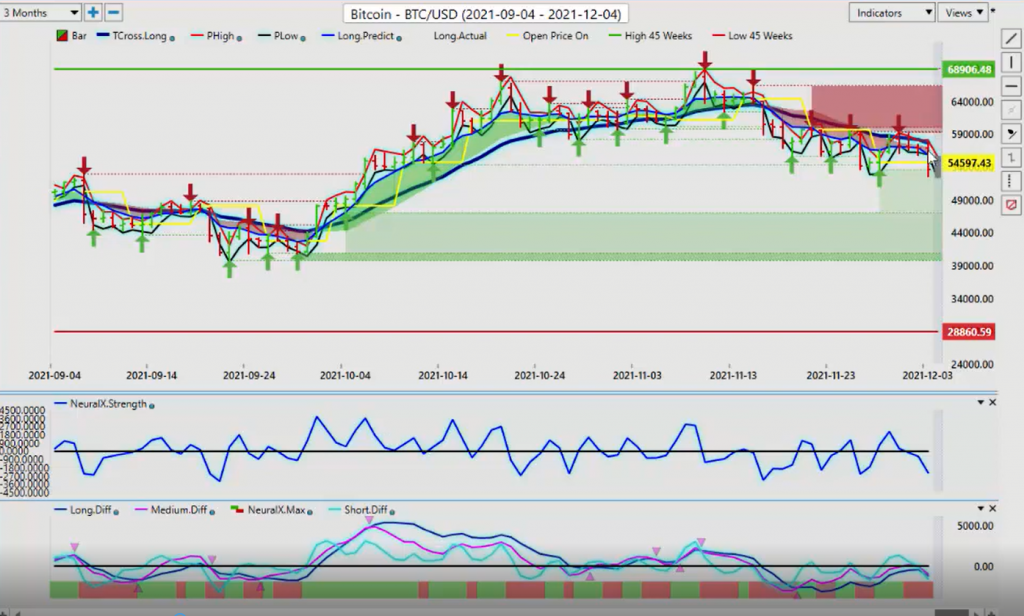
You’re going to have people coming in Monday and Tuesday looking to pick up a discounted price for longs on Bitcoin. Because again, very little has changed. I believe that Bitcoin has had a fantastic year. The last 10 years in a row annualized returns of about 238%. It’s been the number one investment for the last 10 years. So I would watch this level very closely. Our VantagePoint indicators are correct again here this morning, it is aggressively moving lower, but again in thin weekend trade. So we’ll see where we go with Monday, but keep a very close eye on two levels. The 46,982 mark, and this additional support, if we get down that low of 40,820. This is where I believe you will see the buyers coming in.
Crude Oil
Now, oil prices, again, struggling with equities this past week. You can see that oil pushing down, but if we get a recovery and we may have a recovery starting right now off of this low at $62.43.
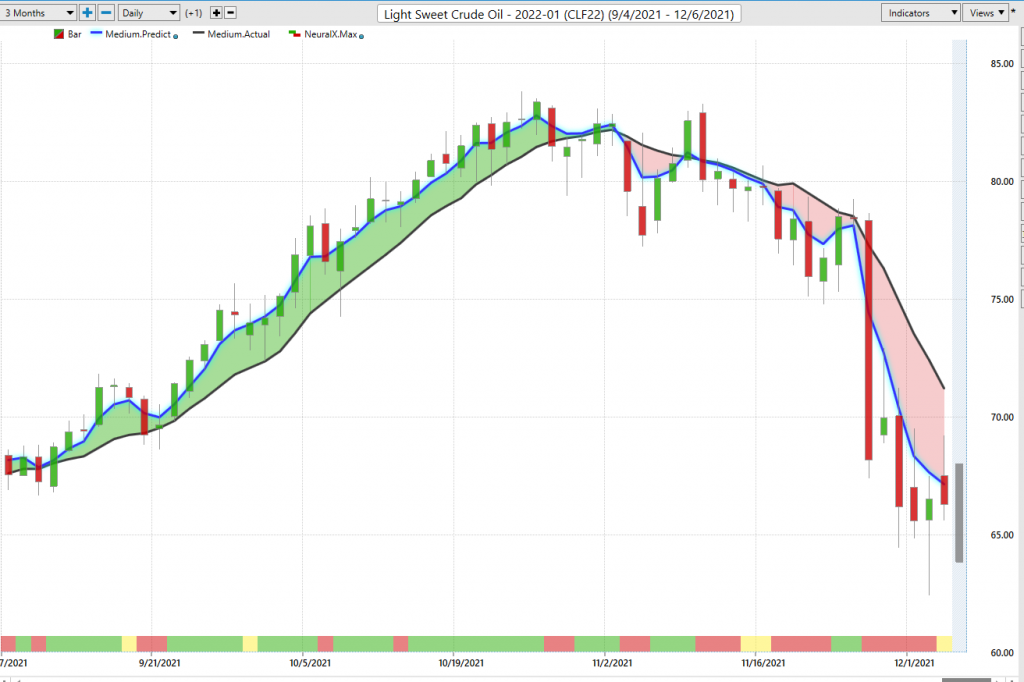
So now we’re going to see to start the week if this can hold. But using your point in time and identifying that weekly opening price, you can see that we’ve come up and tried to overtake this yellow line four or five days in a row, guys. So this is a strong sell here. Our neural index strength indicator and our main neural index both supported this. But you can see now the neural index strength is trying to break above the zero line. If that happens, that will give us the confirmation that we need that at the very minimum, we’re going to retrace back to our T cross lung at 73.36. I believe that that is very, very possible. So we will be watching that level very closely. We just need to clear the long predicted at 68.40 so we can reach 73.36.
Euro versus U.S. Dollar
Now, as we look at some of our main Forex pairs, the Euro, once again has spent the entire week banging into the VantagePoint T cross long.
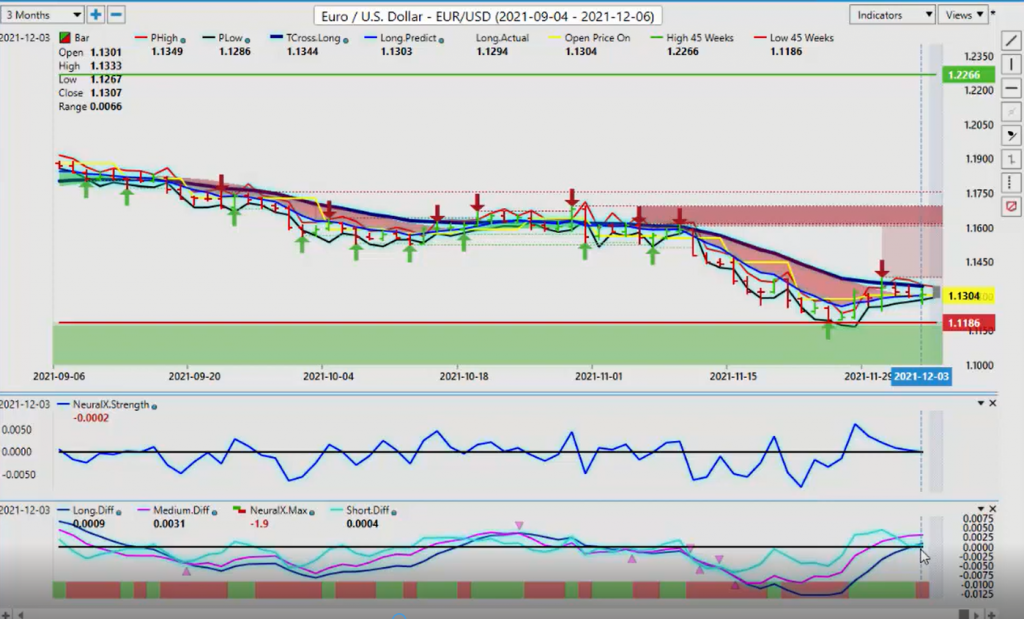
With my own direct client group, I’ve had them short. We’ve been shorting this into this level the entire week, anything above 113. However, now the way I’m looking at this is we’ve got our predicted differences rising above the zero line. I’m certainly not suggesting that the Euro is going to go into a big bull move. But what I am saying is that in the month of December, if gold rises in the dollar index, that seasonality comes to fruition, then the Euro will break above, at the very minimum it will break above the T cross long and that’s coming in at 113.33. The verified zone at 113.82 is very formable resistance, indisputably. So if we can break these two levels, then we could see the Euro starting to slowly retrace towards the end of the year. But my optimism on that right now remains heavily guarded unless we get gold contracts going higher. The Euro has a very, very, very high correlation to gold contracts.
So right now we will watch this level very closely. Again, you can straddle this guys. You can put a short trade going in. We’ve got our predicted high that’s coming in on Monday at 113.40. We’ve got our T cross long that’s coming in at 113.44. So all the resistance is clearly identified. You can sell into that level and have a buy order ready to go about just above the 114 mark. There’s an easy peasy strategy that’s not overly complicated. We have a very conflicted signal here, though. We’ve got our neural index strength pointing down, trying to break the zero line, which it’s not. While at the same time we have the strength of the medium term crossover and the long term crossover moving above the zero line, suggesting that the Euro is potentially building up for a move to challenge these upper resistance points.
U.S. Dollar versus Swiss Franc
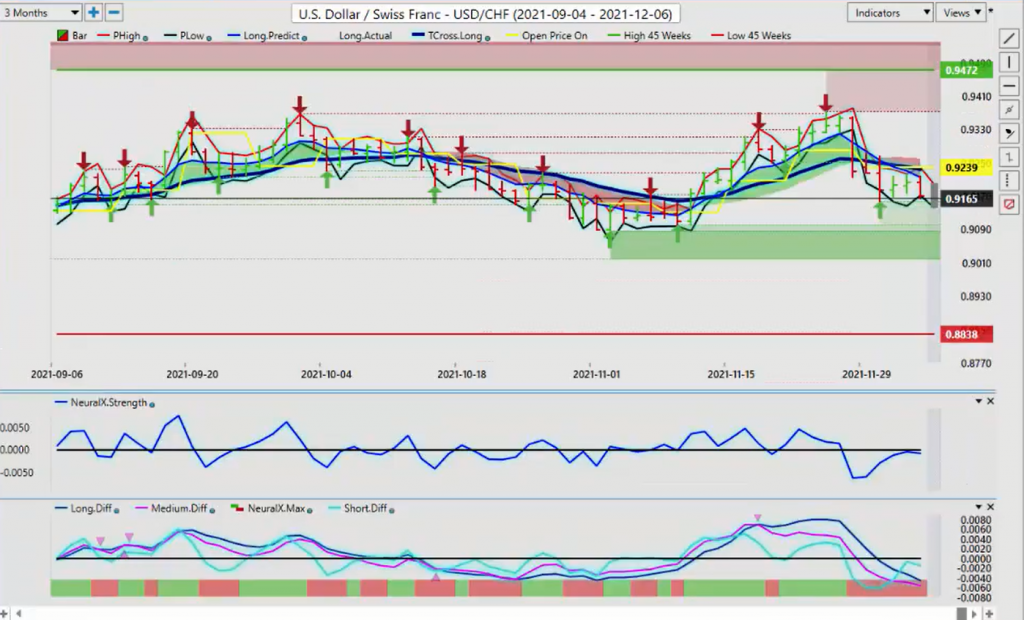
Now, when we look at US Swiss franc, a counterpart, the inverse correlation to the Euro US trade, you can see that we’ve struggled again here using the VantagePoint long predicted, which is the long term crossover with the blue line only, and the T cross long, which is our main line in the sand. We then apply the weekly opening price, and you can see that US Swiss franc has held below the weekly opening price the entire week. And this is largely to do with the fact that equities are struggling. So if equities are struggling, you’re going to have a strong Japanese yen and a strong Swiss franc, that is the inter market correlation you want to watch. So what we’ll be watching for now is to see if the dollar can make its move or not. I believe we will know this by Wednesday of next week, Tuesday, Wednesday, Thursday of next week, whether the dollar is holding these gains or not.
So the levels that we will watch are line in the sand, but remember that is still our T cross long, that level coming in again, right up here when we look at that T cross long, we’re looking at 92.33, we need to overtake that. Now the weekly opening price, that’s going to shift all the way down to 91.65. So the bar is set pretty high here for sell orders. If we can’t hold below 91.65, then you are going to see this pair reverse.
British Pound versus U.S. Dollar
Now, when we look at the pound dollar, firmly below its yearly opening price. And again, a case in point here, using the weekly opening price is a pivot level. Here we can see the point in time with the British pound, US dollar is 133.36. We’ve hit this level every single day last week. And that’s the reason why I bring it into the AI weekly outlook, because it’s sort of a non indicator.
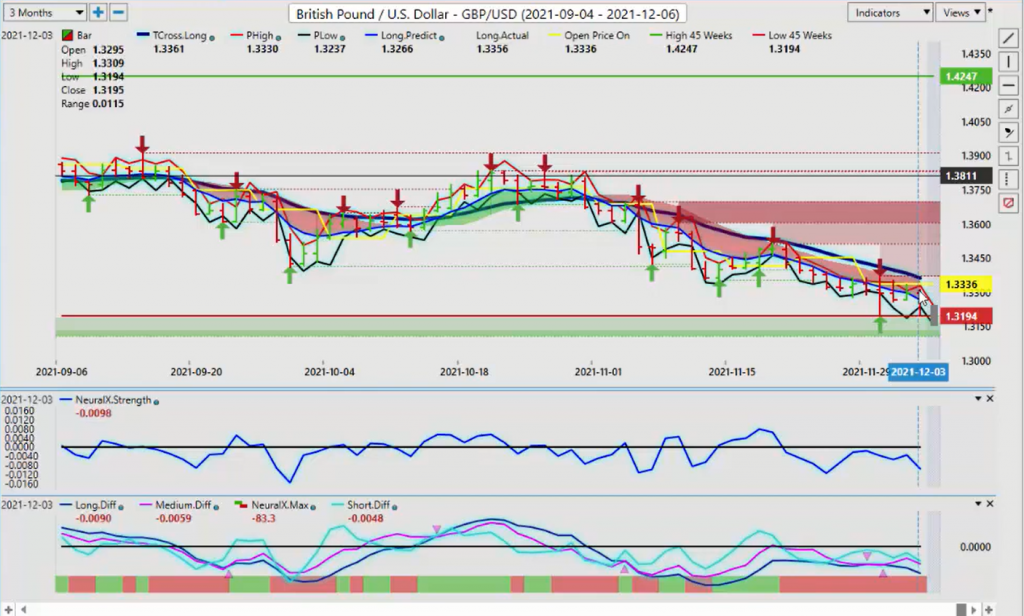
What it does, it simply tells us the same as the yearly opening price, which I’ve taught in classes, that if something is truly bullish on the year, then it should be above its yearly opening price. If it’s bearish, then it’s easy to identify because it’s below its yearly opening price. So with the pound dollar that comes in around 136.40, we’re below the yearly opening price, and we’re below the weekly opening price. So next week we look to do the same thing. So if we look at our bar from Friday, the closing price is 131.95. So if we stay below 131.95, and the VantagePoint indicators support additional sell orders, then that’s what we would do because it’s clearly bearish. But if we’re holding above 131.94, then we could be looking at a retracement back to the T cross long at the very minimum of 133.36.
So right now the indicators are saying they’re very mixed. We have two MA diff crosses side by side, but the most recent one is to the upside, which warns us again of that seasonality in the dollar index.
U.S. Dollar versus Japanese Yen
The Japanese yen, the US Japanese yen pair, very, very similar, almost identical to your US Swiss franc trade. So you can see that we don’t have a lot of buyers or excuse me, we don’t have a lot of sellers down around this verified low at the 112.73 area. We’re going to close the week out very close to that. Closing the week at 112.77, I would watch this level like a hawk and the S&P 500. If the S&P 500 turns around and goes higher, it doesn’t matter what the dollar index does guys, that is what we need to pull the dollar yen back up towards our T cross long at 113.74.
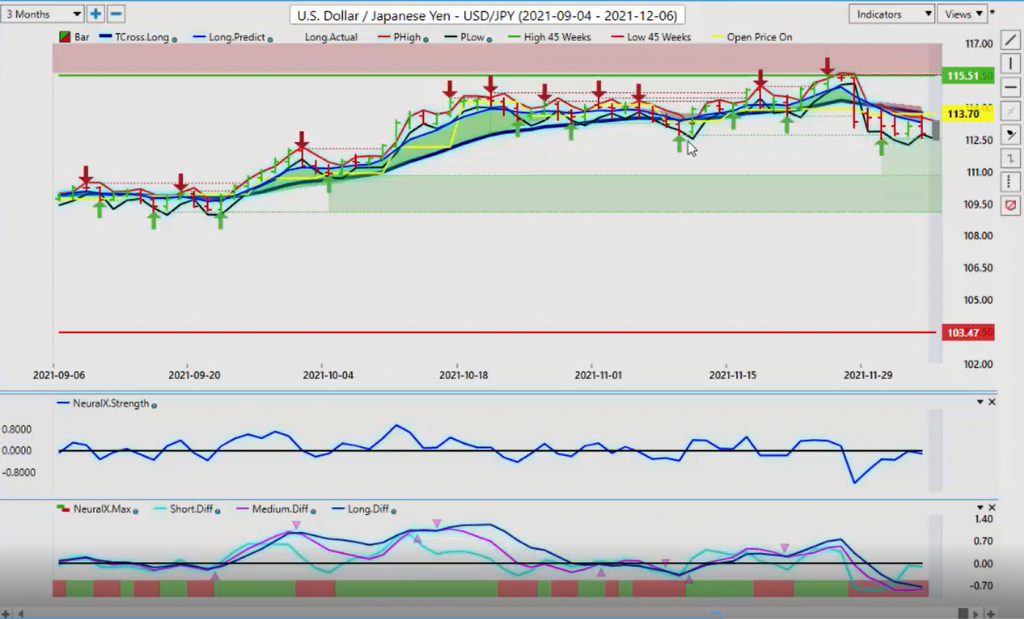
So identifying these points on the downside and the upside allows you to make a very educated decision on which way you want to go. Our neural index strength indicator is pushing against the zero line. If we get it sloping up and pushing above the zero line, and we get our medium term crossing our long term predicted difference, then you’re going to see the dollar yen recover. But we would also be looking for gold prices to continue to move lower for a recovery on this particular pair.
U.S. Dollar versus Canadian Dollar
Now with the US Canadian pair, in most cases here again, we’ve got a number of different indicators on the screen. We’ve got a number of different, you’ve got Canada bulls, Canada bears. The unemployment number out of Canada was pretty solid on Friday here, guys. So what I think is going to happen is it’s going to fuel the optimism of the Bank of Canada to hike before the FOMC does.
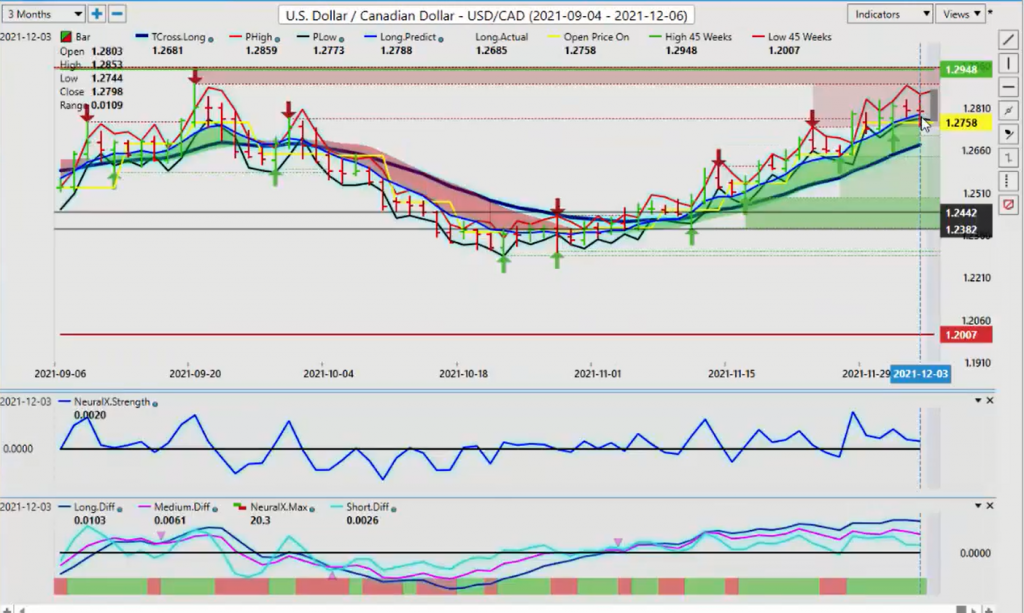
So this is going to, this could put a very bullish spin on the Canadian dollar, meaning a sell for US Canada. The only problem is what I’ve seen over the 20 plus years that I’ve been using the VantagePoint software is that these intermarket correlations trump any of that. And what I mean by that is that if the S&P 500 crashes and oil keeps moving lower, it doesn’t matter what the Bank of Canada says. This will go higher. So you want to keep an eye on oil prices and the S&P 500, if you want to trade this long or short. Because the Canadian dollar, again, has a very, very high correlation to oil and the S&P. So if those are not doing well, neither is the Canadian dollar. I think we’re pushing a little too far off of our T cross long.
That’s coming in at 126.81. My view is that oftentimes people misinterpret this as super bullish. When in actual fact, the further we move away from the T cross long, the more likely it is we’re going to retrace to it. And this is a form of mean revision that is used by many, many different traders and many hedge funds as a top strategy. They don’t use over bought and oversold conditions, they basically look at mean revision points. So this is the way I would recommend you look at your VantagePoint software and say, okay, well, we’re getting a little bit toppy up here. We’ve got the Bank of Canada that’s probably going to hike. We’ve got a seasonality in the dollar that it doesn’t do well in December. And we’ve got a seasonality in equities that they do do well.
So there’s a slight bias for a sell here. But again, we have to be very mindful of what’s going on with that COVID variant, because the last time that all hell broke loose with the COVID virus, the US Canadian pair, I believe hit about the 1.45 area. So you always want to keep that in the back of your mind. We’ve got a positive neural index, but a negative slope on the neural index strength, starting to point down, but still above the zero line. So if you’re using the neural X strength indicator, and it breaks down below the zero line, then that could be the start of a pretty substantial move to the downside. Now, Aussie and New Zealand next week, they’re going to be, again, very similar to the they’re going to be, again, looking for the equities to either tank or recover.
Australian Dollar versus U.S. Dollar
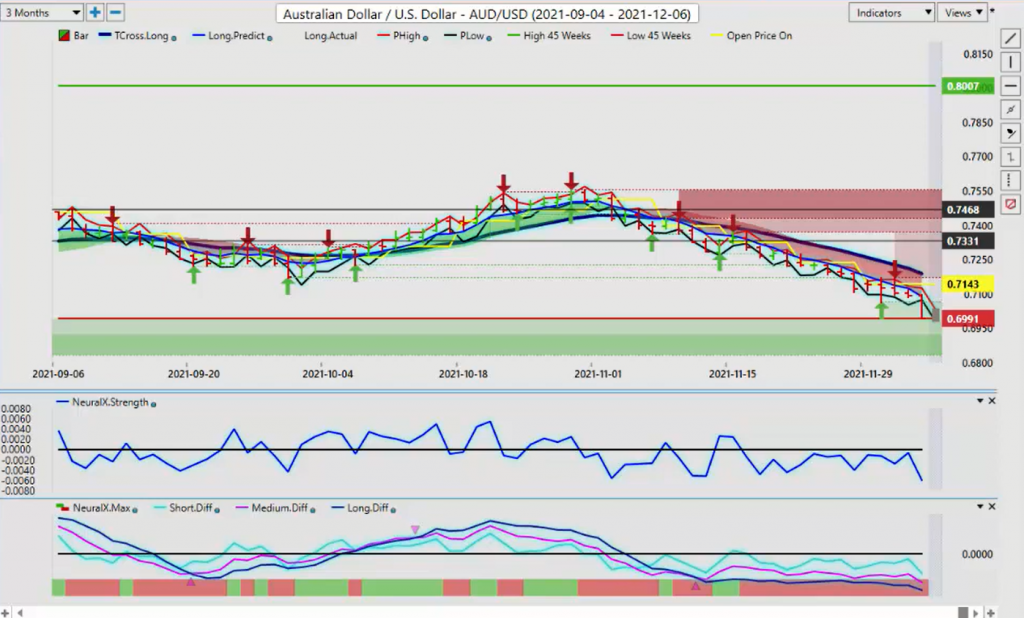
If the S&P 500 recovers, then you’re going to see the Aussie and the New Zealand turnaround. The key points, the upside pivot areas here, long predicted 70.87, T cross long 71.89. Now we’ve had a very bearish close here, 69.93. So if you take your VantagePoint software and you just click on your line chart here and draw a line on the closing price, that will be your weekly opening price. Again, the basic theory here guys is that if we’re above it, we’re long. Below it, we’re short.
Aussie is firmly below its yearly opening price, however, but so is the kiwi.
New Zealand Dollar versus U.S. Dollar
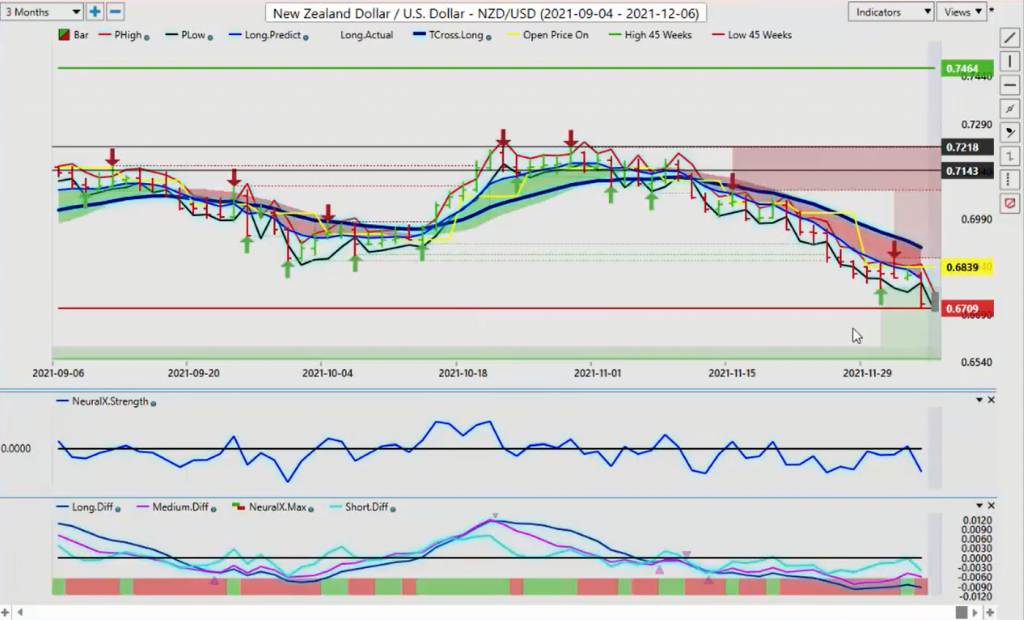
Both of these two pairs are not having a great year. I will still make the argument that it’s the exact same trade, but I think I would make the argument here that if we’re going with counter trend longs based on the anticipation of the stock market recovering, then there might be a little bit better value in the New Zealand as it’s pushed and closed all the way down to the 67.09 level. So with that said, this is the VantagePoint AI Market Outlook for the week of December the sixth, 2021.