Welcome to the Artificial Intelligence Outlook for Forex trading.
VIDEO TRANSCRIPT
U.S. Dollar Index ($DXY)
Hello everyone and welcome back. My name is Greg Firman and this is the VantagePoint AI Market Outlook for the week of December 5th 2022. Now, to get started this week, we’ll begin where we always do, with that very important US dollar index. Now, pretty solid non-farm payroll number coming out on Friday. Looks better, may help the dollar, but the strong seasonal pattern is that the dollar doesn’t do very well in December. In my respectful opinion only, we have a couple of weeks of trading left as we get into after Christmas, there’s very little volume in the markets, and we should really just try to avoid that type of trading. But there will still be likely some good moves between now and about the 20th, maybe the 18th of this month.
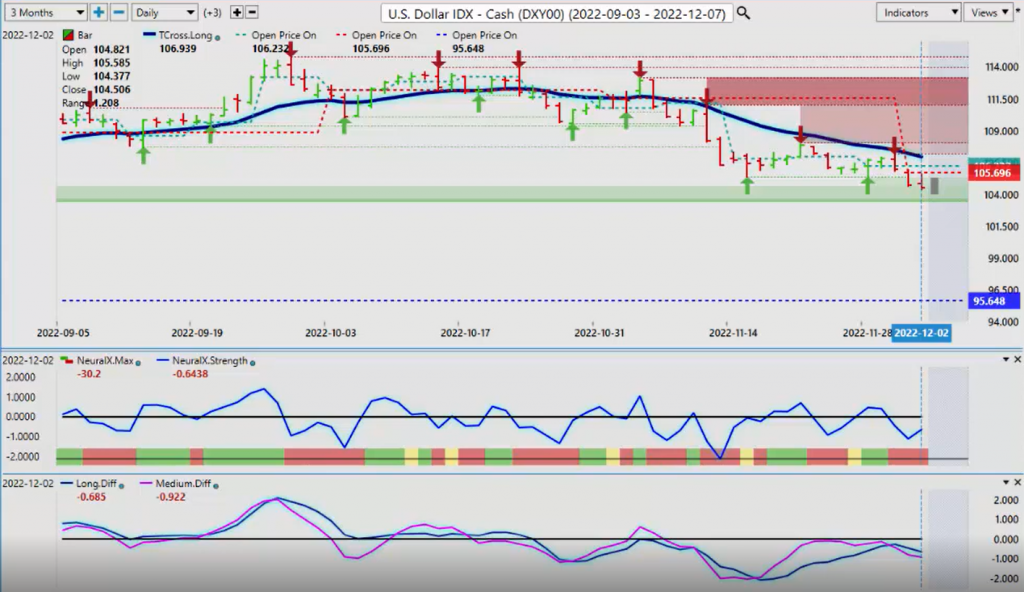
So when we look at the dollar, we’ve closed down below the VantagePoint T cross long, our resistance now 106.93, our monthly opening price, that’s coming in at or about the 106.23 area. So we’ve got a lot of resistance building up around this area. 105.96 is our weekly opening price. So the dollar is struggling pretty good. Did okay during the beginning of the week and then we started breaking down here.
So once again, when we’re looking at this going forward, the current picture of the dollar is still relatively bearish. So we’ll watch our price action here. Our Neural Index is still down. Our MA diff cross has come up to the zero line. So what the MA diff cross is, it shows us that we’ve got a crossover that’s taken place in the medium term and below our VantagePoint long predicted. You can see how, when the market closed down below that level, the next two days in a row, we came right back to the VantagePoint predicted moving average, hit that, and moved lower. So we will also use that level of 105.63 to begin the week. If we’re closing below 105.63, then the seasonal pattern and the dollar remains intact and we’re likely to move lower. But I still suspect we’ll get a bounce here first. But again, we’ve got all of our crossovers are down.
My only concern here is that, again, in my respectful opinion only, the Fed may have slipped a little bit when he was under a bit of pressure during that speech the other day. I don’t think the data from that non-farm payroll number will do anything to deter the Fed from continuing hiking here. If he pivots down to 50 basis points, that’s still a huge positive here. So the real seasonal pattern in the dollar is that it strengthens mid-January to around April or so, give or take a few weeks either side. The dollar is very strong during that period when money’s being repatriated back into the US. But right now, a lot of that money is being moved offshore to avoid the tax man, to say the least.
So once again, the dollar still remains very strong on the year. The yearly opening price 95.64, again, a very, very strong year for the dollar yet again. So giving some of this back into the year-end profit taking is perfectly normal.
S&P 500 Index
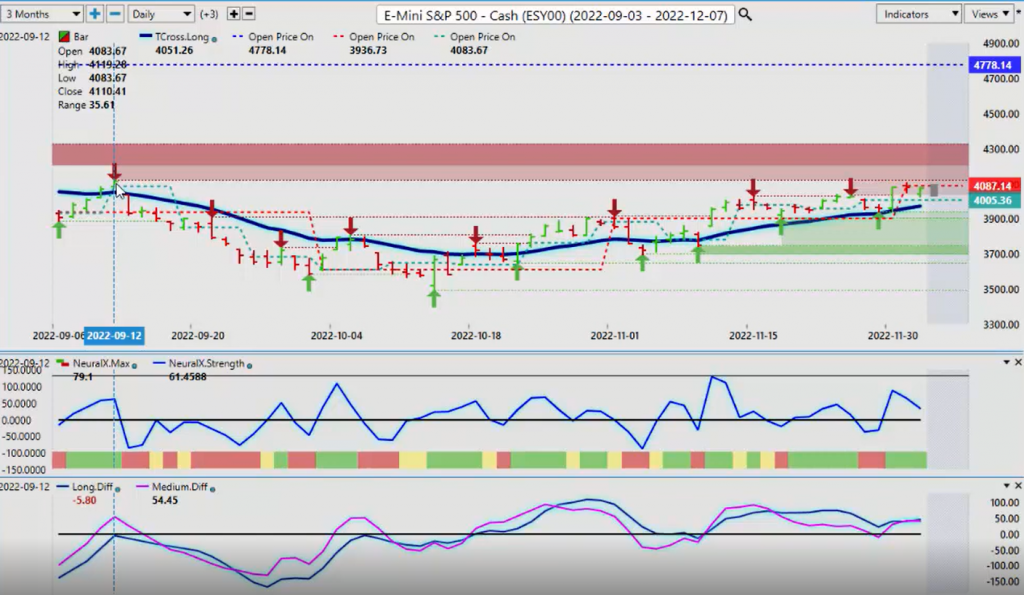
Now, when we do a comparative analysis to this using the S&P 500, the dollar, once again, the S&P 500 is still, to be clear, this is a bear market here, guys. The media can spin this all they want. We were down I think close to almost 30% on the year. Now we’re down I think 15% on the year. In no alternate reality is that a bull market. So right now, the yearly opening price 47.78. If you bought the S&P 500 this year or the global equity markets, you’re still down 15% on the year. So once again, we’re getting into some pretty stiff verified resistance that comes up to the high. This is 41.19. Continues this verified zone going back from September the 12th 2012, continues to cap any rally on the upside.
So this is the level you want to keep your eye on. There’s a lot of chatter that I’ve discussed briefly the other week. The market being above the 200 day moving average. Many, many times have I seen false moves above and below the 200 day moving average. That’s why lagging indicators can be a problem. So just something to keep… Just because it’s above the 200 day moving average, does that mean it’s in a bull market? My answer would be no, it doesn’t because percentage-wise, I’ve seen rallies like this in the past where we’ve been above the 200 a day moving average, but still in a bear market, which is exactly this scenario because, again, we can’t say we’re in a bull market here, guys, if you’re down this amount. You’re still the 47.78, we’re closing out the week here I think 40.71. So again, we’re still down almost 15% on the year.
So until this changes, and again, if we look at the seasonal patterns, stocks historically don’t do the best in January, February, March either during that period of dollar strength. So I think selling into rallies is reasonable. The indicators from VantagePoint, very mixed at the current time. But what we would be looking for the primary downtrend to resume is a breakdown below 3972.
Now, if we click on our F eight in our VP software, then we use our long predicted. That area’s coming in at 4043. That’s the area I would keep your eye on this coming week. If we break down below 4043, then we’re likely going to target that lower level. But if we break down below the T cross long, then again, it’s not a new downtrend here, guys. The primary downtrend just simply resumes, but the Santa Claus rally, the media continues to pump air into this bear market rally. But just as long as you understand it at the current time it is a bear market still. At least by the numbers it is.
So again, when we look at the charts, we look at the open of the year where we currently are, where we’ve been, we have never been above 4778 the entire calendar year. That is a fact. That’s not fiction. I don’t know why the media doesn’t say this and saying, okay, well, this is actually one of the few years, I can’t remember, I’d have to go back 15, 10, 15 years, where at no point during the calendar year did the S&P 500 hold above 47 for the yearly opening price. And this is one of those years we were only above the yearly opening price for a matter of hours here, guys, and that was back in January of 2022. So always remember, get as many facts on the table as you can and weed out as much fiction as we possibly can. and there certainly is no shortage of fiction with the media these days.
Gold
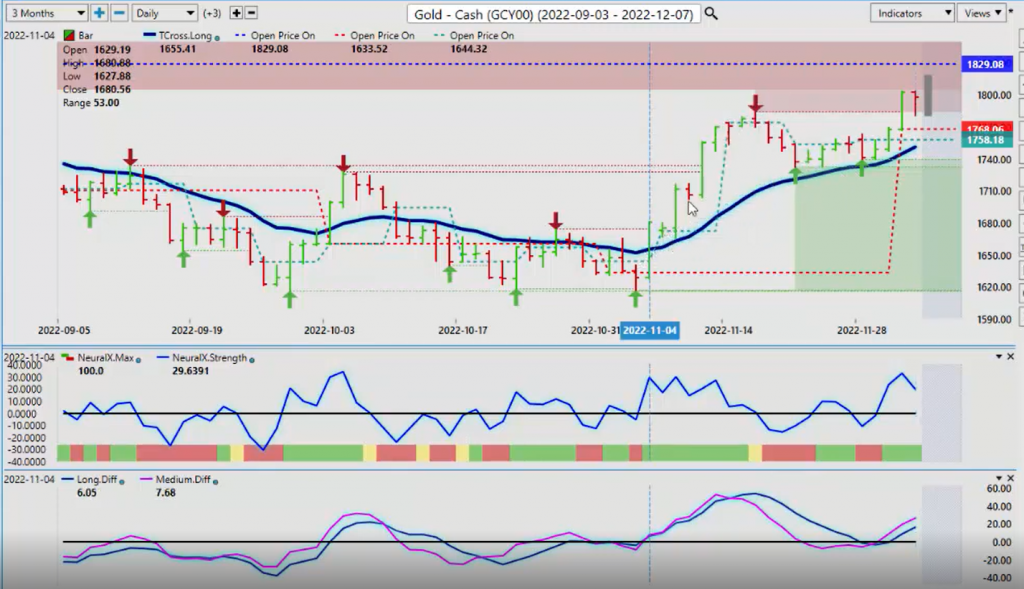
Now, when we look at the additional markets of gold, gold had that pop on that Fed comment, but as you can see there was absolutely zero follow through. Now, gold predominantly does do pretty decent anyway in the month of December. So when we look at the VP indicators, we can see that, again, this move actually started back here in the early part of November. We had a fairly significant rally up here, then we fell back down to the VantagePoint T cross long and then we’re moving back up. But now the market is going to have to digest what the Fed really meant in its comments. And is this payroll number, strong payroll number, is that good for gold? No, it is not. And at this particular time, I don’t think it’s overly beneficial to the equity markets either.
But for now, 1829 is likely to cap the upside. That’s the yearly opening price. Gold still negative on the year also. Our T cross long, that level now comes in at 1751. The further we move away from that level, the more likely it is we’re going to retrace to it. Always remember that. This has nothing to do with waves or Fibonacci. It has absolutely nothing to do with that. It’s simply the potential is you’re going to run out of buyers. So replacements are natural in trading because you have profit taking. That’s a better explanation in my view than Fibonacci, is that once these bigger players decide to take their profits from the year, you will see gold likely move lower. In either way, it’s likely to move lower in January, in February. So we’re always forward thinking here, right? So again, watch the level 1829. If you are a gold bear, that’s the area I would target for shorts at the current time.
Crude Oil
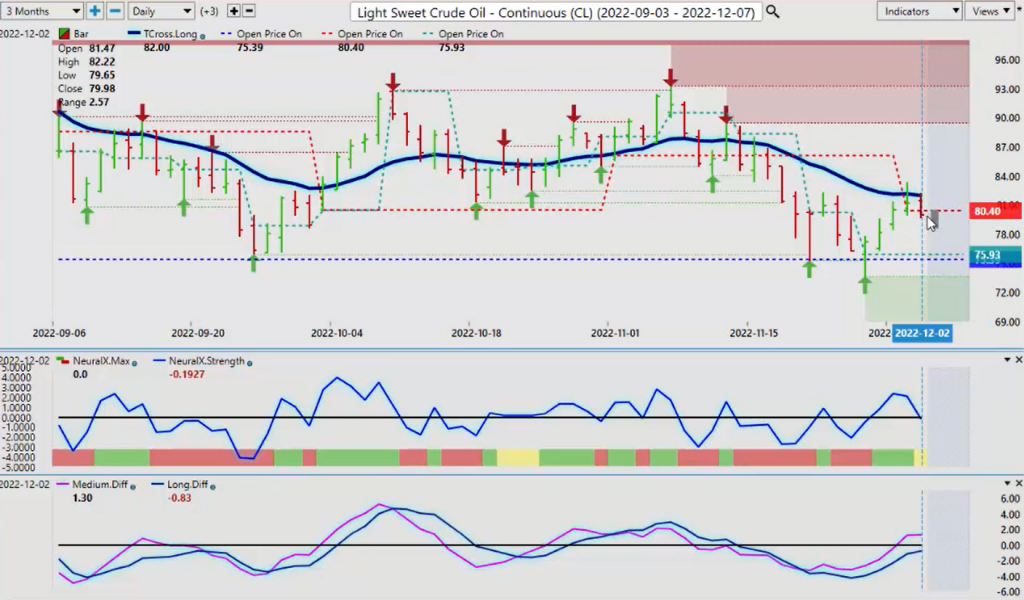
Oil for next week, a lot of people talk about the seasonality, but you can see that that seasonality is absolutely being rejected at the current time. But that could change going in the later we get into December. But right now, the oil prices came right up to the VantagePoint T cross long. My view is the only reason oil came up here is because of those Fed comments. And I think Powell, again, was saying things under his breath. I think he was under a little bit of pressure, maybe a little bit flustered, and he spit something out that I’m not sure he meant to. But either way, on Friday, you can see that from the open right on the VantagePoint T cross long down we went. We’ve got a caution signal here on the Neural Index now, the pink line crossing the zero line. That does represent a crossover. So if we click on F7, you can see that a crossover has taken place.
Now, in order for this to go further, we must clear the VantagePoint T cross long and break free and clear of that. That area that high is around 8222. I believe that will be a tall order. Never say never, but it’s just going to be difficult unless stocks go up with it. If there’s more recession talk, all these things will not be beneficial. But either way, if we get a good rally in oil in the month of December than in my respectful opinion, again, only that’s a good selling opportunity for me for January, February until we get into the next pattern going into March, April, May, that kind of thing. But for now, we are above the yearly opening price on oil. We’re above the monthly, but we’re struggling to stay above the weekly opening price.
So we’re closing out 7989. Once again, a bit of a tall order for oil next week. A lot of people are banking on a seasonal pattern, but this year, guys, is an extraordinary year. It’s not the same as the last 10 years. There’s nothing similar about this year to previous years. We’re in massive rate hike cycles. You’ve got a lot of things going on here. The Russia, Ukraine war, this is a very different year. So always keep that in mind.
Bitcoin
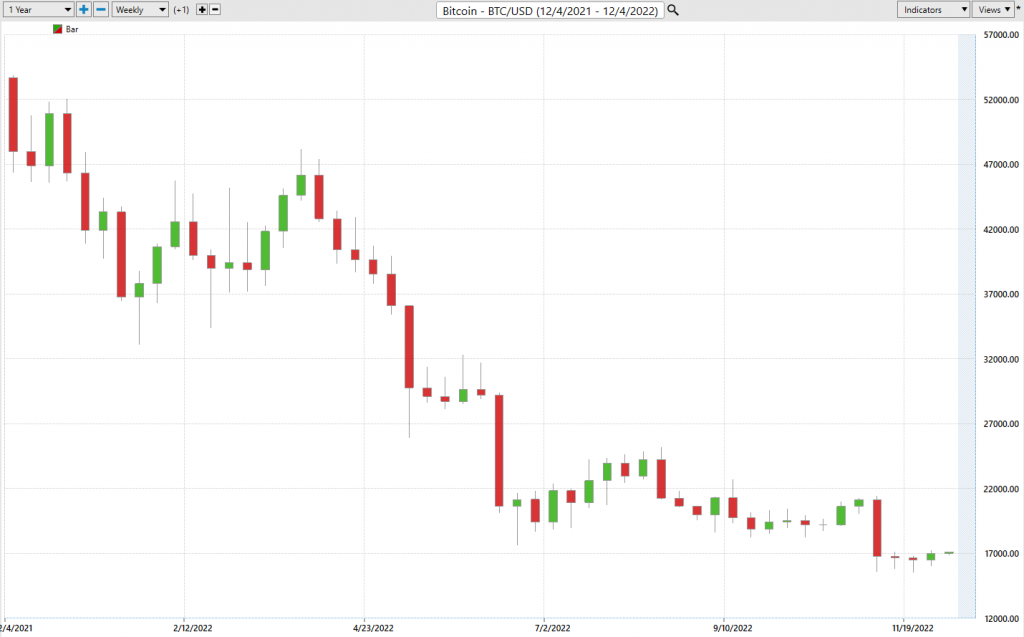
Now, Bitcoin, once again running along here. We’re closing out 17,000. I’m quite sure that Buffett and his cronies are pretty disappointed by this. They’re probably still scratching their head wondering why this is not at 12,000. The reason is, in my respectful opinion again, is that there is real demand for Bitcoin. FTX does not dictate the broader Bitcoin market. Bitcoin is officially now classed as a commodity by the CFTC. Maybe Bitcoin goes lower, but I believe ultimately Bitcoin will survive.
What’s going on right now? Once again, the media trying to say, “I told you so. Bitcoin was a scam.” Just remember, where Bitcoin sits right now, even from 2016, Bitcoin is still up almost, I would say, close to 55700%. So if we do a comparative analysis, for example, say with Zoom stock, okay? I had this discussion the other day. Zoom stock, it’s up about 100%, but it too has dropped almost the same amount as what Bitcoin has in this year. But Bitcoin, again, is up light years ahead of a stock like Zoom. So why they call Bitcoin is a scam is beyond me. But I would certainly take Bitcoin over a central bank digital currency. That much I can tell you. I don’t like the idea of a central bank digital currency one bit. So my view is we will have another buying opportunity, but it’s right now Bitcoin follows the global stock market. Basically it’s 95% correlated to the S&P. So the S&P tanks, that will likely take Bitcoin down until such time is this direct intermarket correlation breaks.
Euro versus U.S. Dollar
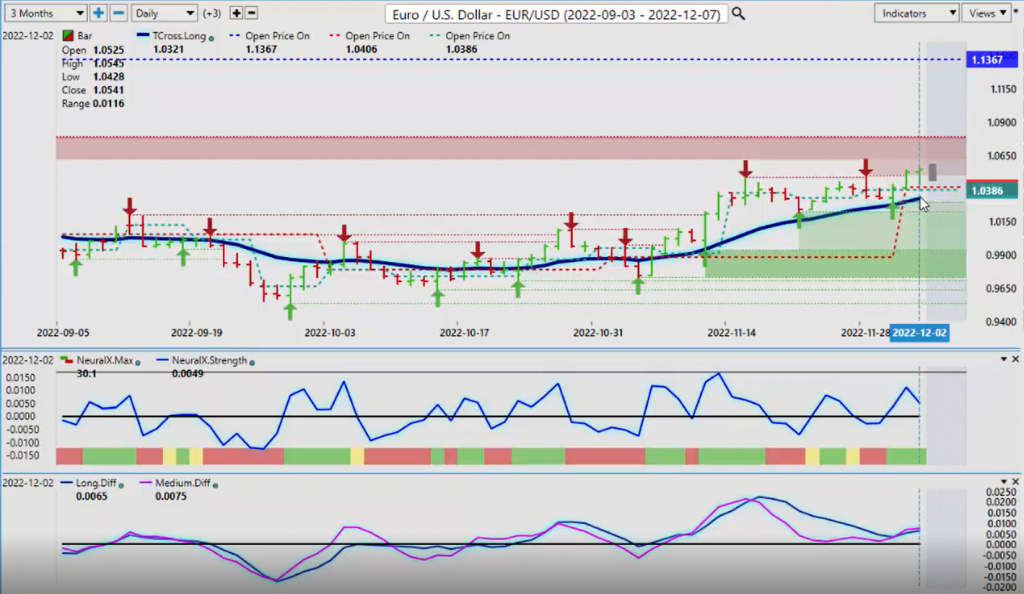
Now, when we look at some of our main currency payers here, starting with the Euro, once again, we’ve got some buyers coming in here, pretty impressive here that the Euro is holding considering the technicals and the fundamentals really have not changed. They haven’t changed much at all. So the Euro, again, is likely just benefiting not from a stronger economy in Europe, low inflation. Things are improving. They’re actually going to have heat this winter, which they probably won’t. None of these things have improved. So the euro is going up as long as the dollar is going down. That’s the easiest way for me to say that. We’re either buying or selling US dollars. So if the market continues to sell the US dollars, the Euro will benefit from that, even though the fundamental picture is still quite ugly in the Euro zone. Quite ugly actually.
So when we look at this, we use our T cross long, once again, 10321, but never lose sight of the fact here, guys, the easiest way for you to determine whether something is in a bull market or a bear market is simply looking at where it is in relationship to its yearly opening. The Euro is 11367. This is in a massive downtrend, right? So soon, I believe, towards the end of the month, maybe sooner, maybe during the Fed announcement that you’ve got a CPI number coming up and you’ve got the Fed meeting, I believe on the 13th or the 15th. So there’s still plenty of volatility left in the month of December. And the question is, can the dollar buck the cycle, the seasonal cycle, and extend higher in the month of December? I would say there’s at least a 60% probability that could happen, right?
So right now, we’re above the VantagePoint T cross long, but this is the one you want to watch, the long predicted 10440. This is the one that where basically if we break down below here, and if we look where we’ve closed the week at 10541, that sets the bar rather high for next week, doesn’t it? We need to stay above 10541 because that’s going to be your weekly opening price. So your open interest for the week, if there really are Euro buyers up here, then we should be holding above that weekly opening price, right? So again, watch that level very closely. The Neural Index strength, it’s pointing down. You can see that the markets had a big move up into the end of the day, but the Neural Index is still calculating that that’s not a strong move on Friday for the Euro actually. The MA diff cross, we have two crossovers on the long term crossover and the medium term crossover and obviously the short, but that’s warning that this is not strong here. It’s not strong at all. So watch the key levels.
U.S. Dollar versus Swiss Franc
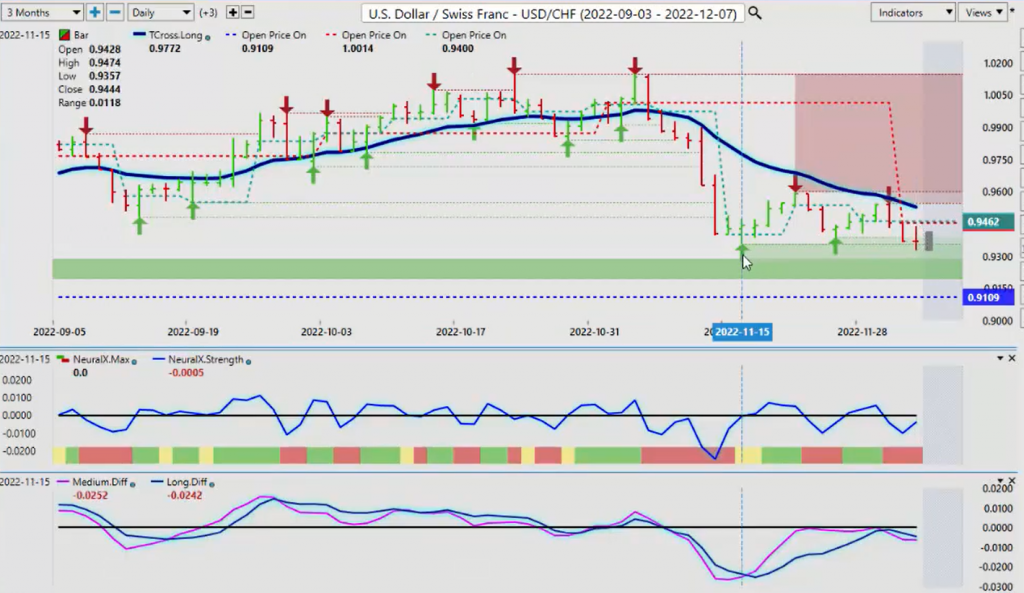
Now, when we look at the US Swiss Franc, once again, if the dollar turns, then this pair will turn also. We have a strong verified support, low 9357, keep an eye on that. The yearly opening price, 9109. The indicators here, you can see a reverse check mark on the US Swiss Franc, but the concern here is that MA diff cross because, what’s this? What the pink line failing to get above the zero line, again, if we click on the F7 in our software, we can see that a crossover tried to take place over here, didn’t really happen. Tried to take place there, didn’t really happen. And then we’re we’re now the predicted moving average is extending lower. But remember, this is still bullish on the year. We’re still above the yearly opening price, unless we can break down below that. So potential longs are the opportunity to get your longs in place for next month.
That’s what I would keep an eye out for because, again, the dollar, yeah, I totally agree there’s a seasonality on the dollar weakness in the month of December, but there’s also a very strong powerful pattern between mid-January and mid-April. So that’s the one I would focus on, guys, here. But for now, once again, keep an eye on these key indicators. They are still negative, but there could be a buying opportunity going into that Fed announcement.
British Pound versus U.S. Dollar
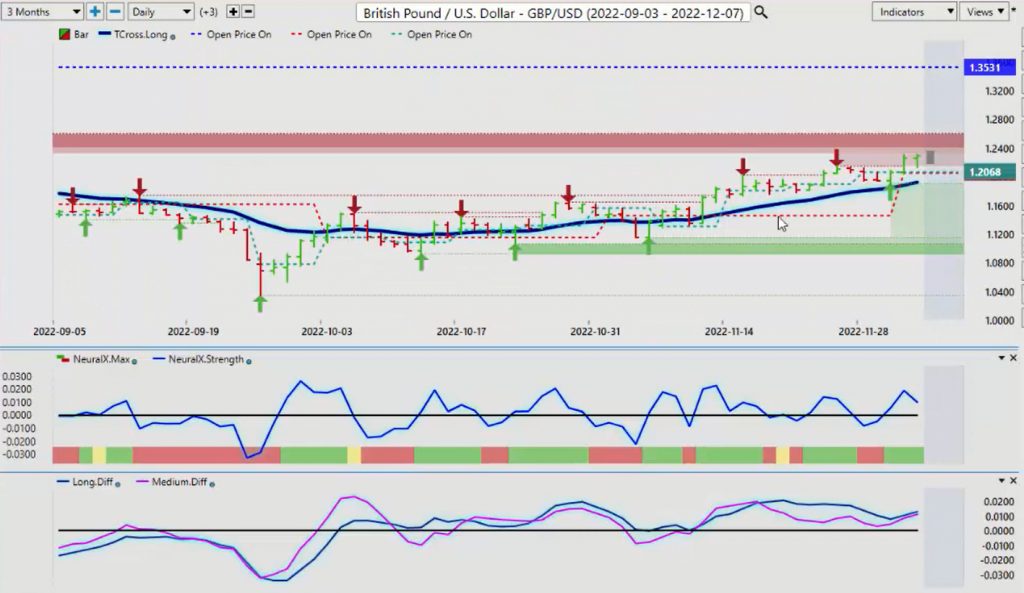
Now, the pound dollar again for going into next week, congested resistance up here. But once again, we don’t want to lose sight where we are in the calendar year when all these pundits are saying, “The dollar’s done, the dollars this, the dollar’s that, stock markets to the moon.” Ah, the charts don’t really support that theory to be honest. So the yearly opening price here, 13531, this is still quite bearish, but the pound is recovered, at least to some degree. But our T cross long here for next week 11920. If this is really bullish and the dollar is going lower, then we need to stay above 11920. Once again, if we click on our F8 in our software and get rid of the black line and just use the predicted moving average, we can see that we have daily entry points off of this blue line. I like that idea, guys, and if I can match it to the VantagePoint predicted low, then all the better.
But once again, we see this ominous Neural Index strength that is actually pointing down in a bullish move. So the Neural Index strength, while the Neural Index is green, the Neural Index strength is definitely picking up on something else. So be careful of that and always watch and be careful of the Monday Tuesday reversal.
U.S. Dollar versus Japanese Yen
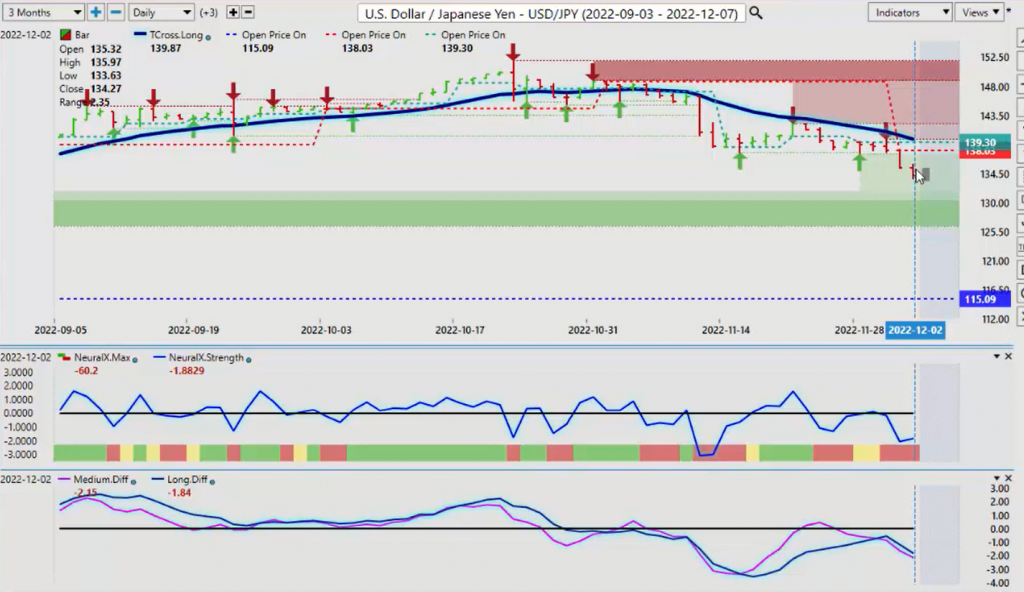
Now, the dollar yen giving back a lot of its gains, which would be perfectly normal here. The rally in dollar yen this year, I don’t know what to say here, guys, 151, oh boy. But the one thing I will say is that the Fed’s path is not going to change to any real extent. This pair by definition is the carry trade. Don’t lose sight of that. So they’re going to be looking to get long this pair again, because if they’re long the dollar and short the yen, then the interest rate differential heavily favors the US dollar.
That is, again, by definition the carry trade, meaning you’re getting paid interest every day to hold this trade, right? The long side of this trade. But if you’re on the short side of this trade, that’s not necessarily financially where these big boys want to be, right? They want to be on the long side. The short side, they have to pay swap and the big guys don’t like paying money to anyone, let alone the little guys like you and me, right? So I would be very cautious with shorts here, and I don’t think shorts is something I would want to hold for any length of time because, again, it’s going to cost me money every day times three on… Remember, Wednesday is triple swap payment day, so I would have to pay a lot of money to hold this. Even for a one month of holding a dollar yen short, that would be expensive at the current interest rates between Japan and the Federal Reserve. So keep that in mind.
But right now, again, our T cross long, 13987. If I click on my F8, once you get a break of this level, 13718, we could see this turnaround. Now, the predictive indicators, the Neural Index strength, is red, but you can see that the Neural Index strength has got that reverse check mark and it’s starting to point back up. But the predicted differences are still saying, “We’ve got more downside.” That would be normal in a normal month of December, that would be incredibly accurate. But this December, I am not at all convinced that things will follow a normal course because nothing has followed a normal course this entire calendar year. So why would December be the same, right? So be very, very cautious with this pair.
U.S. Dollar versus Canadian Dollar
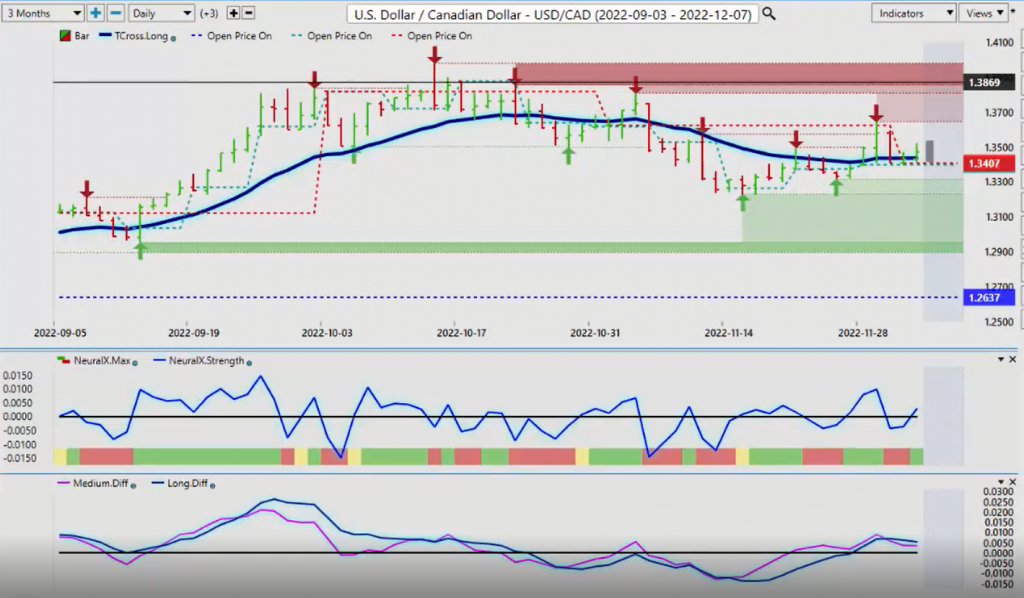
Now, with the next three currencies, in my respectful opinion, they’re all the same, guys. The US, Canada goes down, Aussie US, New Zealand US goes up. They were commodity currencies. I would now classify them officially as equity based currencies. So the US CAD, you can see that it’s really struggled here to get down below here. The yearly opening price, 12637. The Canadian dollar usually does quite well against the US dollar in the month of December, but is this a normal or is this an extraordinary December month? I believe it is, especially with that CPI number coming, and then the Fed the next day or two days later. There’s going to be a lot of volatility coming. Not this week, but I believe it’s next week. But either way, right now, not a lot of sellers, not yet anyway. So what we will do is continue to monitor this, but if we lose 13437, then US Canada is likely going to take a significant drop, probably down towards 133, but it has to pass through the VantagePoint T cross long.
Again, you can see I’m highlighting it over here, 13437. That’s the area you want to keep your eye on. Some, if you’re a savvy trader, could have limit orders set up below there, say around 134, sell limit orders at around 13410 or 13390 when it breaks down, closes below the VantagePoint T cross long, but you’ve got a lot of support down here, 13398, 13407. So if we lose these levels, then we could see a very quick snap lower.
Australian Dollar versus U.S. Dollar
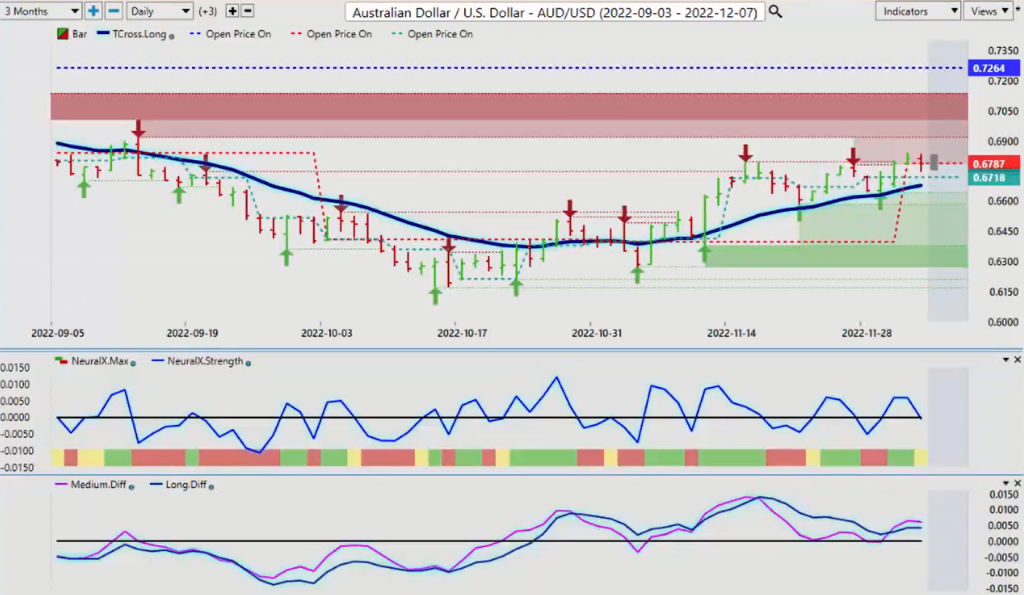
It would take the stock market going higher. And remember, the Aussie is the same trade, it’s just inverse. The dollar is not, the quote is not the base currency, it’s now the quote currency. The Aussie is the base currency. US CAD goes down, Aussie US goes higher, new Zealand US goes higher. So when we look at this, once again, the Aussie is still bearish on the year it has recovered and it’s fought its way back towards 7264. But the only way it could continue this upward momentum is if the stock market goes higher.
New Zealand Dollar versus U.S. Dollar
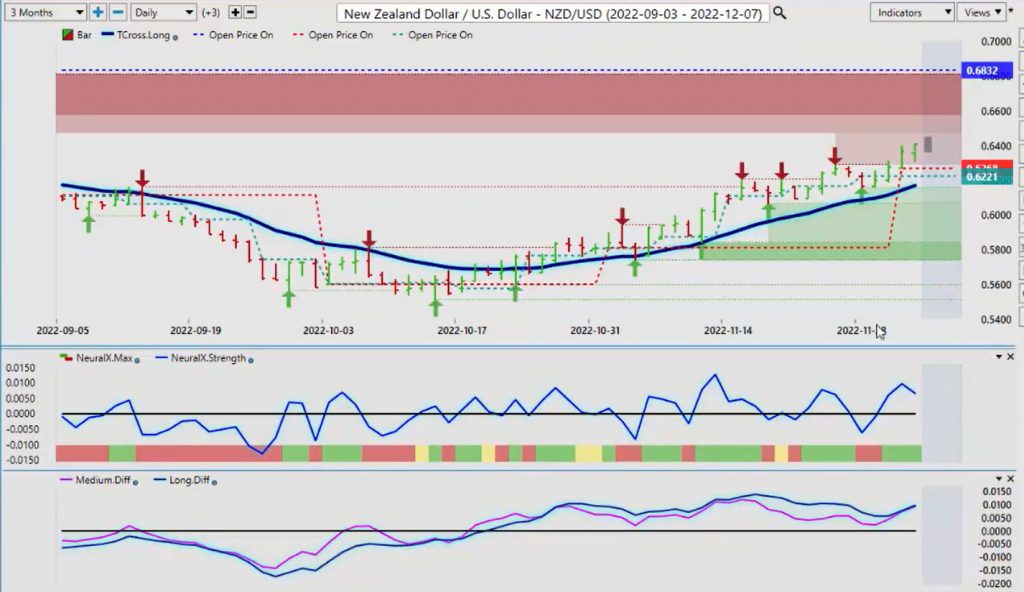
The same thing would apply to New Zealand here, guys, it’s virtually the same trade. The month of November is always a strong seasonal pattern, and this year was no different with the New Zealand currency. It was much stronger than the Aussie, but it kind of balances itself out in the month of December. But again, the T cross long 6170, we want to keep a very close eye on that. So once again, another volatile week is likely in the cards after the payroll number as the market starts to reposition itself and question what the media continues to spin with regard to the Fed.
So what that said, this is the VantagePoint AI Market Outlook for the week of December the 5th 2022.