Welcome to the Artificial Intelligence Outlook for Forex trading.
VIDEO TRANSCRIPT
Hello everyone and welcome back. My name is Greg Firman, and this is the VantagePoint AI Market Outlook for the week of August the 15th, 2022.
U.S. Dollar Index ($DXY)
Now, to begin this week we again start with the US dollar index. Extremely important in everything we’re trading, whether it be in stocks, in commodities. Even Bitcoin plays a part in the dollar index correlations or inverse correlations.
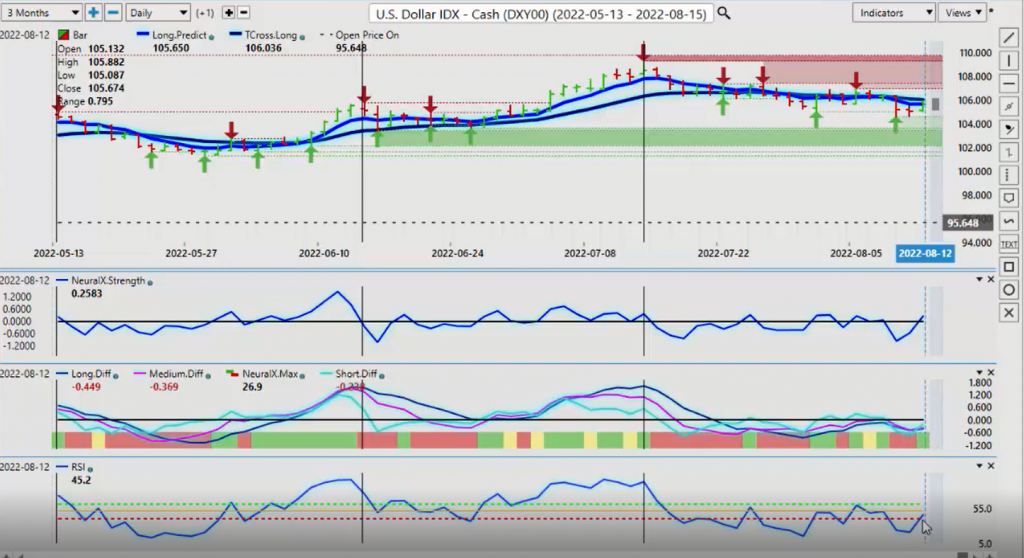
Now what I’ve discussed over the last several months are the cycles that take place around the beginning to the middle part of the month. Now the US CPI number came in softer knocking the dollar down. But once again, when we’re talking about trading the news, you can see that even though it was a softer CPI number the dollar did not extend any of those losses past Wednesday. And by Thursday it was already starting to recover. And on Friday we’re back up to T cross long at 10603. This is the area that we want to watch this week. Very, very closely.
The other thing that I’ve talked about extensively was this breakout point from 105.78. So the dollar index is recovering and it’s closing out 105.67 And again, if a new range is going to form, then we would hold below this particular level of 106.03 and we would extend lower from here.
Now my optimism on that remains heavily guarded because even though you have a softer CPI number I don’t think it will change the fed’s immediate direction on rate hike. So once the market digests the CPI number, thinks about it, we’ll probably come back to some type of dollar long here and we would see some strength. So we’ll watch for that next week.
Right now we’ve got our neural index strength moving higher. The predicted differences have crossed to the upside and we’ve got a rising RSI. So what we’re looking for here is for this area to basically break. And I’ll talk more about this in a minute, how it played into the Euro/ US bear, but the Euro/US again in my respectful opinion only is also a lead indicator here that the Euro fell back within below the 103.20, that break out point, and closed the week softer. That could be Friday profit taking, but again, I think it’s more or less pointing that there’s still going to be some type of dollar strength, but we would like to see the index break and close above 106.03.
Gold
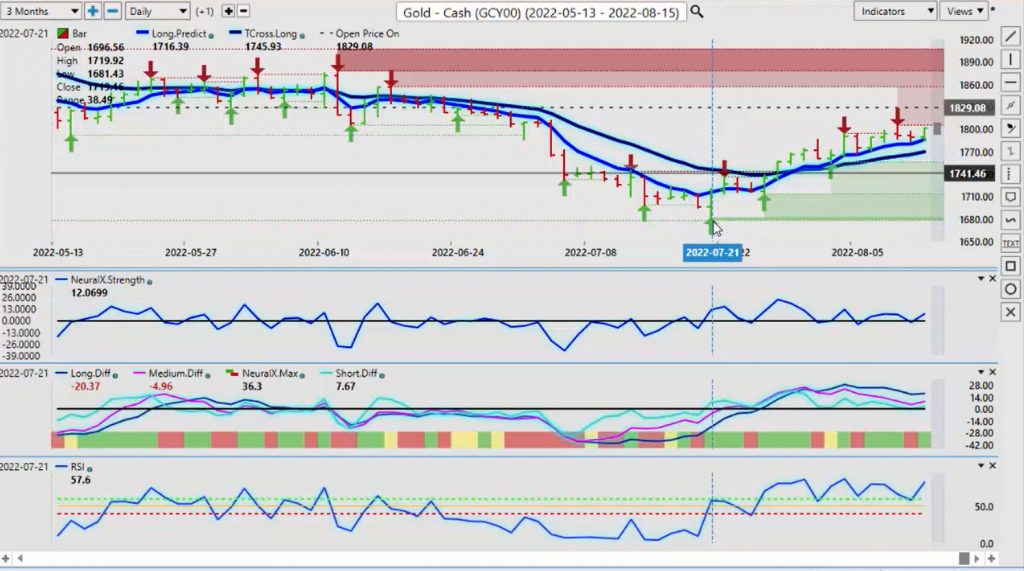
Now, when we look at gold, gold remains quite firm here. That seasonality a little bit delayed this year, but still came in. When we look back into July, that’s usually when I would look for goal to see some type of strength after a long period of dollar strength from mid-January to mid-May. Then in June’s a kind of a soft month. But right now Gold’s still looking pretty good, but I would like to see gold move above the price on open, which is 1829. The yearly opening price is a very important number to me. We are still below that level. Would definitely like to see it get above that.
Now the point in time indicator is indicator because the point in time, you can see that I’ve got it set to the yearly opening price. There’s multiple other things we can use there, the quarterly opening price, the monthly, and even the very, very important weekly opening prices.
The market often struggles with that level. But for this presentation, the yearly opening price, gold is still fundamentally or not fundamentally, excuse me, but technically bearish under this level where we’re tracing higher. But I believe that gold does have a shot at getting above that level because everything is still pointing to a recession, whether the fed wants to agree with this or not. You’ve got an inverted yield core, yield curve, excuse me, twice in the last couple of months, two consecutive GDP with no growth.
So you’ve either got stagflation or you’ve got a recession. It’s either/or or maybe a bit of both. So in that particular scenario, gold rises guys, 75%, 80% of the time. Whether it be stagflation or recession gold goes higher.
So right now our key support level 17.69 and 17.86. This is where all of our support lies. I believe we could pull back a little bit further than that by midweek or somewhere around that critical T cross long. But right now our long predicted 17.86, you can see every single day the market is bouncing off that. And that’s usually indicative of a reasonable up trend. So as long as we’re holding above this level, but more specifically the T cross long at 1.69, that’s the one we want to really keep our eye on.
Bitcoin
Now, Bitcoin again, and a lot of your Bitcoin stocks high eight. Mining is another one I look at and then Bitcoin contracts directly. In most cases, the seasonal pattern is that Bitcoin starts moving higher in July and it’s even stronger. My favorite time to buy Bitcoin is between mid-September and about mid to late October, roughly approximately.
But if we look back from a year ago, you can see that there’s where Bitcoin normally rises right up until about September the seventh takes a little bit of a dip, but then there’s usually one of the bigger moves of the year that lasts again right up until I would argue around I don’t think I would hold it into mid-November, but the latter part of October, you’re starting to peak. Last year, we peaked around November the 10th, but that’s either way Bitcoin, despite them telling us that it’s a scam and it’s all these things. It’s just there’s a 98% correlation between Bitcoin, the NASDAQ, the S&P 500.
So if the stock market is healthy, then chances are Bitcoin is going up also. But the annualized returns on Bitcoin over the last 10 years, about 230% annualized returns. The next closest asset class that has that kind of performance is the NASDAQ at annualized returns of 28% per year. So if they’re buying stocks on a dip, why would they not be buying Bitcoin on a dip? That’s the question we really need to ask ourselves and a little concerning.
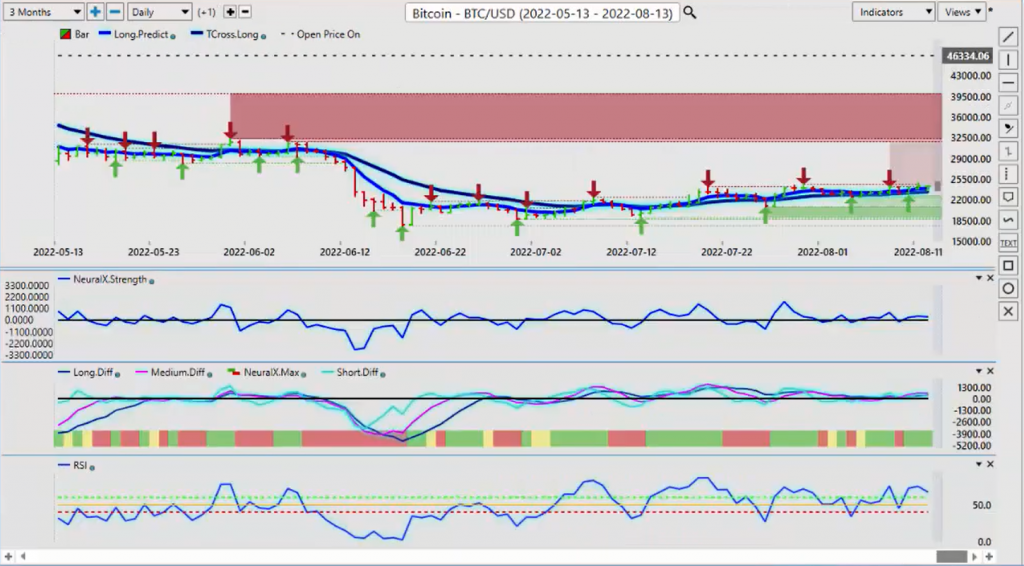
JP Morgan came out. JP Morgan chase came out and said, Bitcoin’s hit a bottom. That usually would tell me that Bitcoin’s going lower when they make a comment like that they’re pushing people into it, but we’ll see. Right now, our T cross long is coming in at 23406. We will look for that to hold, but we are absolutely moving sideways here from, you can see on June the 18th, we’ve got a couple of highs being put in here around the 24,6 17 mark.
We need to break out of this channel that we’ve been in for the last couple of months to see if we can break higher. The indicators look like we have a shot at that, but they’re basically running flat. We’ll continue to monitor that critical T cross long and look for a breakout above this verified resistance high that’s coming in again at 24617. The indicators are still bullish, but not a lot of momentum in the month of August here, guys, in any market.
S&P 500 Index
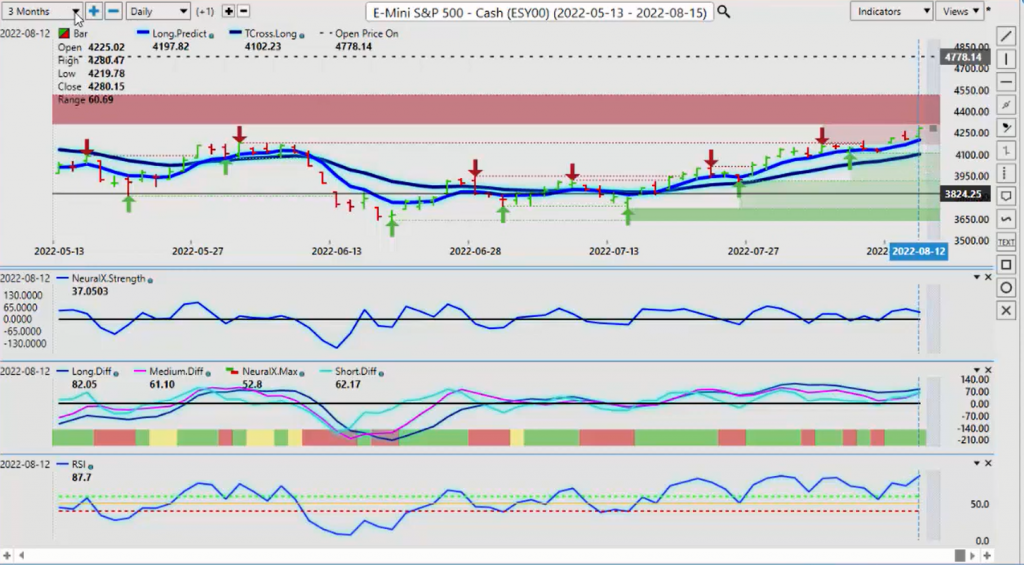
Now, as we look at the S&P 500, lot of different opinions on the S&P. I tend to go with the market and go with the indicators, the intermarket correlations. We’ve had a good rally, but we are coming into some very, very stiff resistance up here. Don’t forget here for 2022 this has not been a good year for the S&P 500 at all, but I think we’ve recovered here.
Now we’re about 10% off the all time highs. That’s a positive. 43.07, this verified zone, this is the level we need to watch this week. If we can break through that, then we have a shot, at least a shot of moving towards 4500. But again, we shall see here.
The indicators are starting to run a little bit sideways here. You can see the slope of the neural index strength is rolling over back down. Predicted differences look quite good. The RSI is in over bought territory at 87.7. I’m not a person that trades off of over bought, oversold, anything along that lines. I think that if something is trending and you’ve got strong buyers, you’ve got algorithmic programs that are buying something, then I’m not going to fight the market and say, “Okay, you’re over bought. Stop here. Go lower,” but a corrective move is certainly reasonable.
The further we move away from the T cross long at 41.02, the more likely it is, we’re going to retrace to it. And you can see that all over here in the VantagePoint software using these predicted moving averages. So again, our immediate resistance where I think you could see some sellers come out will bet will be between 43.07 and 45.12. But the first immediate hurdle that we need to clear again, 43.07, be very, very cautious around that particular level.
Crude Oil
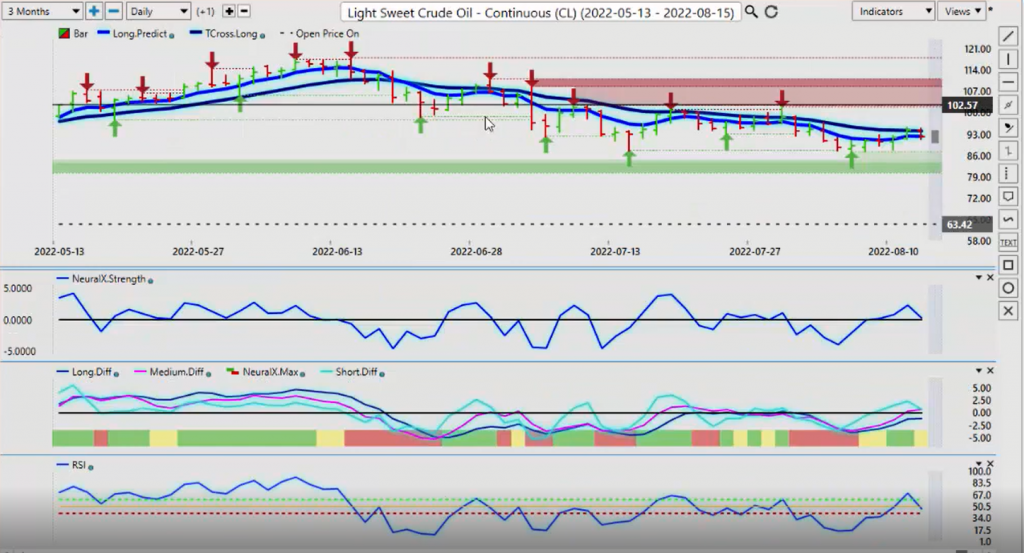
Now, one of the reasons I say that too, is that you’ve got a high correlation between oil and equity still. It’s been a little choppy since the Russia/Ukraine war. People are interfering trying to get oil prices back down, but right now oil still remains soft here. We’ve closed the week here down around $92 per barrel. I think there mainly we’re looking at oil to try and move lower over the next several months and that could weigh on equities, but a very mixed signal here.
Predicted differences are still showing some bullish signs here. Even the neural index strength, it’s sloping down. We’ve got a reverse check mark here on the predicted RSI. So we’ll monitor it. But our key resistance for the week coming up is 93.87. The theory here short while below 9387, long only if we’re closing above 93.87. And I would argue at least one or two days in a row. I would prefer two preferably, especially with these choppy conditions.
Euro versus U.S. Dollar
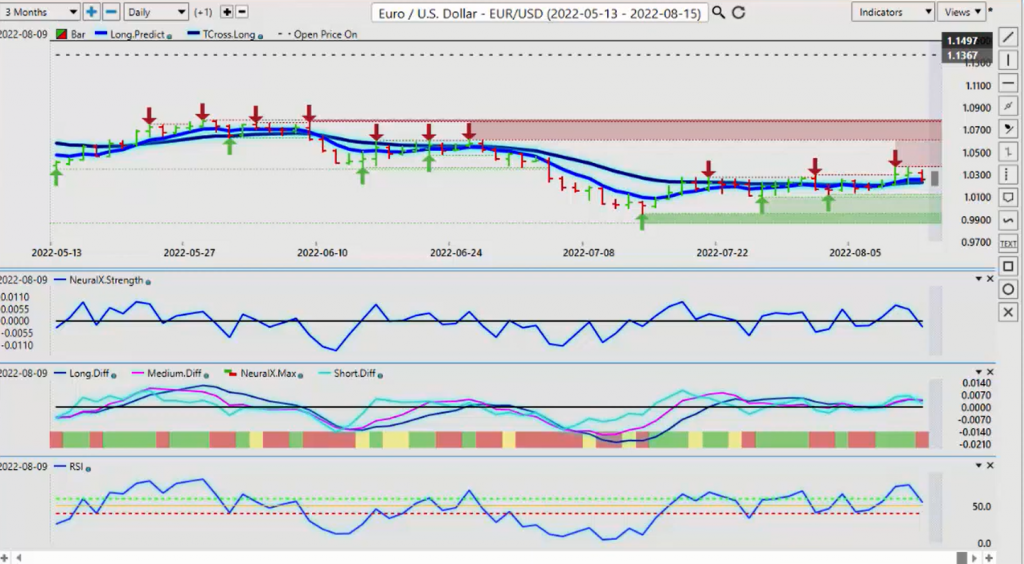
Now, as we look at our main four X pairs this week, now, once again, you can see that we’ve had a big spike in the Euro currency, the Euro/Us pair. We went all the way up to 103.78. But I would argue in the month of August on a statistical percentage basis, the Euro has capped on the upside. So when we made that move, you can see the very next day, just like the dollar index, there was no follow through. And by Friday we were sinking all the way back down and closing the week.
And this is the one that’s the concerning to me for dollar shorts is that 102.57. We have fallen right back within this original range. And this breakout point that we had was coming in… You can see the major breakdown, which is up here, but we had another sharp breakdown from the support low. And that was coming in at about 103.59.
So I was looking for the pair to close at least above 103 and we didn’t. So our T cross long is 102.31. We missed our window because of that CPI number for US dollar strength. I believe we could see that coming into next week. And if that’s true, the Euro is the one that would be affected by that at the greatest.
But always remember never trust Monday priced, guys. Whatever it does on Monday, it will likely do the exact opposite on Tuesday. So basically that’s going to set the tone for the week, but right now, the immediate resistance that we’re dealing with is 103.68. And unless we can get above that, the Euro down trend remains intact. Neural index strength is pointing down. The predicted differences are rolling over and our predicted RSI also falling.
U.S. Dollar versus Swiss Franc
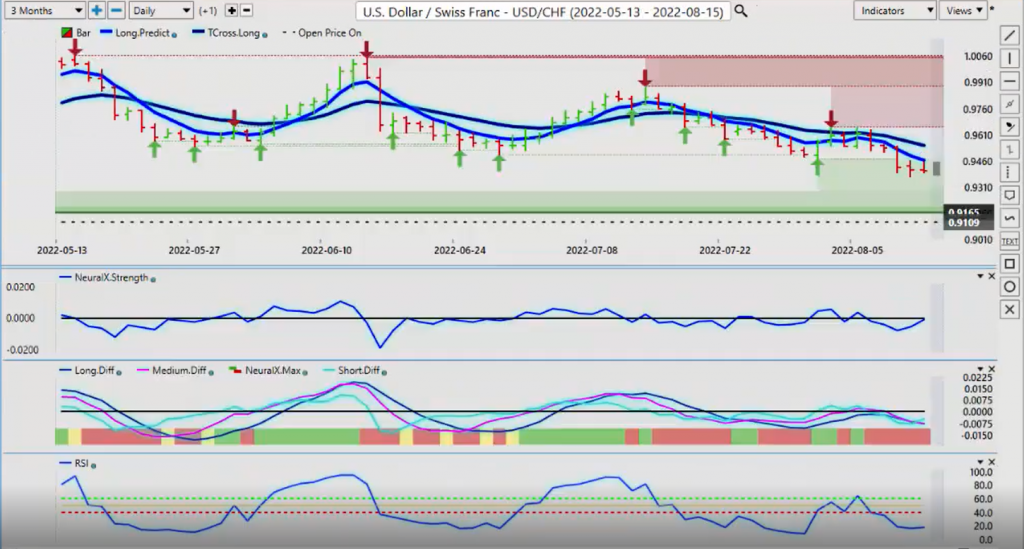
Now, if that’s the case we could see… We’re still looking for a long on US/Swiss Frank. Now we have closed below that verified low support, but that coming in at about 94.71. I would argue that if we get back up above 94.71, that at the very minimal we will retrace back to 95.50 the T cross long on a US dollar rebound.
We could have a fed. One of the fed members could come out next week and likely will after that CPI number and say, “Yeah, so what? We’re still hiking.” And next thing you know the dollar’s rebounding again.
Once again, I’m not a long term buyer of the Us dollar. If I had my choice between long term positions, they would be not in the US dollar. They would be in Bitcoin. They would be in gold because these two gold and Bitcoin remain in very strong up trends from their inception price, or even looking back 20 years ago. The dollar is still down 30% where Bitcoin, gold, even the S& P 500 and the NASDAQ. They are well above where they were 20 years ago. So again, if we get that dollar rebound, this is the one we want to keep our eye on.
Was this a false break below that verified zone? It certainly appears that it could be. So again, the indicators are starting to turn back positive again here. We missed our little bit of a window from that CPI number. But again, watch that level I just mentioned very closely and the probability of a potential long still remains intact.
British Pound versus U.S. Dollar
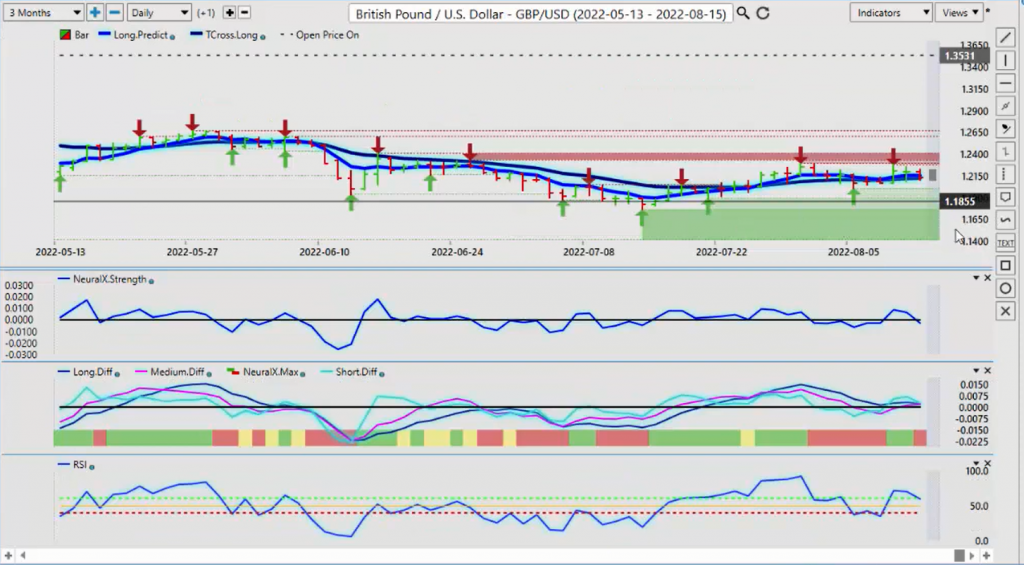
Now the inflation data out of the UK is no better than the US. So when we look at it from that perspective, you can see that we had a big rebound after that CPI number, but we just simply came back up to where we’ve already been, guys. The verified high from August the first 122.93. I don’t even think we got that high on there. We didn’t. 122.75. And they were just sitting there camped out around those verified zones, waiting to sell this thing.
So once again, several things point that the dollar is still going to rally at some point next week here. We’ve finished the week on the T cross long 121.24. We’re closing 121.26. We’re basically closing right on that level.
But once again here people buying into that weaker CPI number. There was zero follow through, okay? So if the pound is really strong, you can see we’re essentially running in a channel. The same thing, going back to August, or excuse me, June the 14th to our high on August the first this channel remains intact. And we’re looking for a break of this particular channel for the next big move.
In my respectful opinion, only again, we will not get that until September when real money is back in. You’ve got a lot of banks on holidays. It’s just August is a very choppy month to say the least.
U.S. Dollar versus Japanese Yen
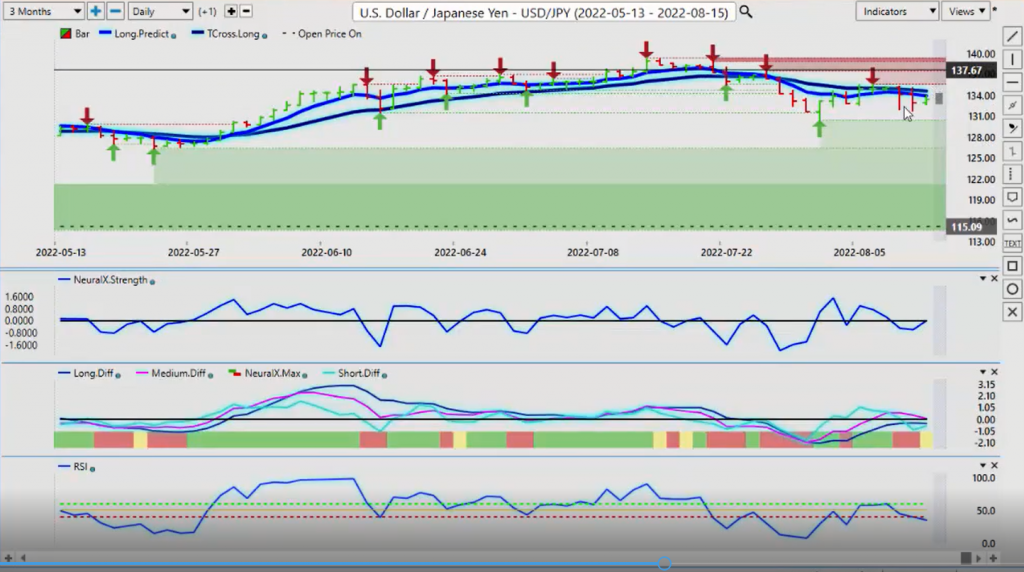
Now, when we look at the dollar/yen and there is scope for some recovery in the dollar/yen this coming week. It’s trying, but you can see that we had this big selloff once again on that CPI number. A Tiny little bit of follow through on Thursday, but on Friday we are dead flat.
So when we look at the indicators here, our neural index strength is starting to turn up, but our predicted RSI is breaking the 40 levels, suggesting there’s momentum. Now this could be interpreted a couple of different ways. It could also point to dollar strength in the aforementioned indicators, but it also could be warning that the stocks are getting ready to turn back down because the yen, the Swiss Frank, they’re highly correlated to gold.
So it indirectly points to long [inaudible 00:16:31] on gold and the Us stock markets are simply correcting higher. So we’ll continue to monitor this. But for now, if the dollar, yen can move back up above the T cross long at 134.61, we can see further gains on this, but we must break through that level. And again, the general rule of thumb is that when we’re below the T cross long we’re short and when we’re above we’re long.
And the alternative way of going long is when we make a significant move away from again, that T cross long. And then we enter into one of my favorite ways of trading, mean revision, guys. The theory is that nothing goes straight up and nothing goes straight down. If we have a anchor point, so to speak using that T cross long, then we also have a mean revision point that we can measure that to. So again, watch this level very closely. If it breaks 134.61, just again, be very cautious in Monday trading. Those fake prices between Monday and Tuesday have never been stronger.
U.S. Dollar versus Canadian Dollar
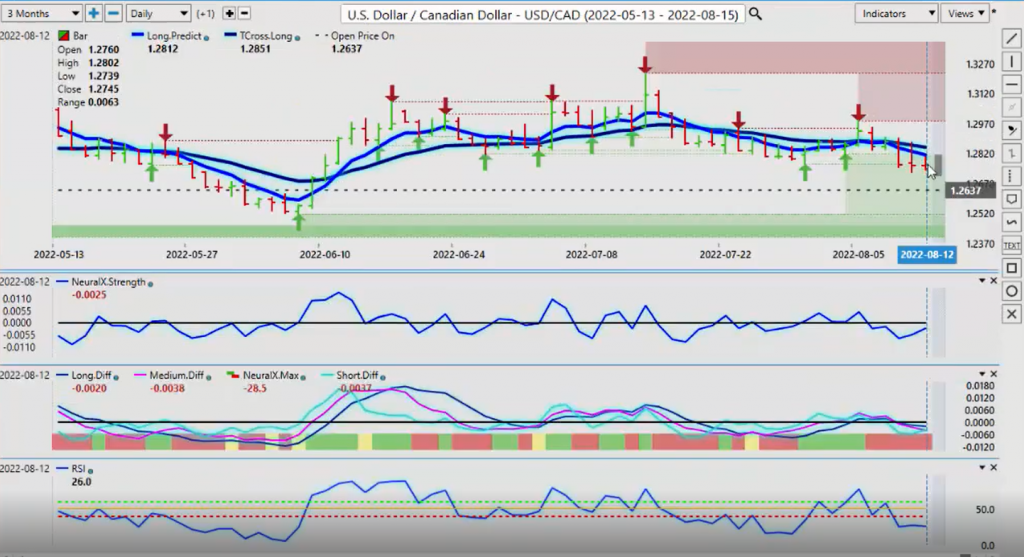
Now the US/Canada here again, you can see this yearly opening price lingering down here at 126.37. I believe that oil will come under additional selling pressure, maybe not excessive selling pressure, but selling pressure just the same, that stocks will struggle a little bit in August and going into September. And if that’s the case, then that will not benefit the Canadian dollar in any way.
So 126.37 the yearly opening price. It’s worth a shot, a stab at a long here either way, but we do need those stocks going lower. We need oil going lower. Gold is not heavily affected by the Canadian dollar either way. It’s mainly equities and oil. So we’ll watch those two. And again, oil still firmly down, but a mixed signal there.
So for now, if we start pressuring the tee cross long at one… The first one is the long predicted 128.12. Then we go to 128.51. If we can get above 128.51, then that would most certainly open the door back up to potentially the one 30 area. That’s what I would be looking for going into see mid-September. We’ll see. But right now the key thing is we need to hold above that yearly opening price at 126.37. And we’re looking for the VantagePoint indicators to roll over to the long side. So we can pick up on premium position.
Australian Dollar versus U.S. Dollar
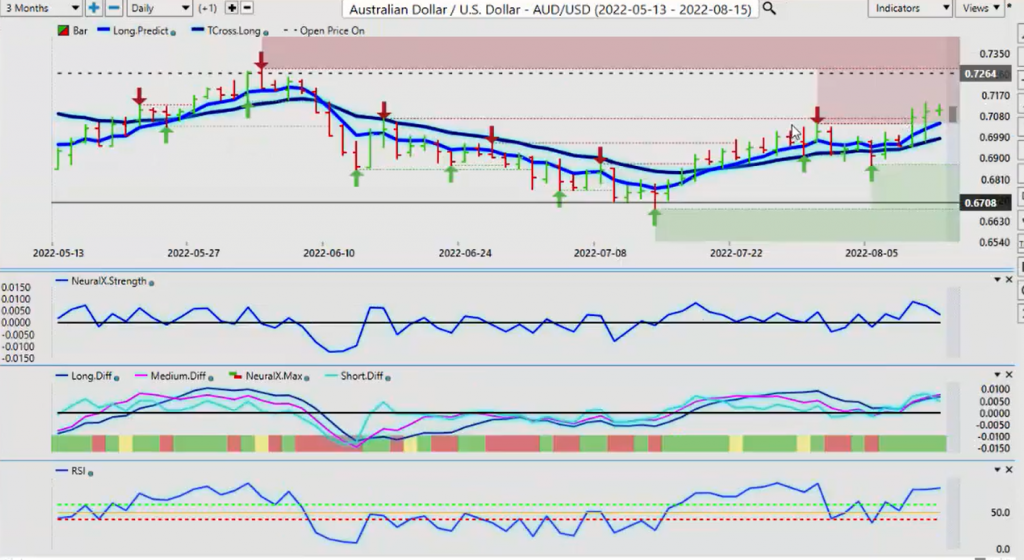
Now, with the Aussie and the New Zealand, once again, the Aussie has made some pretty big gains, but it was on the back of that weaker CPI number, not real demand for the Aussie currency. So we’ve had a little bit of a follow through. Actually a fairly significant selloff and then a rally back up on Thursday. And then we’re dead flat on Friday.
So what I would argue here now is, once again, that you’re below the yearly opening price. We’ve got a verified resistance high at 70.69. We need to stay above that breakout point. If we can’t hold above 70.69, you’re going to have a premium short back down to the T cross long at 69.84.
So again, when we look at the Aussie currency, because again, I think we get a little mixed up with up trends down trends, the Aussie in this particular year is not doing well. It hasn’t done well since the stocks really got hammered in may with the Russia/Ukraine incident.
So again, you we’ve retraced to the yearly opening price on June the third, and we haven’t come anywhere near it since. So this level of 70, the highest 70. 46, approximately the breakout point, or I think it was a little higher than that, wasn’t it? Yes, it was. 70. 69. That’s the level. We need to stay above that. If we’re going to get into a new trading range with the Aussie that needs to hold.
And so from there we go to the VantagePoint indicators and they’re starting to flatten out here. Our predicted RSI is dead flat. The predicted differences are flattening out. The neural index strength is sloping downwards. So once again, we will keep an eye on this, but your first line in the sand for support on Monday comes at your predicted low for the day 70.85 and are long predicted at 70.51.
All of the support is sitting there to begin the week. That’s where we would attempt longs. But again, if you’re trading the Aussie, you’re trading the S&P 500 and Bitcoin. You need to keep an eye on those inner market correlations. So if the S&P 500 cannot clear 43.07, the Aussie will start to pull back.
New Zealand Dollar versus U.S. Dollar
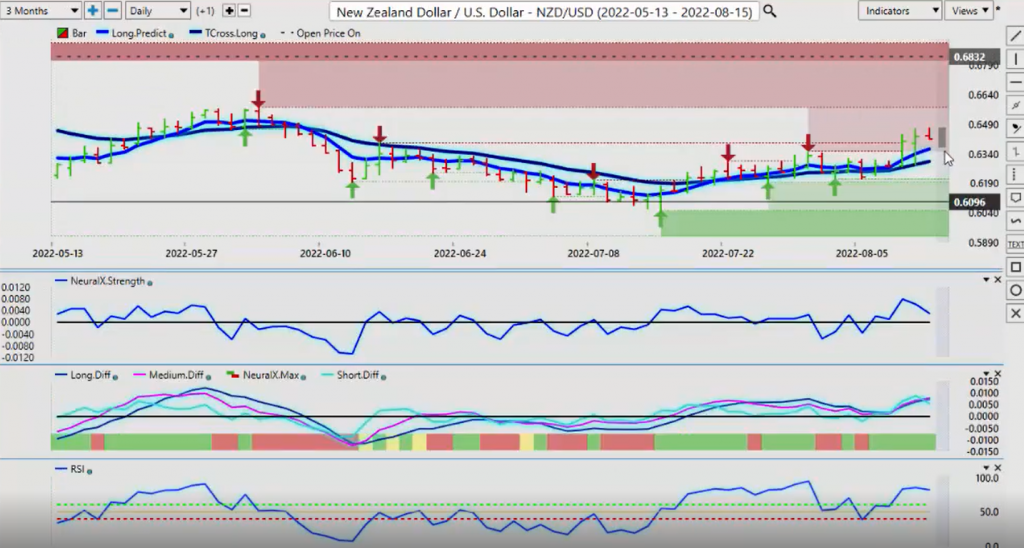
You will see the exact same thing happen with the New Zealand currency. You can see that verified resistance high is coming in at 63.95. The bulk of these gains came from the US CPI number and the next day, but you’ll notice how it used the VantagePoint T cross long as a springboard to sell off.
So you always want to make sure you’re keeping your stops on a long trade below that T cross long, because anywhere in there you can see is not a true price. When it came down, it kissed the VantagePoint T cross long and then shot right back up to where it ended and had a very, very strong close on Thursday. But on Friday basically we had no buyers and really no sellers either.
So we’re going to still have a choppy week ahead again, but just remember very, very low volume in the month of August. And we’re really just gearing up for September. So with that said, this is the VantagePoint AI Market Outlook for the week of August the 15th, 2022