


Welcome to the Artificial Intelligence Outlook for Forex trading.
VIDEO TRANSCRIPT
Hello, everyone. And welcome back. My name is Greg Firman, and this is the VantagePoint AI Market Outlook for the week of April 4, 2022.
Now to get started this week, we’re going to begin where we always do with that very important U.S. Dollar Index. Now, the dollar recovering into the end of the week, but as we can see here using our main indicators, and we’ll briefly, I’ll go through the indicators we’ll be using this week. We’re using bars, not candles. We’re using our predicted short, medium, and long-term differences. Our neural index with our neural index strength. Point in time, which we’ll set to the weekly and the yearly opening prices. The triple EMA cross, which has been modified to remove the short and medium and we’ll focus strictly on the T cross long. But again, we’re also using the long-term crossover, which also has been modified to remove the black line, and we’re focusing strictly on the predicted moving averages and using those as pivot levels. Now, we’re also using, focusing heavily on the very popular verified support and resistance zones.
So when we apply those, we can see that the dollar, again, came out of the gate on Monday very strong. I anticipate the dollar will do that again this week. But we can also assess, we have that Tuesday reversal that I’ve talked about here and in the VantagePoint Live Training Room where whatever the market does on the Monday, it very often does the exact opposite on the Tuesday. So I always caution people to be very, very careful when entering positions on Monday. Look to see how the market develops to start the week and then go after the market on Tuesdays or mid-to-late- day Monday once all markets are in, meaning Europe, London, and, of course, the U.S., North American markets.
U.S. Dollar Index ($IDX)
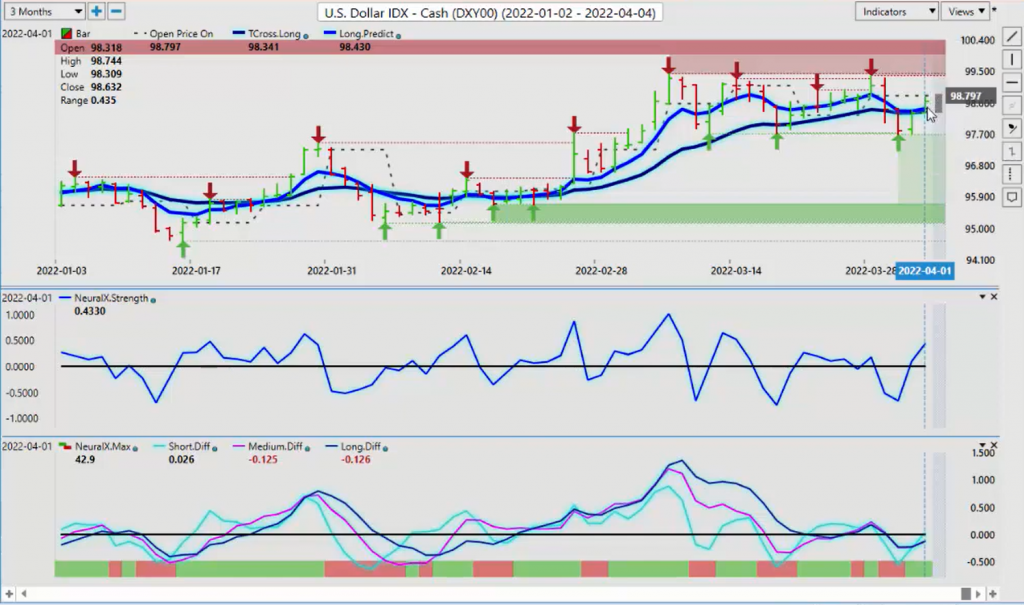
So when we look at the Dollar Index here, it’s recovered on a, I would call that a strong labor report, again a pretty decent number. But we’ve paused and come right back to the weekly opening price to finish the week. We recovered and moved back up above our long predicted at 98.43. Enter T cross long at 98.34. But this is the area we want to watch very carefully.
Now, in a number of different cases, after the nonfarm payroll number, usually three, four, five days afterwards, the dollar sells off either way. So if we get any positive developments in the Russia-Ukraine conflict, that will be a huge negative for the dollar. Now, we also have the event risk this week of the FOMC. I believe that that Fed is, or this particular Fed is not going to be kind to the dollar, but he will be kind to the equity markets because, again, stocks under pressure. I’ll talk about that in a minute. But the main thing is the Fed doesn’t want the dollar getting too strong, in my view. And he definitely doesn’t want people leaving the stock market because they’re worried about a recession, these kind of things.
So it’ll be a very interesting minutes on Wednesday, but for now our channel low is coming in at 97.72. That area continues to hold. The verified zones first identified this level back on March the 10th, you can see. And we’ve come back down and hit this multiple times. So we’ve got very heavy support down here. We’ve actually hit this support four times over the last month. But we have equally strong resistance up at the 99.40 level. So we would have to break free and clear of one side or the other, but my biased here would be slightly to the downside.
Now, the seasonal pattern with the U.S. dollar is it usually is done by mid-April, and then it tends to just kind of go sideways for the next few months until we get into the next big move, which would be in September. So even though the Fed is hiking, just remember, other countries are hiking too. And right now, the dollar is enjoying the benefit of the seasonal pattern, plus we also have the Russia- Ukraine, that flight to safety into the U.S. dollar. So again, we’ll watch this level very closely. So the initial move to start the week will likely be to the upside. The question is are we going to have a repeat of last week where we get the rally on Monday only to sell-off for the next two days?
Now, the indicators from VantagePoint, the predicted differences, our main three crossovers, our short, medium, and long, they’re all below the zero line. The neural index strength is pointing higher and moving above the zero line with the main neural index. So internally, we can see that strength to begin the week. My optimism remains guarded whether we can maintain that strength past Wednesday.
S&P 500 Index
Now, when we look at the S&P 500, once again we’re going to jump over here to the equity markets. The equity markets, again, as we discussed last week, they had a very interesting week this week. Once again, we came out very strong, but that bull trap, which I warned everybody last week, be very careful around this 4595 or the 4600 mark. And as you can see, we failed. We moved above it. That’s a classic bull trap. That’s why we use these verified zones to identify these levels just to make sure that we’re not getting caught in these traps.
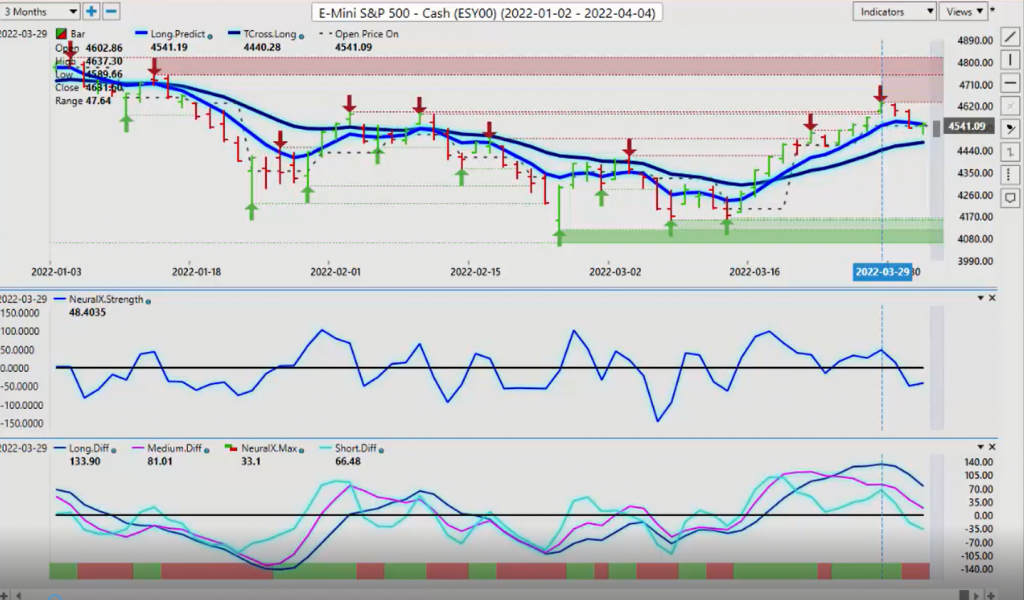
Now, the S&P is holding above our T cross long, 4472. But the indicators are quite mixed here. And again, one of the leading indicators here is the medium-term crossing the long-term predicted difference. That warned me that, look, we don’t necessarily have a lot of strength up here. We’re below the yearly opening price on the year at 4775. But we did hold above the weekly opening price for the better part of the week, and then we closed the week right on that weekly opening price.
So again, always make sure you’re working that into your trading methodologies because this is basically a non-indicator. It just tells us whether we have momentum to the upside or the downside. And the theory is the same as the predicted moving average, above them long, below them short. It’s a very easy way to set this up. So right now, slight bias to the upside for stocks, but I have some very serious concerns if we can’t get above the 4600 mark.
Bitcoin
Now, with stocks moving higher, obviously we’ve had a good week in Bitcoin again, but we’re stalling out here. Now, we opened the week strong, well above the weekly opening price. But again, right now, here is where we’ll make a little switch to our little modification, to our point in time. So right now, that’s set to the week. We’re going to move this over to the yearly, and then I’m going to hit apply. And then this is a much bigger level that I want to point out to everybody here. That price on open is 46334. To be clear, this could be a bull trap also. We need to get above this level and stay above this level. The seasonality of Bitcoin, usually by mid-April through till, going through until September, Bitcoin is usually quite strong. So I would be looking for it to hold above here. We’ve got our neural index strength, which is pointing higher.
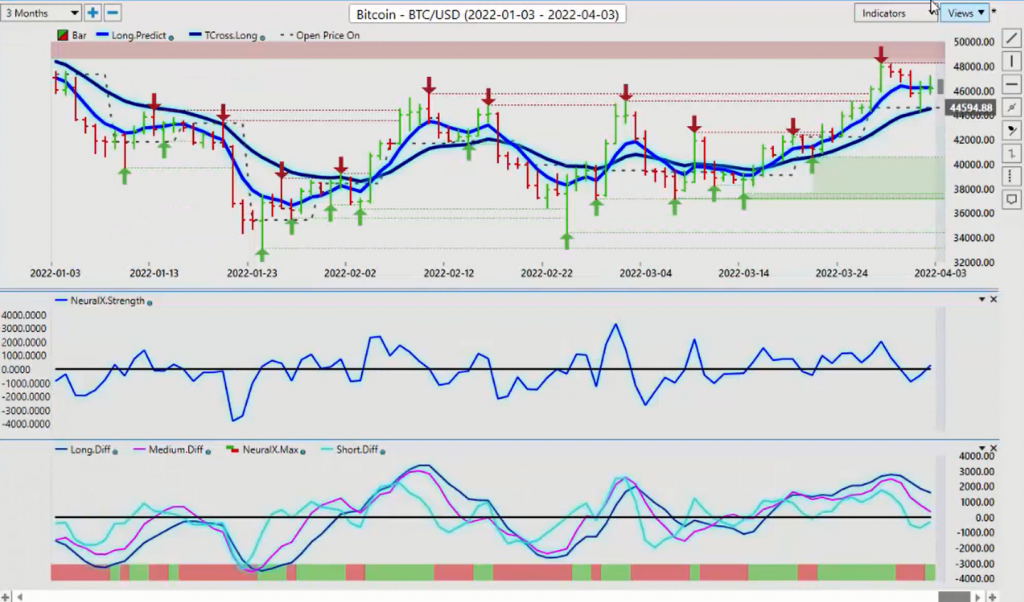
Our predicted differences are mixed, but it looks to be corrective in nature at this time. This is a perfect example of using the predicted moving averages as a pivot level. So you can see, the market… And again, you can’t script this, guys, because this is an outlook, not a recap of something that already happened. I want to point that out. I often get questions about that. But I will point out to everyone that this video is being produced and posted. You may receive it late, but it’s posted while the markets are closed on Sunday morning. So again, when we look at this from last week, we pre-identified the predicted moving average. We came down to the VPT cross long at 44300 and took a very strong bounce out of that area.
So again, using these predicted moving averages in this way can be very lucrative, to say the least, as long as you can pre-identify them. So going in starting next week, we pre-identify that T cross long at 44510. That’s our key support level. Our key resistance is the price on open, 46334. We need to clear that. Right now, the market is trapped between the yearly opening price and the T cross long. And I do anticipate a break of one side or the other going into next week.
Gold
Now, when we look at, again, gold prices, in my respectful opinion only, gold is on borrowed time here likely. The second the Ukraine-Russia conflict calms down, then gold is going to struggle here. And I believe money will move into Bitcoin or inevitably Bitcoin and gold may correlate to each other. Right now, they’re not.
So if we look at this, gold not having a great week. We’ve got the unemployment report out of the U.S. that was pretty solid. Our neural index strength indicator and our neural index and our predicted differences are all pointing down to start the week. So again, when we look at this, we would apply our weekly opening price, but we would look at the T cross long, 19036. This is the level we want to watch the better part of the week. Each night that T cross long and the long predicted are updated. Right now, we can see our long predicted and our T cross long are both at almost the exact same level. We’ve closed the week below them both at 1923. So again, this could be a tough week for gold. And if things calm down in Russia, then it could be a very, very good selling opportunity if we hold below those aforementioned levels.
Crude Oil
Now, once again, with light, sweet crude oil, I believe that Biden has a plan here potentially to flood the market with their own oil. I hope it works and the gas prices come down. But right now, we do have a pretty strong sell signal forming here. But it can be undone very quickly if things fall apart with Russia, Ukraine again.
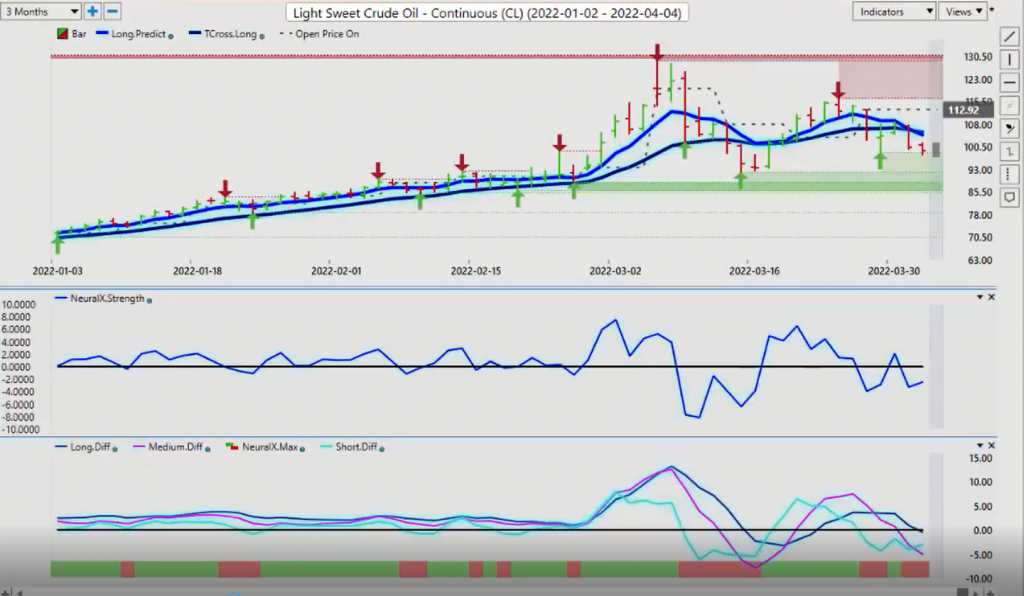
So looking at it right now, everything is pointing down. We’ve got a very strong, a couple of very strong verified support lows. The first one’s coming in at 98.44. The secondary one is coming in at 92.08. And the really big one that we’ve got is down in here. That’s around the 85.10. I believe looking at the VantagePoint indicators and the trade setup to begin the week that we have a real chance of pushing down to at least into the lower 90 range. So again, we’ll watch this one very closely. But I would advise extreme caution of trading this either long or short given these wild price spikes.
Euro versus U.S. Dollar
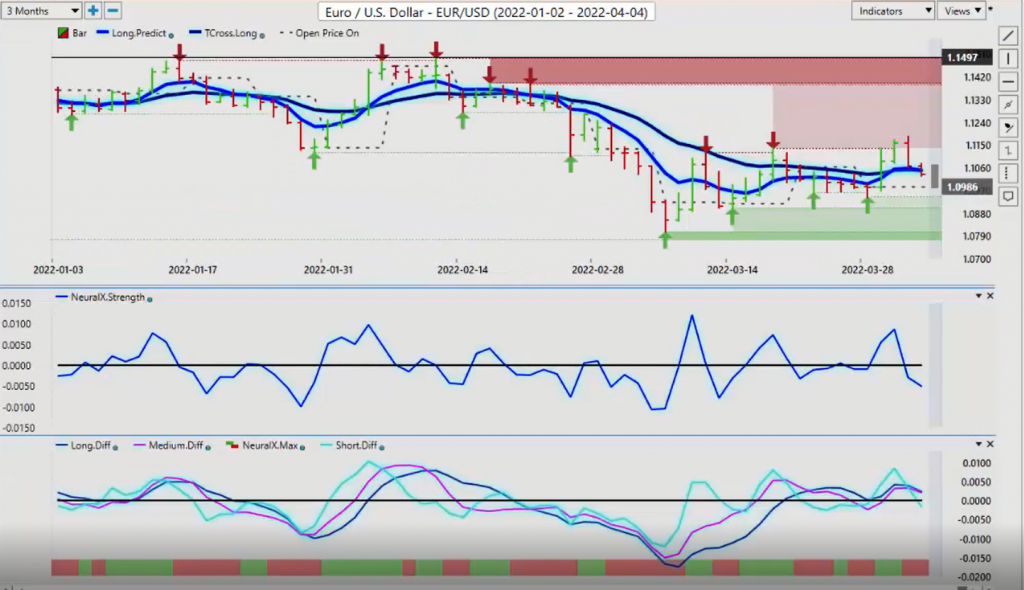
Now, as we move into the week here and we begin our trading with our Forex pairs, I believe that most eyes will be on Euro/U.S. to begin the week. The Euro tried to make a break here. And again, showing the power of the verified zones, using them as pivot levels, the same as the predicted highs, predicted lows, the T cross long, the long predicted, the verified zone is just an extension of that where it identifies a failure point in the market. There’s nothing to debate on that. The market failed at the high 1.137. We’ve come up here. You can see we tried to close above it here on Wednesday only to have a big sell-off on Thursday. Again, another classic bull trap. But that’s what the verified zones do. They warn us of this.
So again, we can see that the Euro likely not to start the week well. But I suspect it may finish the week well. And what I mean by that is the European Central Bank they’re gearing up, talking about rate hikes also, and just more or less a lack of dollar demand could be coming down the pipe here, again with Russia calming down, the seasonality coming to an end at mid- April, late April, maybe even early April. But either way, when we look at dollar demand drying up, then that could push Euro/U.S. higher.
So the levels I would strongly advise to keep my eye on… I don’t know if we’re going to get down to the 1.08 area. I think we’re going to get tangled up right in this area here, down around the 1.0961 is a potential, or maybe a hair lower at 1.0945 is a potential area to look for a possible long. But I don’t think the Euro will make its move until after those Fed minutes on Wednesday.
So watch those minutes very closely. In most cases, it’s a buy the rumor, sell the fact. So in this particular case, they’d be buying the dollar up until the Fed minutes and maybe slightly after. And then I would look for the Euro to potentially make a comeback on Thursday or Friday or in the latter part of the week. But again, watch those key VantagePoint levels. The immediate move is clearly likely to be the downside. The Euro still bearish on the year, below its yearly opening price.
U.S. Dollar versus Swiss Franc
Now, the U.S./Swiss franc going into next week, if we’re looking for places of value to buy U.S. dollars, then this is a potential place to do that. We’re above our yearly opening price. I can modify this very quickly in the VantagePoint software going with our point in time, changing that from the weekly price to the yearly price. Fantastic tool to use because, again, it’s a non-indicator, guys. It’s price-action based.
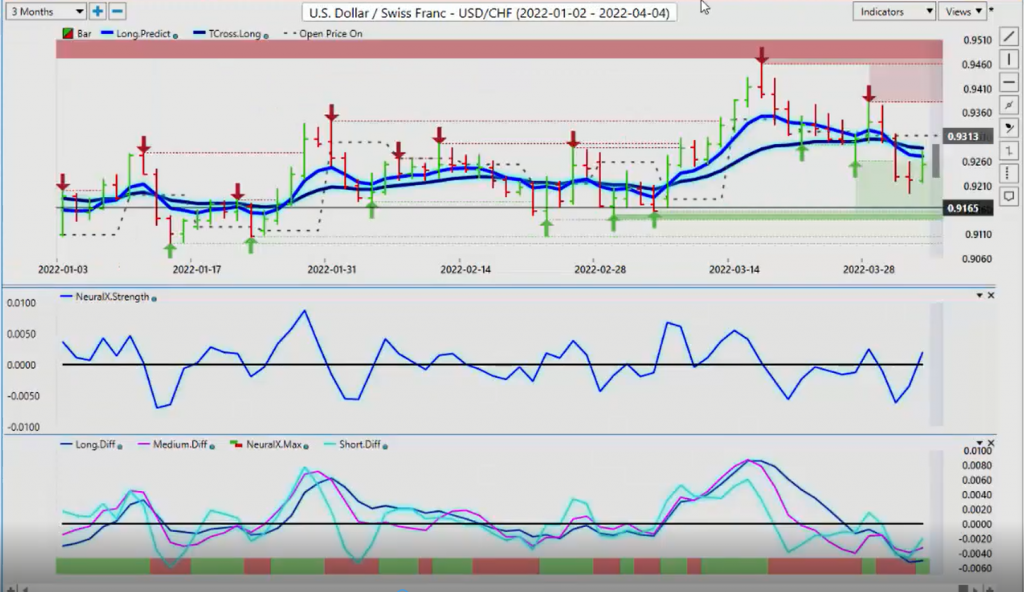
So when they’re saying that U.S./Swiss franc is bullish or bearish, you can make the argument and say, “Well, no, it’s firmly above its yearly opening price.” That yearly opening price is .9109. It’s bullish while above that level, even though we do have a crossover here, guys. But these predicted differences are starting to rise. Our neural index strength is pointing up. Internally, looking inside the neural index is warning us that this is potentially getting ready to rally again.
So again, we just look for that potential entry point. Our predicted low is at .9228 to begin the week. I believe we’ll extend a little bit lower than that potentially this week, and then we’ll rally higher into the middle of the month. So again, watch the levels very clearly, closely, excuse me. But the neural index strength and the neural index are warning that the initial move will likely be to the upside.
British Pound versus U.S. Dollar
Now, with the pound/dollar, we’ve discussed this one at length over the last few weeks and in the VP Live Training Room. And this is an excellent illustration of using the predicted moving averages as a pivot level, as a potential entry point or a potential place to straddle this. So if I’m going to give something to the bulls, then the bulls, my argument would be we’ve got a newly formed verified support low at 1.3051. We have an additional verified support low that’s formed at approximately the 1.2998 area, or we’ll just round it out and say 1.30. So I would argue we would be long while above 130, because, again, we’re not, this is if you’re going, if… And again, I’m trying to give something to both sides here, the bulls and the bears. That’s the bull argument.
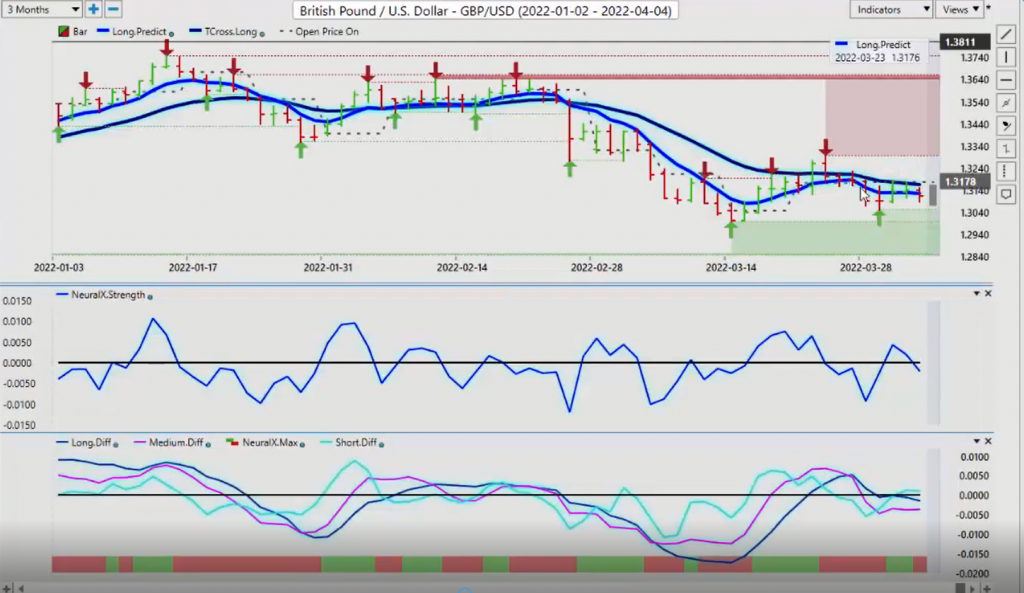
The bear argument is that selling every single day into this VantagePoint T cross long or the long predicted is very, very profitable. Now, I’m not showing you something after the fact because we already discussed this in last week’s Outlook, which was also done on the Sunday morning, posted prior to the market opening. If you were emailed the Outlook, just remember it’s posted Sunday, at the latest Sunday afternoon. I’ve been going a little bit longer before I post it because of the conflict in Russia, because I don’t want to get caught in any of that stuff. But again, selling into these levels is pretty strong.
But the seasonal play here on the pound is that with the dollar weakness potentially kicking in shortly, that this could be a place of value to buy dollars. But again, you can also straddle this very easily like I discussed last week. Our T cross long is 1.3164. You can continue to sell into that level until you can’t do it anymore and then have a buy stop order ready to go at say 1.32. You cut your short and you go long.
So again, I’m trying to give something to everybody here and illustrate unconventional strategies with straddles and all these things. Or just simply, just keep selling into that level till you can’t do it anymore and then go long. So whatever you lose on the downside, you should be able to make back pretty quickly on the upside. But watch these levels. If we break the VP level, then we go after the verified zone. The verified zone high, that’s coming in at 1.3297. So I believe if we break the VP level, that we will move to that level very quickly.
U.S. Dollar versus Japanese Yen
Now with the dollar/yen, excuse me, bit of summer, spring cold here in Canada, with this particular pair, I believe it’s on borrowed time up here. Again, we’ve had a significant extension here during a period of known U.S. dollar strength, but I don’t think any of us thought that it would push this high. But you can see if you follow my cursor here, and I’ll just illustrate that. Using the weekly opening price is also beneficial here because you can see that this looks like a set of steps going higher. Leaving that weekly opening price behind on our charts, again, allows us to see this.
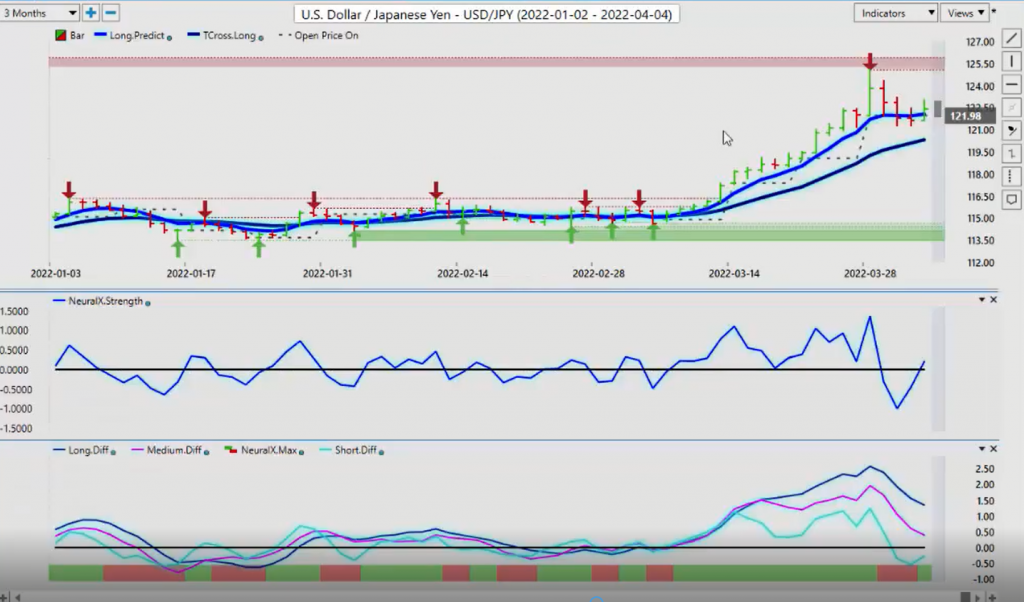
So when I’m doing that, I can say, okay, if I’m not making a new step here pretty soon, then we’re likely going down. And again, this is a grossly overextended move after that break of the 116.30 area. But for now, the indicators in VP are giving us an early warning sign that there’s maybe a crack in the dam here. We haven’t tested the T cross long in over a month.
So that T cross long is coming in at 120.31. I do anticipate that we will test that in the next several weeks, maybe even sooner. The Fed minutes will dictate what happens here. But again, grossly overextended. Doesn’t mean it can’t go higher. But for now, we do have a new verified support high. That’s coming in at 125.09. And again, in most cases, what I will point out, when gold is above 1900 an ounce, that would put fair value at the dollar/yen at about 108, 109, guys, maybe even 107. But it certainly wouldn’t be 125. So something’s a little bit off here. But again, we will watch that level very closely going into next week’s trading.
U.S. Dollar versus Canadian Dollar
Now with the U.S./Canada, it’s made a big move down. But now we’re getting, again you can see the value in the verified zones. And these go back into the January of this year where we’ve come down, tested this. And now we’re getting tangled up around the low, around 1.2451. Ultimately, I think we could see a break of this. But if Biden’s plan on flooding the market with U.S. oil or opening up those reserves works and you get a lot more supply than you have in demand and gas prices come down, that could hurt the Canadian dollar very much so. But we also have the event risk of the Bank of Canada. We’ve got the event risk of the Canadian Labor Report coming out on Friday, which I anticipate will be decent, not great, but it should be okay.
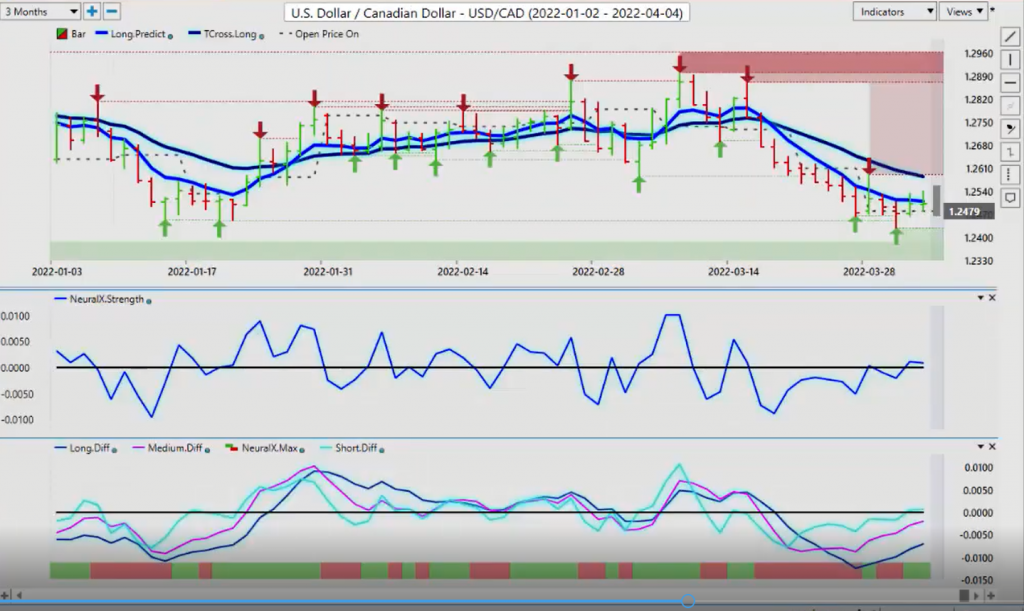
So again, you’re going to see some volatility in this pair this week. Just watch your main level. Right now, we can see that our T cross long is intersecting with the verified zone. So the resistance that I’m seeing at the high is 1.2592. Here’s in a perfect world what I would like to see. What we’ve worked on in the VantagePoint Live Training Room for years, literally years is U.S./Canada reversal from Monday to Tuesday. So what we would look for is a big push to the upside on Monday and then on Tuesday a sell-off.
So again, I would watch this area very closely around that T cross long. And if it rallies up, be careful about getting caught in a bull trap because I believe that ultimately this will likely move lower. But it will be dependent on commodity prices, like gold, oil, and some of your metals. So again, as long as we identify these levels ahead of time, we can easily trade them.
So again, you can straddle this once again up here. You can see we’re all tangled up in the long predicted. Now, it’s going to try and make a push for the T cross long, so you can sell into that level. And again, I’m trying to give something to everybody. The bulls and the bears. The bears, you can target that area up around 1.2592. And your bulls, you can have your stop order ready, buy stop order, excuse me, ready to go above that T cross long at 1.2584. So again, from an outlook standpoint, from a predictive standpoint, I just want to drill home that point that we can get these levels while the markets are actually closed, and then we can apply a trading plan to that, right?
So again, watch the key levels. Right now, neural index strength is kind of sideways, but our predicted differences are rising. And that is a concern. When this aqua-colored blue line goes above the zero line, that means a short-term crossover took place. So if I click on my F6, you can see this aqua-colored blue line. I am using the crossovers, guys. I’m just not visually looking at them. I’m monitoring the predicted differences for any one of these lines. The slope of the line and when it crosses over the zero line, that tells me that a new crossover is just formed. So again, I suspect that this pair will initially make its move on Monday and then down on Tuesday or Wednesday.
Australian Dollar versus U.S. Dollar
Now, Aussie/U.S. and New Zealand/U.S. really frustrating a lot of traders out there and rightfully so. We’re getting all bunched up here on these previous verified resistance highs, up around .7540. We’re not really making a move on either side of the weekly opening here, but we did move above the yearly opening price. So when we modify our charts and we go down here to our point in time and go from… This is what I do every week, guys. I start off, I first of all identify the primary trend using the yearly opening price, which we can see is way down here at .7264. And then on Tuesday, or Monday night, excuse me, when the VantagePoint software updates, then I can switch it over and put it to the weekly opening price and then use at weekly opening price as a pivot level to trade off of. And again, very easy for you guys to do that even without the indicator. You can just draw it onto your charts.
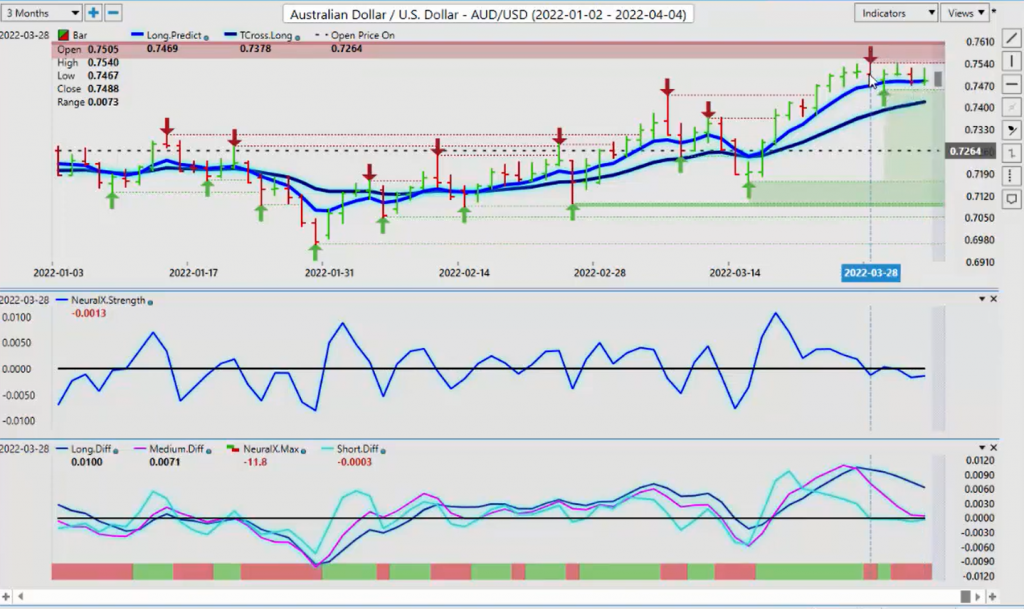
So right now, our T cross long is coming in at .7418. The indicators from VantagePoint are saying we’ve got some bearish trading happening up here. So we identify the high, .7540. I can argue that, okay, well, the primary trend is clearly up, so we’re simply waiting for the market to pull back a little bit so we can get a better entry point. I would respectfully submit that that level would be .7418. This is the area we want to watch. This is where we minimize our risk and maximize our reward because we’re straddling a certain area.
So again, I’m trying to give something to both sides here without debating, without taking a hard position saying you must be long or you must be short. No, you can pick your poison here, guys. So what you can do here is say, okay, well, yeah, I do want to go long and, yes, I do want to go short. So I’m going to focus around these predicted moving averages. And if I break them and close below them, there’s going to be a shift. So you can jump, you can buy at the .7418 level, the T cross long. And if it’s not working, you can cut it at say .7360, .7380 and then put a short order in. But just remember, you would be fighting a pretty strong move to the upside here. And we are positive on the year.
The exact same methodology when we look at it from that perspective would then apply to New Zealand/U.S., a very similar trade. You can see that we came down using that exact strategy that I just mentioned, or I’ve mentioned throughout this presentation, that we can use that level as a pivot. And that pivot on New Zealand is coming in at .6890. So if we break down below .6890 and we take out these two very strong verified support zones, and they would be coming in at .6864, then New Zealand could be getting ready to make a move. Right?
New Zealand Dollar versus U.S. Dollar
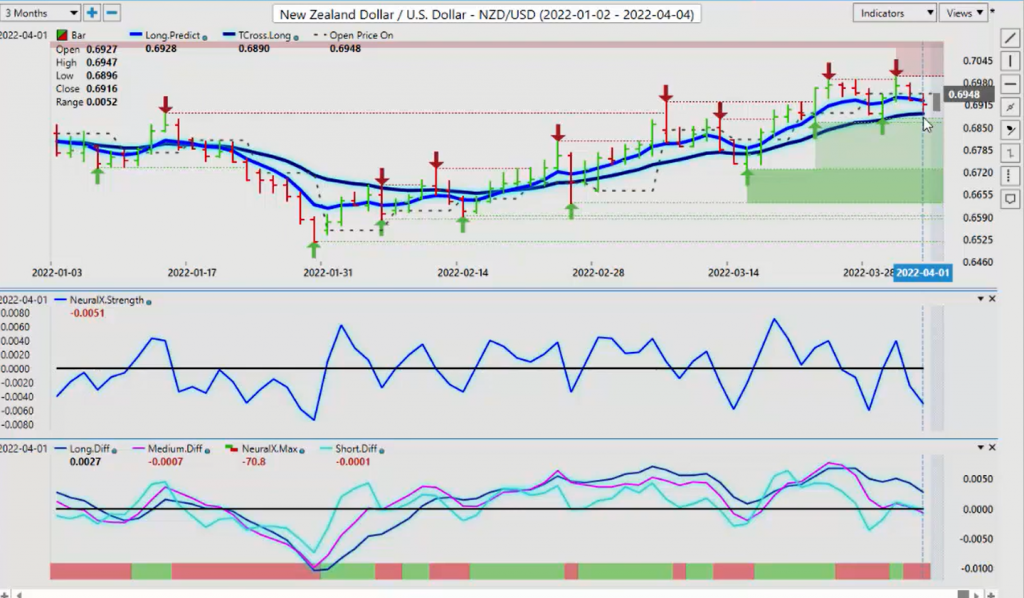
So then what we do is we take our point in time here too and switch that over to the yearly and say, okay, well, where is New Zealand on the yearly? Well, there we’ve got .6832. So to be clear, this is not bearish. It’s bullish while above .6832 because it’s positive on the year. So when somebody tells you something like, for example, Euro/U.S. is super bullish right now. Well, it’s correcting from a bullish standpoint, but it’s still below its yearly opening price. It’s still losing money on the year.
New Zealand/U.S. and Aussie/U.S., they are positive on the year. So we could look to build off of those gains. We have a seasonality with the Dollar Index or the dollar in general. Usually doesn’t do very well in May, June and July, except for around the beginning of the month with that dollar cycle. So again, we’ve got a lot to look at here. But when we look at New Zealand, you can see our neural index strength is a hard down and our neural index itself is down, suggesting that both Aussie/U.S. and New Zealand/U.S. are likely going to start off the week a little bit soft but they could gain strength later in the week.
So we’ve got a very busy week ahead. But again, with the economic announcements that are coming out, there’ll be plenty of opportunity in the major foreign exchange pairs and, of course, our main commodities. So what that said, this is the VantagePoint AI Market Outlook for the week of April 4, 2022.


