


Welcome to the Artificial Intelligence Outlook for Forex trading.
VIDEO TRANSCRIPT
Hello, everyone. Welcome back. My name is Greg Firman and this is the VantagePoint AI Market Outlook for the week of April 3, 2023.
Now, to get started this week, we’ll begin with the S&P 500 of the SPY ETF. As we can see here, the SPY up currently annually on about 6.2%. Now, just to clarify, the SPYs have never been down 10% or more in the calendar year. As you can see here, I’m using the VantagePoint point in time, the yearly opening price, 384, very strong buying opportunity as we’ve gone over in these weekly outlooks so the traders can see price, action and a factual year to date performance.
When we look at it via our heat map, we can see, as I had talked about before, how using rolling performance can be a lagging indicator. These have all now turned positive. They were negative. The five day, the one month, the three month and the six month were all negative leading to a false price. But the year to date remained positive the entire time. So if we use a starting point each calendar year, so basically finishing the first quarter, more or less, we’ve closed out at 6.22%. So when we look at this from a year ago, if we calculate it from a here, then we get a false narrative. This is where we have to be careful because again, last year was an unprecedented calendar year.
So if we go from back if and we skip over the other previous months, and we look at it from this perspective, that gives, again, it shows 10.62% from last year. But again, that’s not a true price. We must look at the start of the first quarter and then combine this. When we look at this again over the last six months, we can see that we haven’t made a new low in this SPYs or the S&P 500 for seven long months, the last six months, this is an accurate view of the price for up 16.8%. So again, we have to be very, very careful in when we’re looking at performance, that we’re using the correct numbers. But again, the year to date we’re up 6.22% and we’re advancing further now. So once again, we can see, as I’ve talked about in the previous outlooks, also by using the 52 week, the two year and the three year, we can see that we’ve always had very strong support at 348. We have not been negative annually in the calendar year 2023 to date. So again, very important.
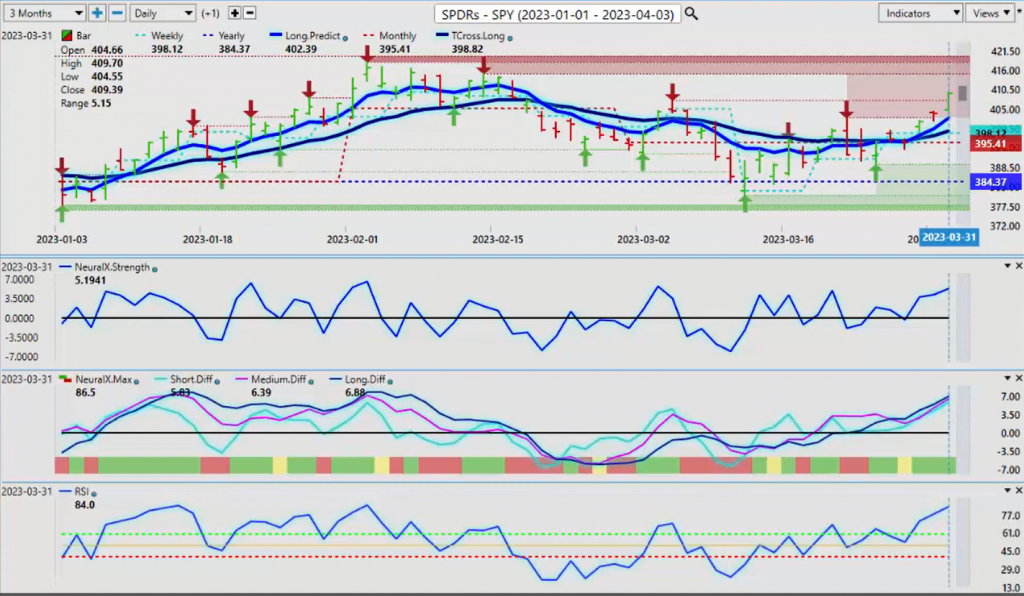
So to start next week, we’re looking at two key support levels at 398 and 402 on the SPYs. This would then directly apply. We can apply the SPYs. If you’re not trading futures directly, then you can use the SPYs. Or if you are, you can use the micro accounts in the S&P. And you can see those two support levels here on the S&P that’s coming in at 38.53 and 40.26. But again, you can see using the proper annual price that there’s been strong buying opportunity this whole time. The Neural Index has been very positive, excuse me, the MA diff cross, which warned us all the way back on essentially March the 13th through March the 16th when the VantagePoint indicators started to roll over to the long side, this led to a substantial move, which I had talked about in the previous outlook.
But the main thing we want to look at here, guys, is make sure that we understand that when we’re talking about rolling performance, we have to be very, very careful of such lagging tools because again, 2022 was an unprecedented calendar year, and the probability that it repeats in 2023 the percentage is very, very low.
U.S. Dollar Index
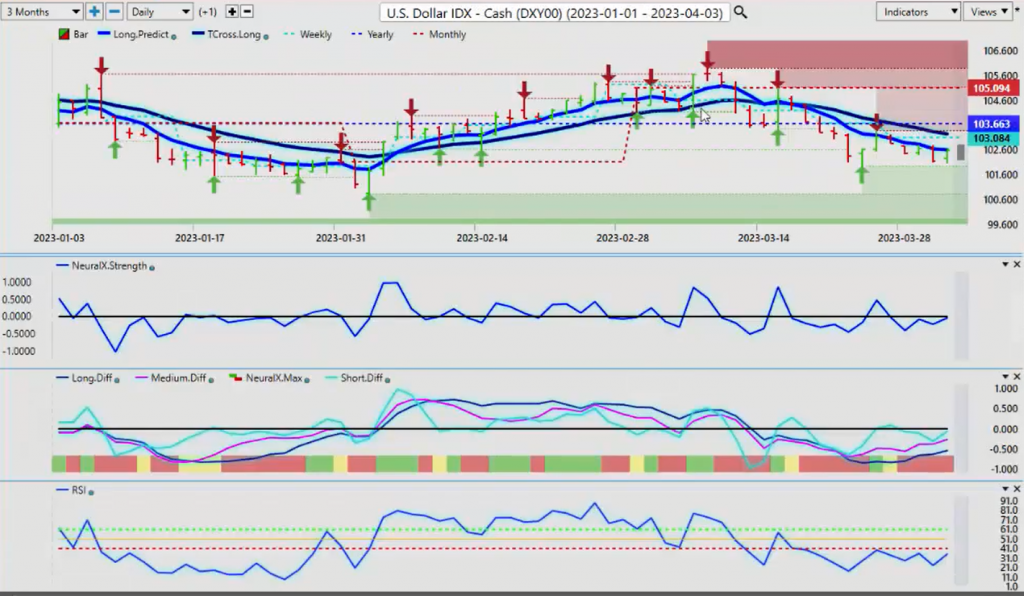
Now, when we look at the US dollar index going into next week, the dollar index, we’ve got a verified support low that’s coming in at 101.91. In most cases, the dollar strengthens, as I talked about last week, strengthens in the first week of the new month, just about every calendar month other than August and December. So we would be looking for some dollar strength. Now, our Neural Index strength is rising, our predicted differences are rising, and our predicted RSI is starting to turn back up. But my concern here that I’ve been very vocal about in the VantagePoint live training room is I question that last unemployment number because of the seasonal adjusted number, my view is that the US did not gain 300,000 jobs last month, but rather they lost 300,000. So if that’s true, then that could actually hurt the dollar.
But again, we’ll get the ADP report number next week, but we want to see what kind of has this number been leaked or is some of the institutional players, do they know what I know and they’re questioning those employment numbers from last month. If that’s the case, the dollar could see some weakness after that number. But again, right now the indicators and VantagePoint are warning as we come into a period of known dollar strength that we should see some kind of strength. We rallied up on Friday on the dollar index up to the VantagePoint long predicted at 102.60, but we need to clear the T cross long at 103.23. But my view is that the dollar will not have any kind of year in 2023. It had in 2022. I don’t think we’ll see that regardless, but we will still see dollar strength at certain times of the month.
Gold
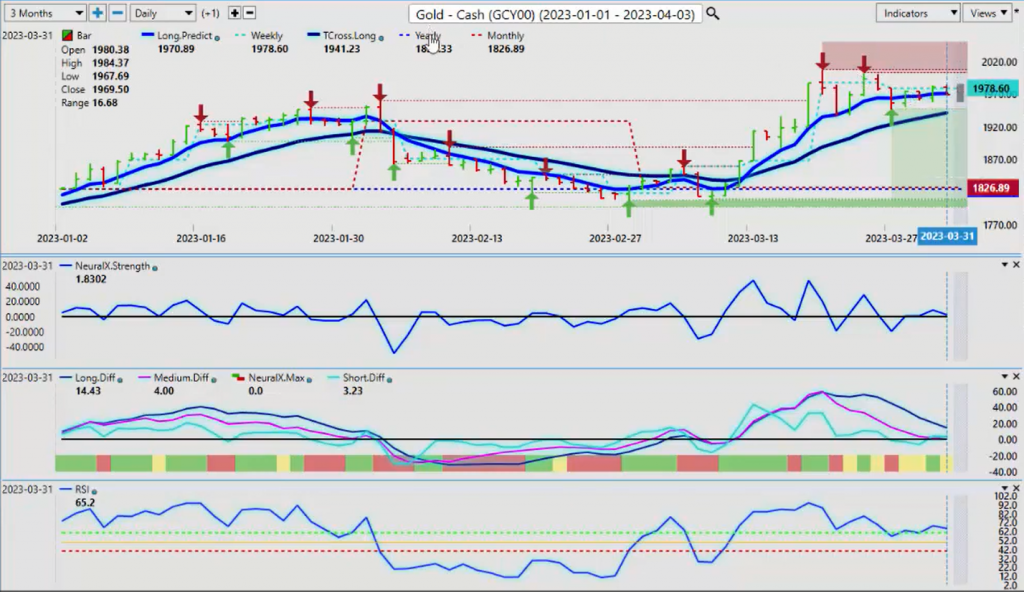
Now, when we look at gold in the comparative analysis to the dollar, gold stalling out up here, right around these verified zones, but more specifically the monthly opening price. So we’re going to be watching this one very closely as the monthly price resets on Monday. But again, gold is firmly up on the year, our yearly opening price, 18.24, excellent buying opportunities. Again, providing you’re using the proper calculation on your rolling performance. We don’t want to be looking back to March 27th or March 25th from a year ago because that paints a very different picture going into the previous year. We don’t want to drag the problems from 2022 into 2023. We want to look at it from the start of January the first, and we want to look at it to the end of the year on December 31st, and we measure quarterly performance.
So the quarterly performance here on gold is quite strong, but where we started the year back here in February, you can see that price has been consistently rising and we’ve had strong buying on a dip here. And I believe that if gold is going to struggle a little bit, it would be briefly at the beginning of April. And then in most cases, April’s a better month for gold. But again, we don’t want to look at that in 2022 in a rolling performance when the Fed was hiking at an unprecedented level. If anything, the Fed could end up cutting this year by September, October. But any hikes from here on out in my respectful opinion only are going to be very small. There’ll be no 50 basis points. There’ll be no three quarter basis point.
And remember what the Fed said at the beginning of 2022, that they were going to slowly hike and they would end the year somewhere just under 1%. He blew through 1%, I think, in the first two months of last year. So again, we don’t want to drag that type of rolling performance forward, particularly in 2023. We can maybe look at it again in 2024, but we’ve got to be mindful of this. So again, the MA dif cross the verified zones for me, we slid down here, but we’re holding support. So if gold is going to pull back this week, it’s likely going to be to the T cross long, 19.41, that’s the area I would look for. And then we will monitor it from there.
Bitcoin
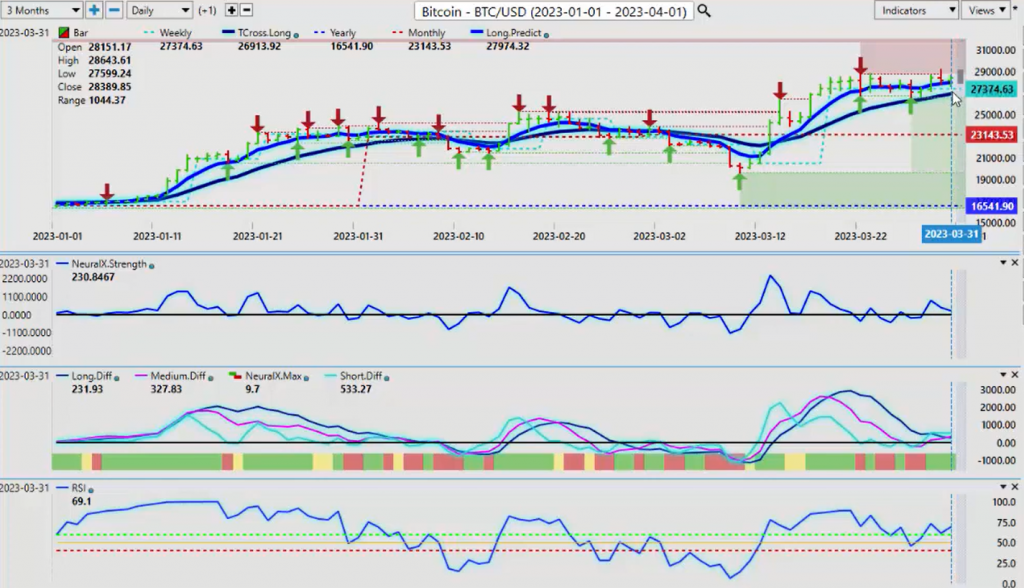
Now, Bitcoin, again, the top performer here. Every week I go and do this, I have to point this out to the even bigger gains. And you’ve got the pundits that are saying, well, Bitcoin’s a scam. I don’t personally get involved with a lot of digital currencies, but I do focus on Bitcoin. It’s at the top and ETH of course, but right now, Bitcoin would be poised for a retracement next week on some dollar strength is what I would expect. Right now, our T cross long income unit 26,913 firmly above our monthly and our yearly opening prices at 16.54.
And again, this is the advantage going back into early January, and again, we want to make sure that we’re looking at the first quarter and where the performance is. And you can see the Bitcoin is up close to 70%, 65% this year, one of the top trades. But these so-called gurus like your Warren Buffets and all that, they’re saying, don’t buy it. It’s a scam, blah, blah, blah. Bitcoin’s annualized returns, 230% annualized returns over the last 10 years. Why wouldn’t we buy it is the question. But again, another strong year for Bitcoin and that’s also helping out our major indexes.
But the indicators here are a little bit mixed. Our predicted differences very close to the zero line. In my respectful opinion only, I think that Bitcoin has shown that it can go up even when the dollar goes up. And Bitcoin recently had correlated very highly to gold, which I suspected and I talked about here months ago that I suspected that this was possible, that once the Fed has done this crazy rate hike cycle that he’s done, then they’re going to start looking outwardly for other places to invest other than US dollars. And obviously gold would be one, but Bitcoin I would argue, there’s been more money going into Bitcoin than into gold, but they’ve both been very good asset classes to be in. So for this coming week, I anticipate the T cross long will be tested at 26,913, and we can reassess once we get down into those if we get down into those levels. But I suspect we will.
Light Sweet Crude Oil
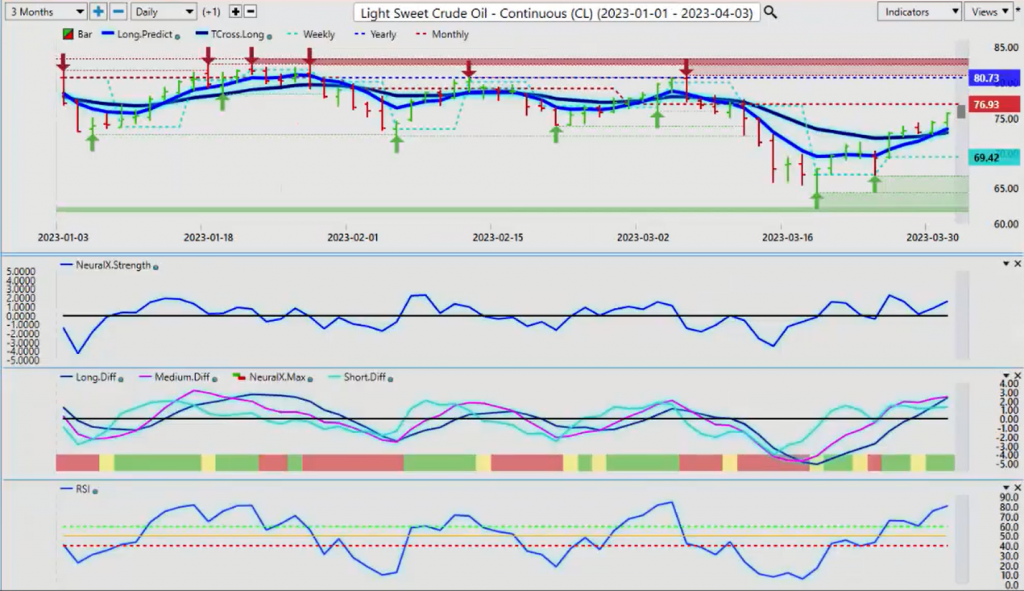
Light sweet crude oil again talked about in last week’s weekly outlook that we are starting to rise. Oil prices were a little overdone here to the downside. That MA diff cross is again a warning sign, one of the most powerful VantagePoint predicted indicators because it does two things. It tells us a new trend and it tells us, okay, we shouldn’t keep selling down here because the medium term trend is weakening against the longer term trend. That’s led to a significant rally. But again, oil prices need to clear 80.73, the yearly opening price. Oil is still indisputably negative on the year. Again, the last thing we want to be doing is using this type of rolling performance and going back to a year ago. It’s not specifically relevant guys. We use seasonal patterns for that not rolling performance. Again, it can be very, very misleading. And my only job here is to advise you of that using those SPYs and the S&P 500 is the perfect example. The amount of traders that got caught short on that is, it’s a little frightening.
But again, you’ve thrown everything we possibly can at the equity markets and they still didn’t turn negative on the year or their annualized returns again, over 6%. So this is helping oil to move higher, suggesting maybe we get a soft landing. We’ll continue to monitor this, but again, we need to clear our immediate target for oil is 80.73, and then I think we should be very cautious unless we can get above that level because as you can see for the last three months or the entire first quarter, anytime we get near the yearly opening price and try and turn positive on the year, oil immediately sells off. So I would still be looking for something like that potentially to occur given this price structure.
Euro versus U.S. Dollar
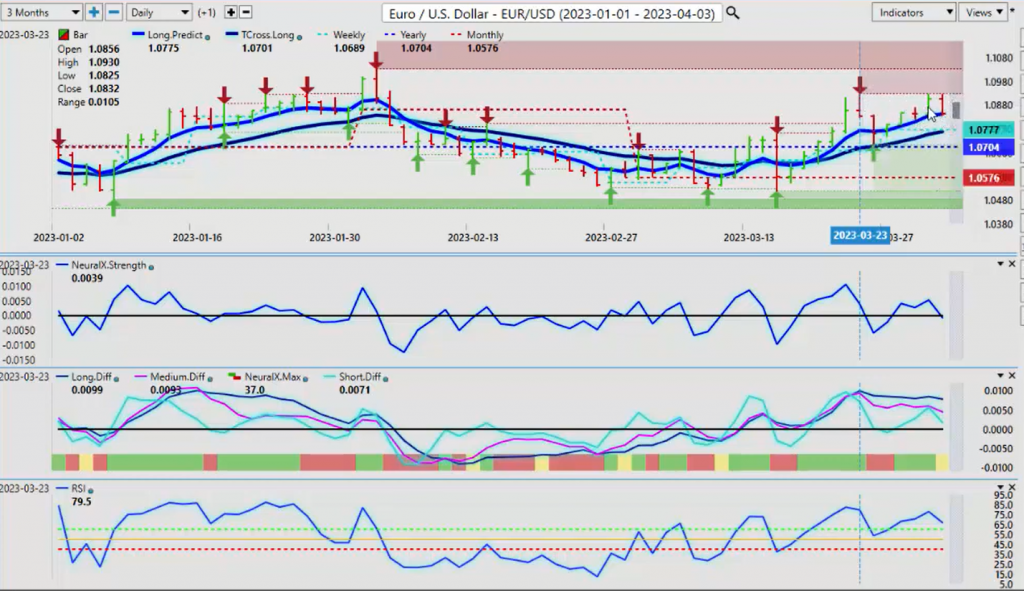
So when we look at some of our main forex payers here, which I’ll run through some of the main payers I think for next week, the euro got a bit of a boost this week on that inflation data, but it came back to an area that we are already well aware of on March the 23rd when VantagePoint identified a new verified resistance high at 10930. So we’ve come up this past week and hit that level to the exact number twice, but Friday’s was a big move down. Now that could be just profit taking, but the indicators from VantagePoint, the MA diff cross, the Neural Index strength, the predicted RSI sloping down. All of this is telling, and now our Neural Index has turned from green to yellow. Yellow is cautionary.
So again, regardless of what your opinion is on the US dollar, whether you’re a bull or whether you’re a bear, there is a period where institutional money must buy US dollars. They don’t have a choice, and that’s usually around that first week of the new month, as I’ve talked about on here for years. So I would still expect them to have to buy dollars to settle trade balances, fund government programs, pensions, employees, they need those dollars. And then once they’re done buying them, the dollar usually sells off just like it did in the month of March, which I forewarn that the dollar is strong in the first week, and then it usually sells off the week after the non-farm payroll number.
So I would be looking for the exact same thing to repeat itself again this coming month because that’s what it does. So you can actually time it almost to the exact day. So we would expect gold to be a little soft next week, Bitcoin, equities, maybe oil two as we get into some dollar strength. And then for that to dissipate the following week.
So right now with the euro would be the number one currency affected by any kind of move in the dollar index. If it moves up, the Euro US pair moves down. So right now for next week, I would anticipate a retest of the T cross long at 107.70. If we break down below that, then we would be looking for a potentially bigger move down. But that would likely be, again, in my respectful opinion only it would be a short term move. A retest of the yearly opening price at 10704 could likely very much be in the cards. Be careful of a false break above 10930. Guys be very, very cautious on that.
U.S. Dollar versus Swiss Franc
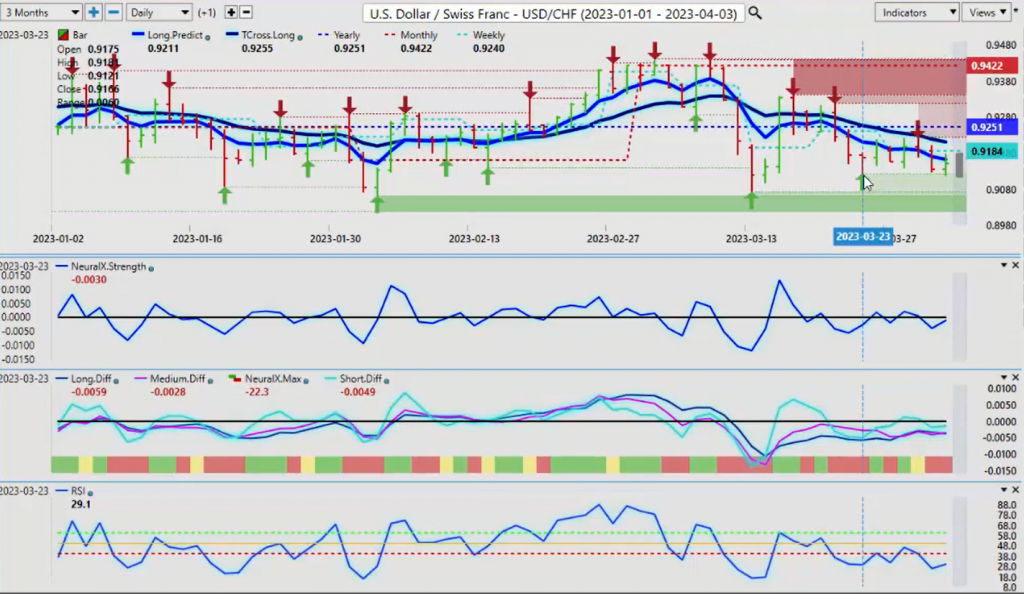
So if we are looking for places of value to buy dollars, then the US Swiss franc points comes up here. We’ve got good verified support low that’s coming in at 91.21 and even stronger support at 90.72. For the dollar to really tank, we’ve got a breakdown below these two verified support points where you can see all this green level. But for now, I think there’s a slight advantage to buying this one. The VantagePoint indicators are slowly trying to turn back up the Neural Index strength, the predicted differences crossed to the upside, and we’re looking for some recovery from that predicted RSI.
British Pound versus U.S. Dollar
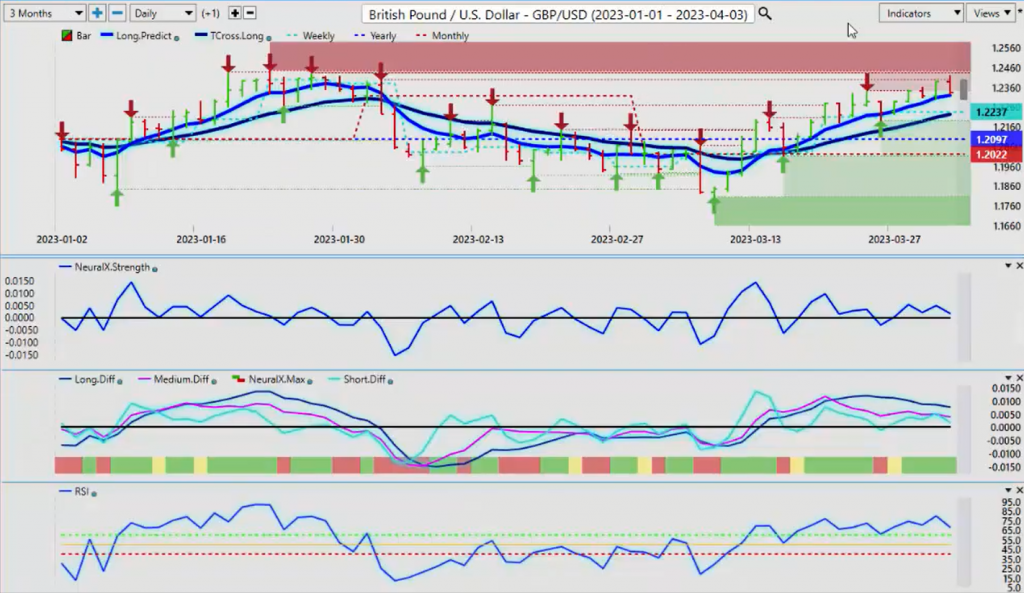
Now, the pound dollar, once again, it’s made its move, but we’re coming basically right back up to where we were. Now we have cleared the yearly opening price at 120.97, the monthly at 122, and even the weekly at 122.37. But then on Friday, we really ran out of buyers up here at these verified zones at these highs. So for the pound to really extend guys, we’ve got a breakthrough, 124.50 and stay above it. Get out of this channel. You can see this is a broader channel that’s been in play basically the entire calendar year.
January, we moved up, we came back down, we made some new lows, and now we’re extending right back up to where we’ve been. So we must break through these levels and the VantagePoint indicators are not endorsing that at this particular time. The Neural Index strength pointing down, predicted differences crossed back here, they’re starting to move lower, predicted RSI starting to slide lower again.
So again, this is the kind of thing we want to look for in our trading and saying, okay, is this really a buy up here? Well, I think we need to let it come back a little bit first. I believe that we’ll be a strong buy this year, but we’re got to come back to 12222 to begin with, and then we can reassess. As again, as long as we’re holding above the yearly opening price, this pair is positive on the year the euro is currently positive on the year, the dollar index, not so much. So again, these are the kind of things we want to make sure we’re, we’re monitoring.
U.S. Dollar versus Japanese Yen
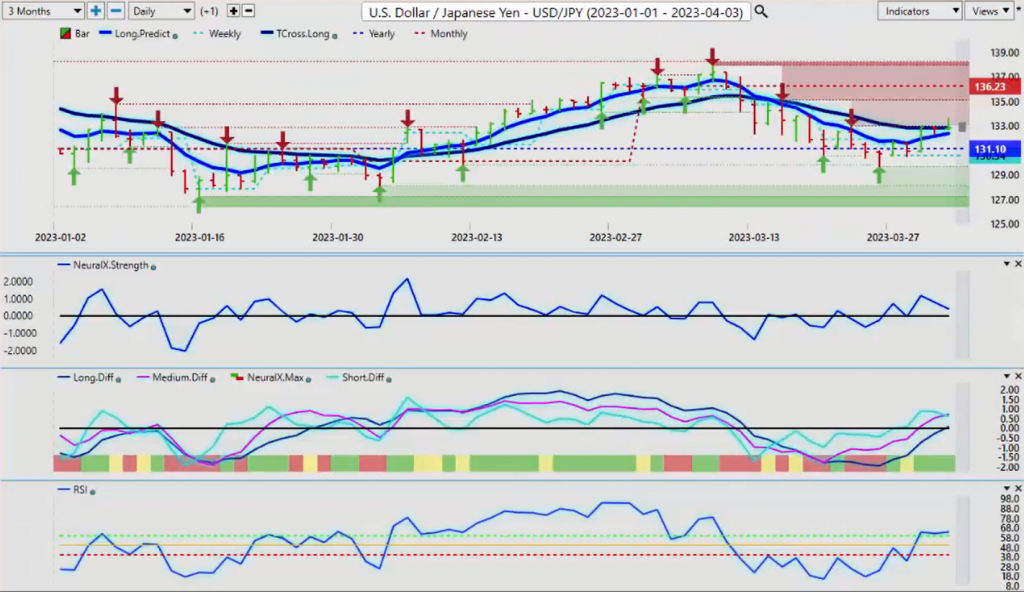
Now, we did see some very good buying the yen, the yen weakening from the risk off from the banks. Things are settling down with the banks, the stock market moving higher. So obviously that doesn’t favor the yen. The dollar’s made a pretty substantial gain. But again, you can see where these gains are coming from off that yearly opening price, providing you’re calculating the annual price properly on January the first, not going back to March 27th, ’22 using a rolling calculation. That’s a lagging indicator, a lagging tool, especially again in 2022. I’m going to keep reinforcing that point that 2022 was an unprecedented year on interest rate hikes. And even that, even if we stay higher for longer, they’re still coming back into the carry trade.
So right now we’re at the VantagePoint, T cross long 132.83. I would look for a potential pullback on Monday, and then the dollar yen to go higher on Tuesday. This is usually what I see with this pair. But the indicators here were above 60 on the predicted RSI. Our predicted short, medium, and long-term differences are all pointing higher. Neural Index good. That’s a little bit of a concern for me with that slope of that Neural Index strength. But as long as we stay above the zero line, things look pretty good. But we do want to make a clean break of 132.83 before we get aggressively long on this particular pair.
U.S. Dollar versus Canadian Dollar
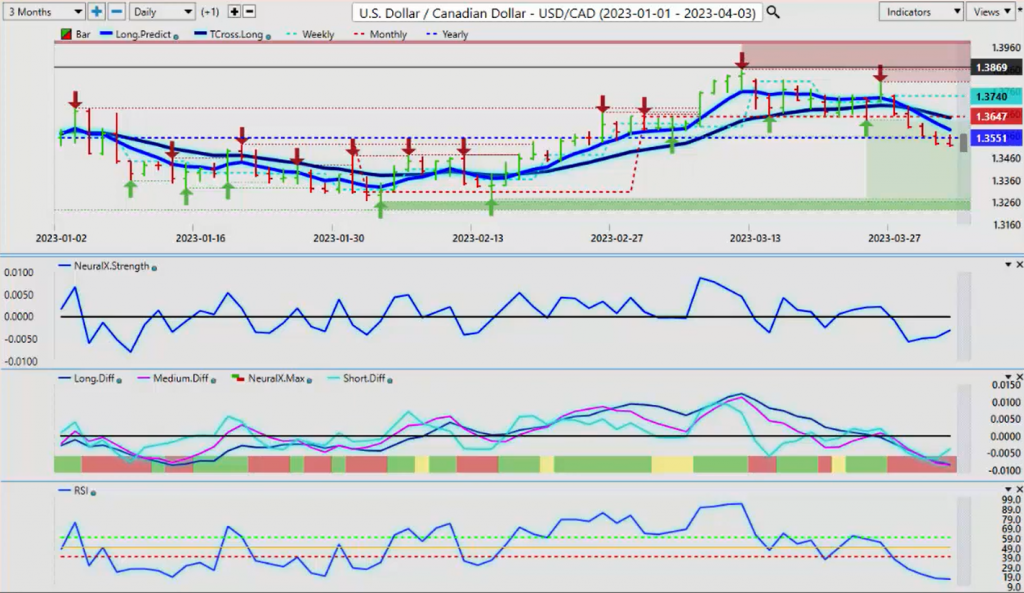
Now, the US Canada responding to the equity markets and responding obviously to oil prices, but just remember guys, light sweet crude oil is not turned positive on the year. So be cautious of a bear trap down here. The CPI number coming out of Canada is still pretty hot last week, the inflation data there, but the Bank of Canada’s not hiking. They’ve pretty much made that clear. So 135.51, our yearly opening price is the one we’ve got to be careful of. And this is where the Neural Index strength is a very interesting indicator. It’s starting to move in the opposite direction, again, of what the market’s moving in. And that’s true divergence that we’re looking for on a very, very powerful tool that takes the correlation of 31 other markets when it’s forecasted.
So this is showing internal potential weakness in some of those 31 markets is what the Neural Index strength is picking up on. So we’ll keep an eye on this one right now, but in order to get short US Canada, we really need to stay below 135.51, and we need to get those oil prices above $80 a barrel and holding above that for a bigger move. But right now, it does look bearish, well below the T cross long at 136.42.
Australian Dollar versus U.S. Dollar
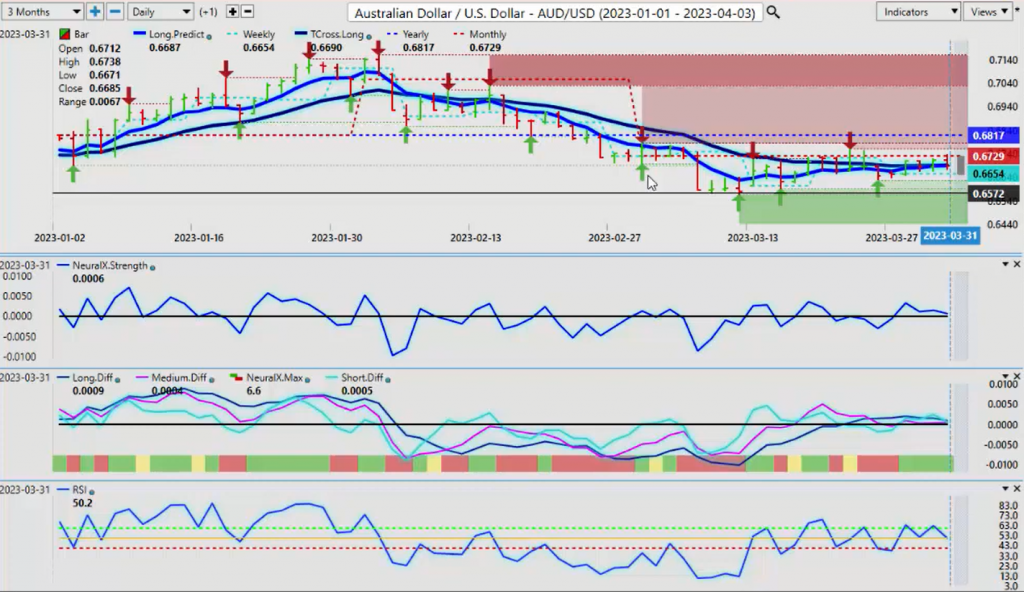
Now the same as the Aussie and the Kiwi, they correlate very highly to the Canadian dollar. They respond very well to these rising stock markets. So right now we’re hitting into this into the monthly opening price, finishing the month here. But the Aussie really has not done well in 2023, and that’s evident by using the annualized returns, starting from January rolling returns, but from January 1st, not from March 23rd. So again, we want to keep our price current. We don’t want to bring in lagging tools, misleading lagging tools that can throw us off what real price is doing.
But again, we’ve got 68.17. My view is that the Aussie will overtake this level in the weeks and months ahead, but I don’t think it’s going to be this coming week. So right now, the VP indicators are very, very mixed on this. We don’t have momentum on the predicted RSI. We’re looking for a break of the 60 level or a break of the 40 level. I’m not interested in trading overbought, oversold here, guys. I’m interested in trading momentum. This is the type of market we’re in 2023. So again, I’ll watch it closely, but we’ve got to get moving.
New Zealand Dollar versus U.S. Dollar
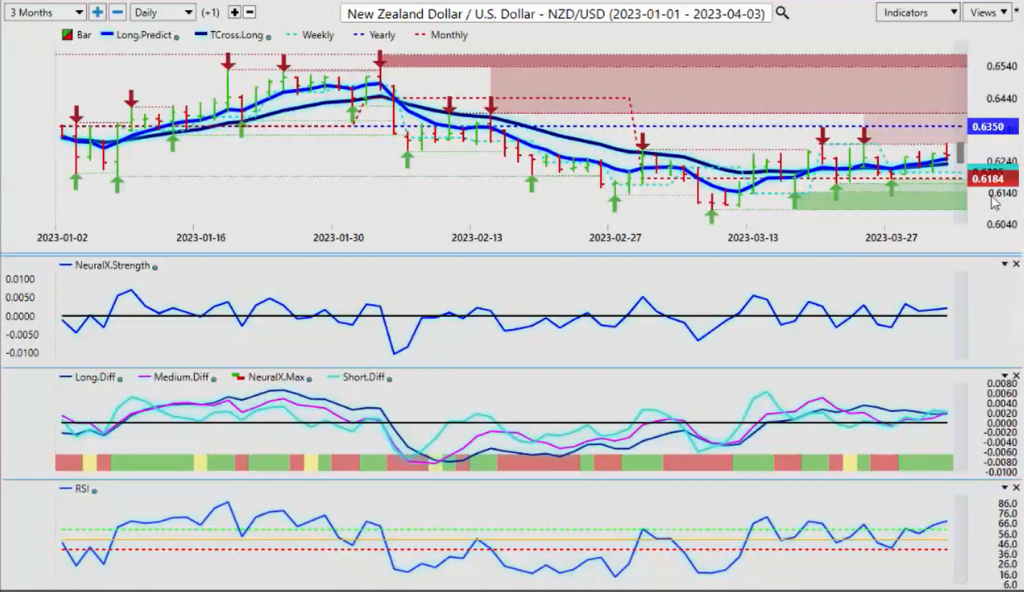
The same thing would apply to the Kiwi. It looks a little better, definitely. We’ve got above our monthly opening price. That’s a positive sign. We’re trying to extend higher. But I think there’s going to be, again, if we’re going to be looking at getting long on these pairs, then I think we have to get through the first week of April 1st. That would be my advice or my warning sign that either way, we’re anticipating some dollar strength next week based on previous seasonal patterns on a month to month pattern and this dollar cycle that I’ve repeatedly talked about. So with that said, this is the VantagePoint AI market outlook for the week of April 3, 2023.


