


Welcome to the Artificial Intelligence Outlook for Forex trading.
VIDEO TRANSCRIPT
Hello, everyone. And welcome back. My name is Greg Firman, and this is the VantagePoint AI Market Outlook for the week of April 25, 2022.
U.S. Dollar Index ($IDX)
Now to get started this week, we’re going to begin where we always do with that very important U.S. Dollar Index. Now, the dollar on a real tear, had a very significant pullback on Thursday. Now, this is a normal condition that we discuss in the VantagePoint Live Training Room about Thursday profit-taking. So the dollar holding above its yearly opening price, holding above its weekly opening price. But on Thursday, all the people that are along the dollar from Monday through till Friday, or Thursday, excuse me, they then close those trades out because they don’t want to hold the positions over the weekend with the volatility, with the Russia-Ukraine war, et cetera.
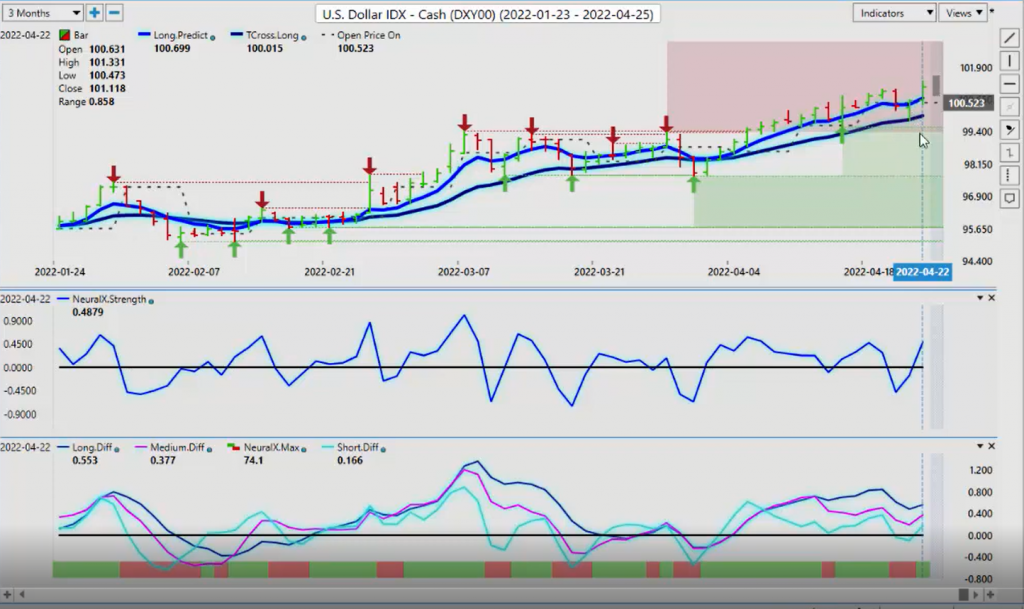
So we see that we’ve had a substantial pullback on the Thursday with profit-taking, hitting that T cross long at 99.86 to the number, and then having a significant rally back up on Friday. So we’re starting the week rather bullish for the dollar, but the dollar, in my respectful opinion only, is a little overdone here on looking at the past seasonal patterns. The dollar up, I think 2.8% on the month. That’s a lofty level. When we look at this over the three-year period, we can see heavy congested resistance up here that the dollar is trying to break through up around the 131 area. I’ll respectfully submit that’s the level. If we can break through 101.40, then that would open up the door to a slightly higher level, around 102.53. But I think it’ll be a very tall order for the dollar to continue with these moves.
Now, a lot of these moves too are coming with that rhetoric out of the Fed, out of the different Fed chairs, like Bullard, and [inaudible 00:01:55], all these other ones keep talking up the dollar. So again, that’s helping things, but the question remains are they going to continue this bullish rhetoric going forward while staring down the barrel of forcing a potential recession? So again, it will be very interesting to see how this one plays out.
But to begin the week, we’re bullish on our main indicators, our Neural Index, our Neural Index Strength. Our predicted differences are all above the zero line. We’re holding above our long predicted at 100.69. Again, I’ll submit that that would be, if you’re going to continue long on the Dollar Index, that would be the level to watch. That pretty much matches the VantagePoint predicted low at 100.79 for Monday. So that would be the area to watch on the dollar to see if we can hold, but all stops should be below our T cross long at the 100 level.
Gold
Now, with this added dollar strength, that obviously is putting pressure on gold. It’s putting downward pressure on the S&P 500. So we can see gold making a push lower here on that rising yields from the U.S., but just this chatter from the different Fed members talking about three-quarters of a basis hike, 50 basis-point hike. Remember, it wasn’t that many years ago that the Fed ended up with pie in his face when they were saying the same thing, and then they had to put the brakes on. Not only did they have to put the brakes on, then they had to turn around and start cutting. So it will be interesting to see at the next FOMC meeting what the Fed chair is really going to say when he’s hit with some hard questions.
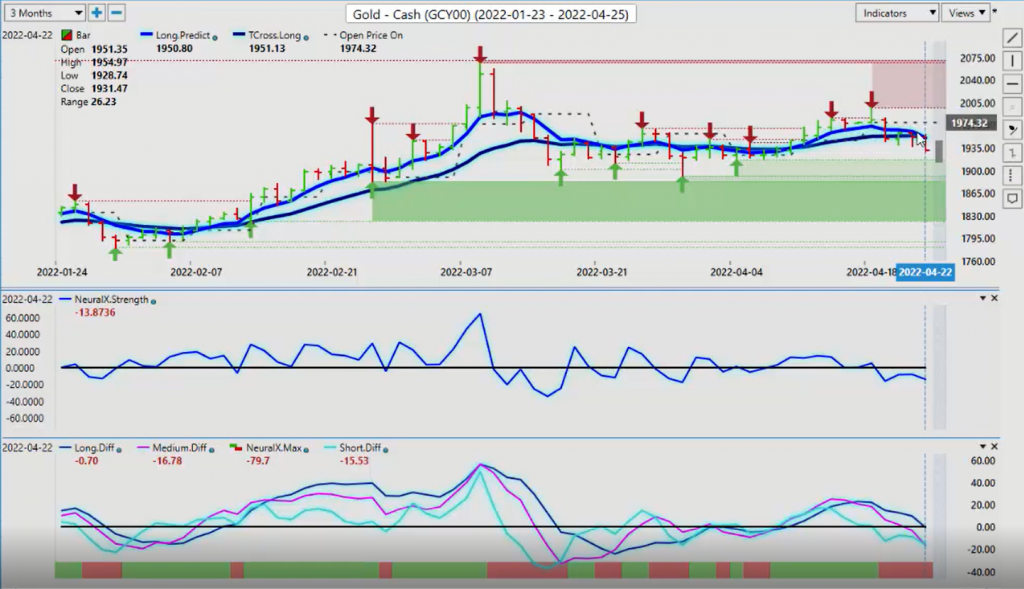
But for now, gold still has some very heavy verified support at 1916, our Neural index, our predicted differences. But once again, as I’ve discussed in here the other week, this MA diff cross is our medium term crossing over our long-term trend. And that long-term trend, obviously in the month, at least in 2022 is up. So the MA diff crosses, and then you can see that gold stalls up here, makes one big push to the upside on the 18th, and then down it goes. This is a common thing I see. But again, I think it will be hard for gold to break under 1916 without some additional help from the Fed. But to begin the week, we would be looking for more downside with our key pivot level, our T cross long at 1951 followed by 1950 on the long predicted.
S&P 500 Index
Now, when we look at this in relationship to the S&P 500, now the S&P 500 having a brutal day on Friday. But again, is that a bit of profit-taking? Are we getting close to an end to this? That will obviously be determined somewhat by the Fed, by what happens with the Russia-Ukraine war. But that’s a big push in thin illiquid markets in a holiday short week. We all know that not too many of us want to hold longs on the S&P 500 going into the weekend because we don’t know what to expect over the course of the weekend with Putin and everything else. But they’re more likely to come back into longs on late Monday or midday Tuesday.
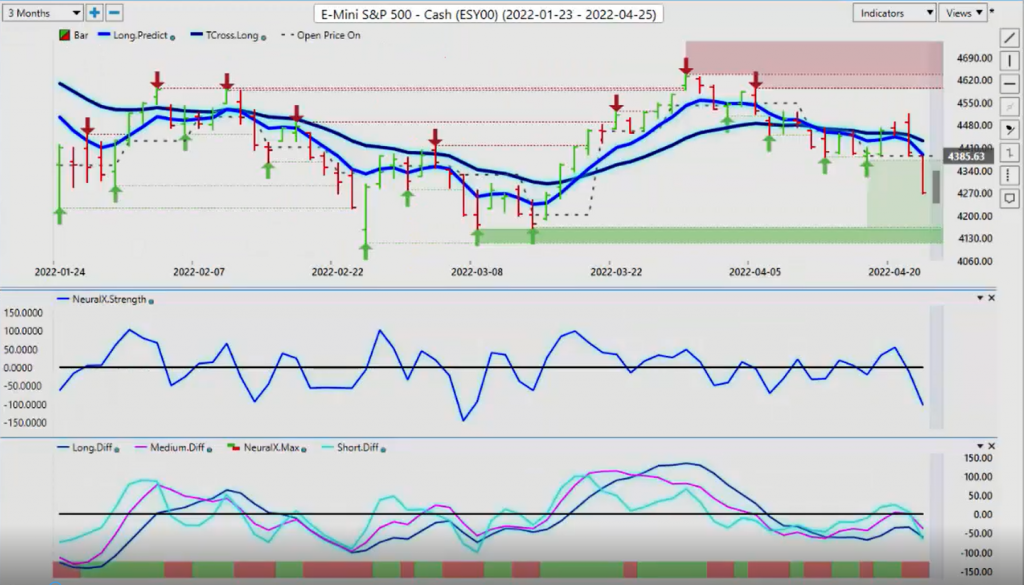
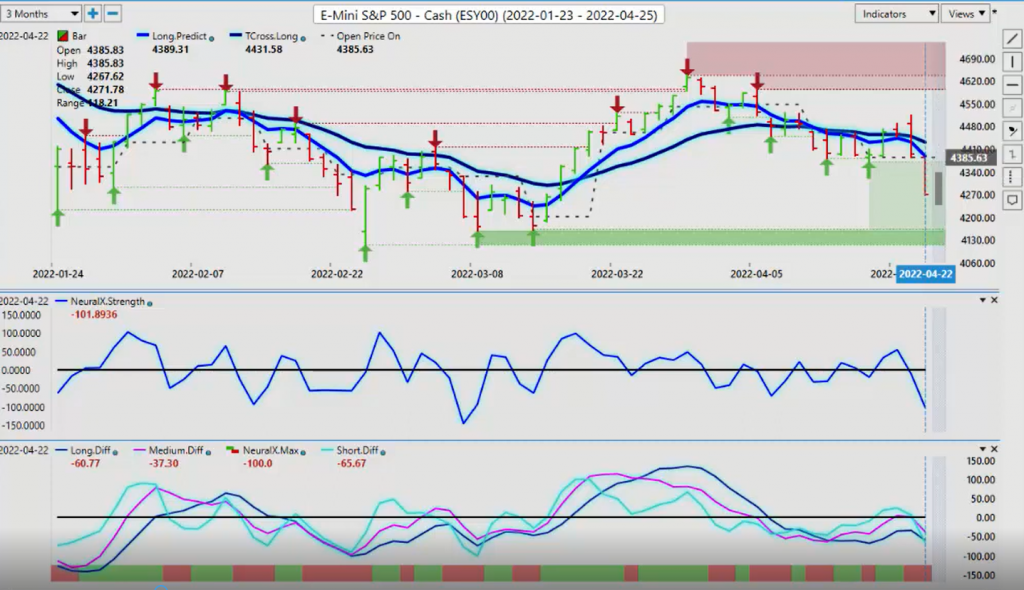
So we do have some very strong verified support down here, but it’s quite a ways down. That low is at 40, sitting down around 4161. Our Neural Index is down. Predicted differences are down. So it does look like we’ve got further downside here. But the long predicted 4389, in my respectful opinion, using the VantagePoint software this many years as I’ve been using it, the market like a moth to a flame always wants to retrace to a point that very seldomly has something to do with Fibonacci. It’s this predicted moving average. It literally is like a moth to a flame. The further it moves away from it, the more likely it is it’s going to go back to it. So if you are a seller, our predicted high is 4335, but I would be holding out for the long predicted at 4389 because, again, I think that this move is a little overdone in holiday-thin illiquid markets.
Bitcoin
Now, with the stock market falling like that, we’re also going to see Bitcoin coming under additional pressure. Clearly, it’s following the NASDAQ and the S&P 500, but it’s not as weak necessarily as what the stocks are. We’re closing at 39,614 with a heavy verified support low at 38,694. So any turnaround in the S&P 500 and the NASDAQ will see an immediate turnaround in Bitcoin. So that’s what we would be watching for.
And again, I believe we were leaning that way until we started to move into Thursday and Friday. And as you can see, the market came up to the VantagePoint T cross long 41,808, banging into that, a false move there. That’s why we always look at the close in relationship to the predicted-moving average. That’s critical here because, again, we can go above it, but we didn’t close above it. So again, a fake move higher, and then the sellers come back out on Friday, drive it down. But again, good verified support low down at that 38,694. Additional verified support low at 37,608. I’d be a little bit surprised if we get down there. But if we can get the S&P and the NASDAQ turning around, then remember the basis of intermarket and technical analysis is that it’s not just one trade. If stocks go higher, dollar will likely go lower, gold could maybe turn around a little bit, but we would see Bitcoin follow that up.
Crude Oil
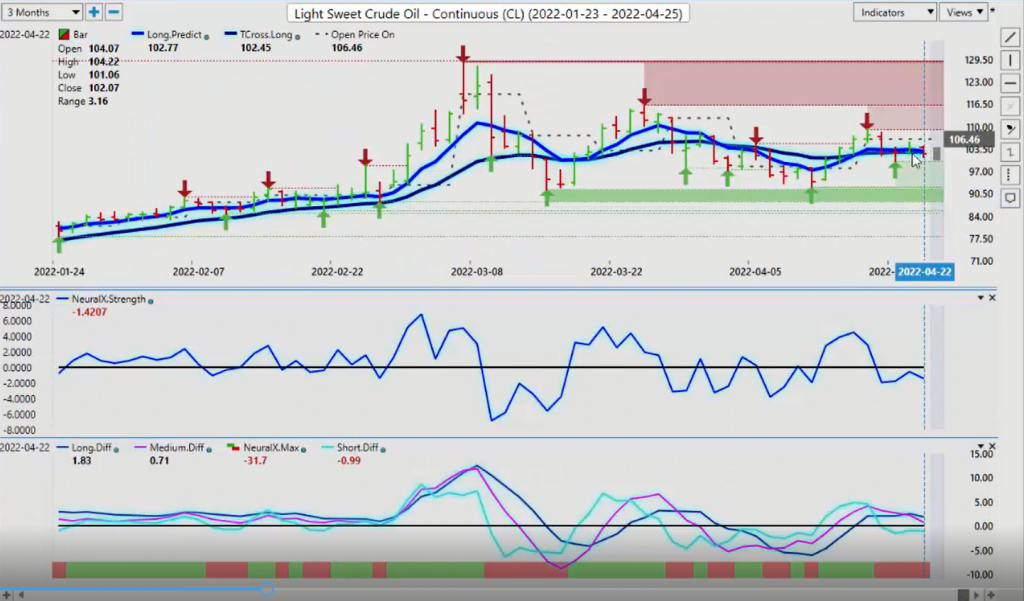
Light sweet crude going into next week, again more choppiness. But as we were talking in last week’s Weekly Outlook, we’ve got these verified zones up here. And something as simple as the weekly opening price, which is a fantastic non-indicator, the market could not hold above, the market meaning light sweet crude oil, could not hold above its weekly opening price. And you can see right off the bat that Tuesday it just gets hammered, Wednesday it’s down again, gets a little bit of relief on Thursday, then back down again.
So right now, we have an MA diff cross which is warning of a bigger move down. That is consistent with the Neural Index and the Neural Index Strength, pointing down and below the zero line. And we’ve closed on top of all that, we’re closing below 102.45. So 102.45 is the hotbed to start the week. So watch out for a fake price on Monday. And by midday Tuesday, we should see the real price on oil and whether it can actually advance or if it’s getting ready for a bigger move to the downside.
Euro versus U.S. Dollar
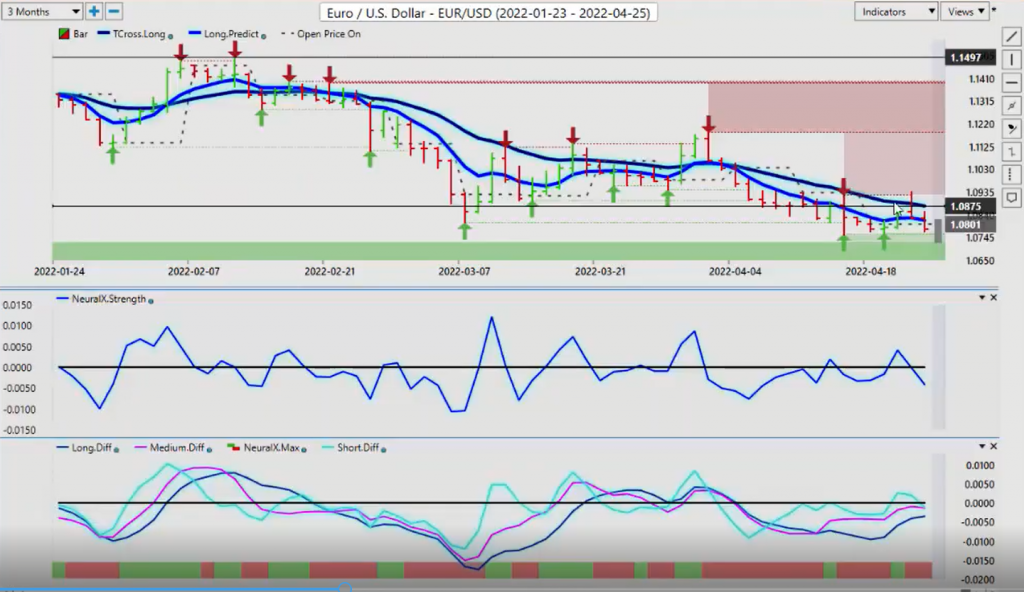
Now as we look at some of our main Forex pairs going into next week, no shortage of volatility in the Foreign Exchange Market that’s for sure. Now, the Euro, this is very significant support down here that goes down to about the one, I would argue even maybe a touch lower, maybe 107.20, 107.10. But 107.58 is still a very strong verified support low. That would also equate to a seasonality of a monthly extension down into that percentage level of over 2% down on the month. So as we move towards the end of the month, it would not surprise me if the Euro sees a bit of a recovery here.
Now, our T cross long, that’s coming in at 108.75. But you can see that we’ve already challenged that level on Thursday. But then the sellers came back in on Friday. So that’s possible. It’s just a bit of profit- taking because we did close below this. The yearly opening price is clearly down, but there is good two-way action on this pair, both buying and selling. But sellers for now at least are clearly in control. But again, if we close above our long predicted at 108.17 and we close above our T cross long at 108.75, that would take the immediate downward pressure off of the Euro.
But for the bears, however, the real possibility is we could still see a move down into this 106 level. That cannot be ruled out. But that verified support low 107.22, that’s the one to really keep your eye on with this particular pair, assuming we can even get down there and we don’t get a significant bounce to the upside first. But again, down there we would be seriously looking at longs, down around that particular level provided it’s supported by the core VantagePoint indicators, which right now longs are not supported.
U.S. Dollar versus Swiss Franc
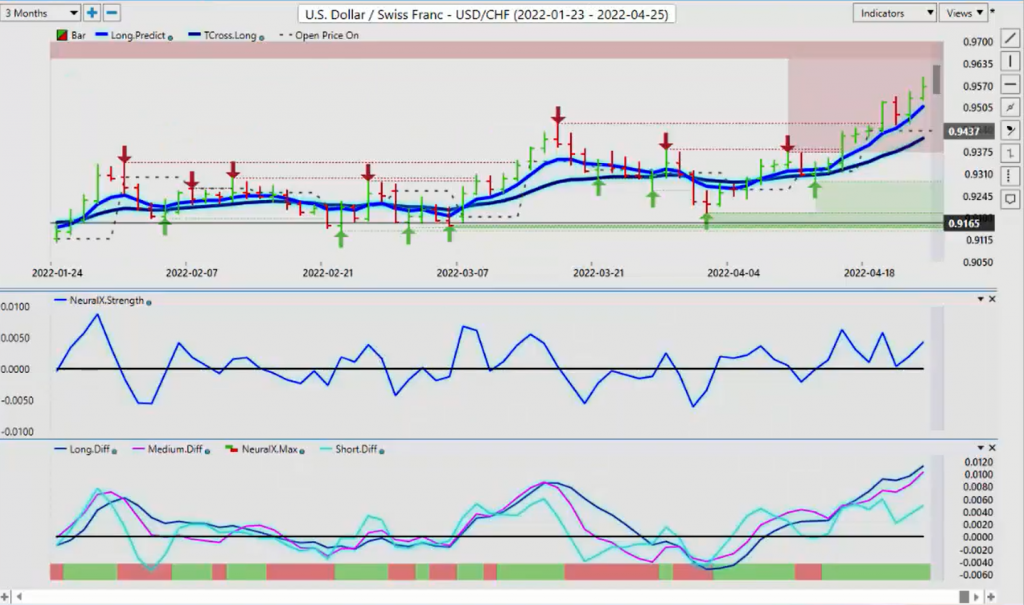
Now, with the U.S./Swiss franc, also a little bit overdone here. We will be getting into some very significant resistance on this pair also. You can see just literally a wall of it up here around this .94 area. Now, the market’s broken through that level. So we would start to look more towards the .9553 to see if we can push above that. But again, it’s going to be a tough order here. The only thing that’s really going to help the U.S. dollar is the diversions between the Swiss National Bank and the FOMC. Obviously, one has no intention of hiking anytime soon, but the FOMC is hike, hike, hike, right? So longs on U.S./Swiss franc, or just like the dollar/yen, that is by definition the carry trade.
But when the carry trade comes unwound, it can come unwound very, very quickly, right? And it could take just one or two comments from Jay Powell to send the dollar the other way. If the U.S. dollar starts getting too strong, then not too many countries like a strong currency because that hurts their exports, right? So again, helps their imports, but the exports, who wants to buy it if the currency is that strong? So again, we’ll monitor this pair. But it will likely have somewhat limited upside from here. And my argument would be, once again, is that moth to a flame ideology that the further we move away from the T cross long at .9414, the more likely it is, if nothing else, we are going to retrace to it.
British Pound versus U.S. Dollar
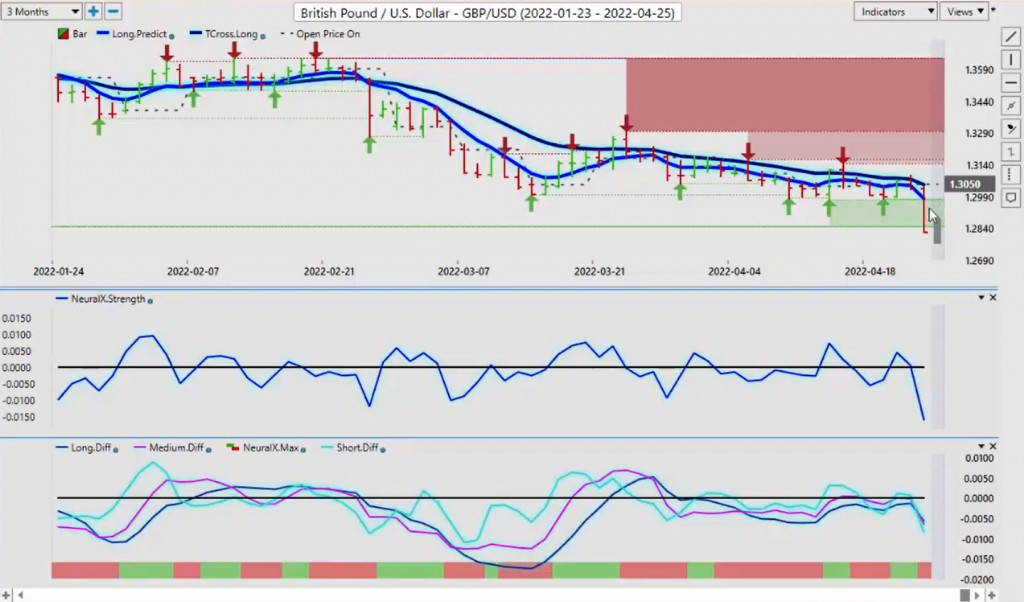
Now, the pound breaking down on Friday. But again, every time I have seen a bar like this, there has been very little follow through. You can see this over here. The last time we had this was February the 24th. For another week, the pound/dollar never extended past that low. So right now, we’ve got a low on the pound/ dollar coming in at 1.0822. We took out a very significant support zone, but we did it in thin illiquid markets on a Friday. So the question remains now is this a bear trap down here? We can’t rule that out, guys. Okay?
So whenever I see that, I like to back this out in the VP software to find where these other verified zones are. And I’m going to have to go back a few years to find that. So it doesn’t take me too long to get it though, 1.2675. We’ve got another big one there, which is at 1.2899. We’re trying to push down below that right now. But again, you can see a cluster of verified support zones between the 1.2850 and about the 1.2687. So if we’re going to get a bounce on the pound/dollar, that’s likely where it’s going to be. It would be my prediction.
So again, we need the indicators from VantagePoint turning back over to the positive side, an MA diff cross to the upside, Neural Index, Neural Index Strength breaking above the zero line. We don’t have any of that right now. But again, the push down on this bar was rather excessive. But I will point out we did get a warning from that. Once again, on Thursday, we banged right into the T cross long at 1.3072. And then on Friday, we were sitting there, we moved up a little bit on Friday, kissed that T cross long at 1.3046 and, boom, down it went. Now, that was triggered by the Bank of England’s comments, and I think it was the sales, that retail sales came out of the UK weren’t great.
So again, that data is just noise, guys. That’s all it is. So we’ll monitor this going into next week, but be very cautious with shorts down here.
U.S. Dollar versus Japanese Yen
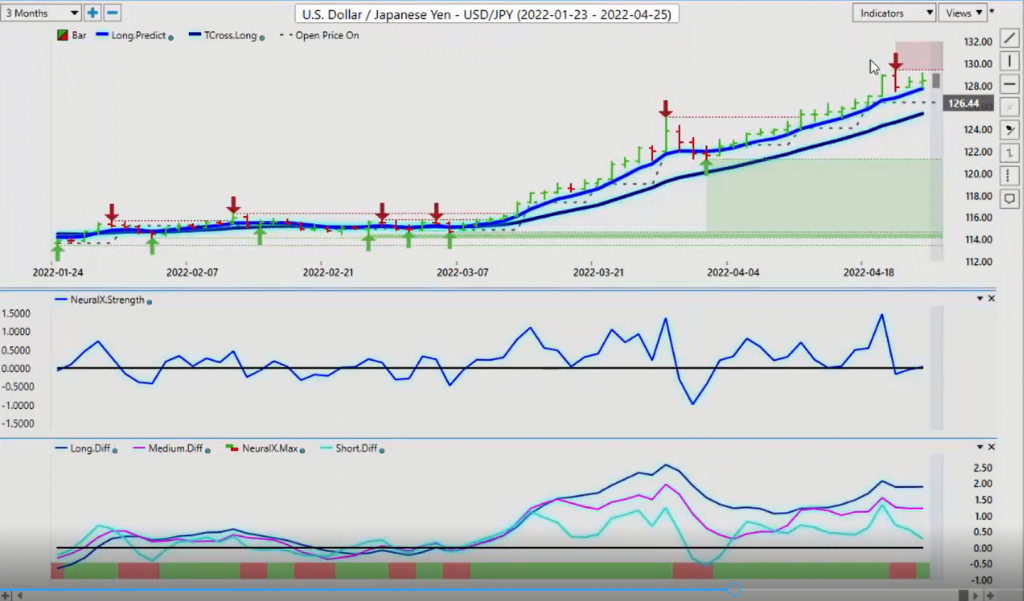
Now, the dollar/yen. A lot of chatter going on at the Bank of Japan is going to step back in because they feel they may have shot themselves in the foot because remember, they’re still in the bond buying programs, subzero interest rates, not raising rates. Now they’re getting inflation. They’re getting all these things. So there’s a lot of chatter. Be very careful with this pair going into next week. We’ve got a verified resistance high that has recently formed at 129.40. If we can’t get above 129.40 this coming week, then the dollar/yen could be getting ready to slide.
So keep a very close eye on that. The indicators right now on VantagePoint, the Neural Index Strength is still positive, but it’s under a little bit of pressure. So we’ll watch that resistance zone to see where that’s going to shake out. But for now, depending on the Bank of Japan’s next move, this pair could be getting ready for either a bigger move to the upside based on the Fed or Bank of Japan intervenes and kills it and knocks it down. Now, because this is going up, it looks like a cliff. Always remember, what’s at the top of a cliff? A big drop down. So again, watch the 129.40 very closely.
U.S. Dollar versus Canadian Dollar
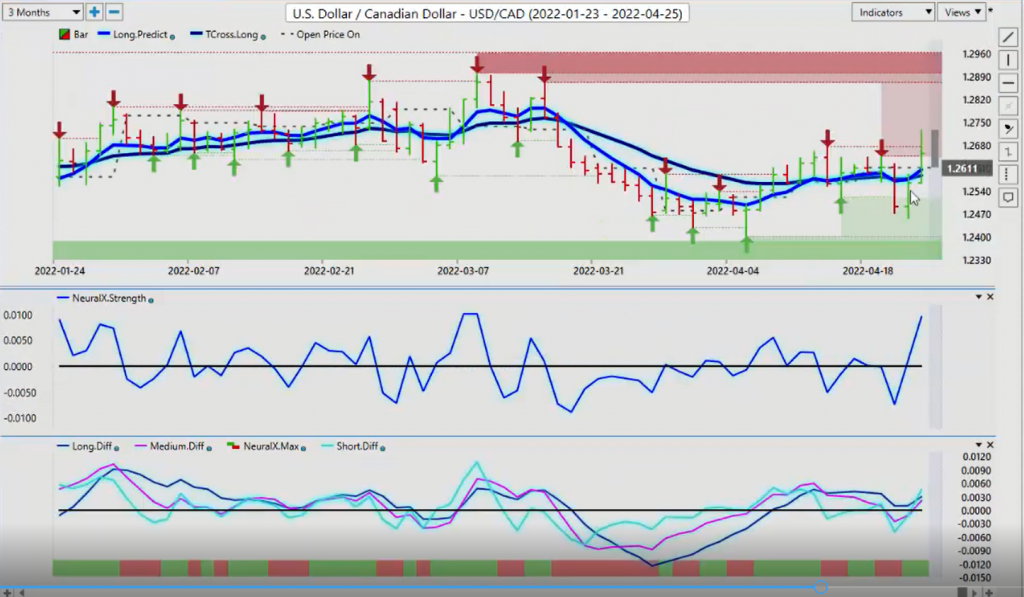
Now, the U.S.Canada, once again it goes to show you that hiking rates doesn’t necessarily mean it’s a positive for the currency. Now, if commodities back off and stocks fall, the Canadian dollar responds to those intermarket correlations. In my respectful opinion, it’s not just oil here. It’s the S&P 500, as the S&P took a big hit this past week, or on Friday. Again, if we look at the size of this down bar on Friday and then we do a relative comparison to the S&P 500, then we see something very, very similar here. You see that great big bar down? This is the basis of intermarket technical analysis. One market goes down, it directly impacts the other.
That’s exactly what happened to the Canadian dollar. Even though oil prices were still fairly strong, they weren’t overly strong is what I showed. And then the sell-off and the S&P was the catalyst to set off the U.S./Canada buyers, and they just bailed out of there. We discussed this in the VP Live Room, and with my own direct clients I had mentioned this multiple times, do not short underneath that 1.25 level. It’s very, very dangerous.
So once again, when we look at the U.S./Cad going into next week, it could be a little bit of profit-taking. But here’s the deal, guys. If the S&P 500 turns around, then U.S./Canada will start moving back down again. We have a verified high 1.2676. We went above that, but we did not close above it. So keep a close eye on that. But the predicted differences, our Neural Index Strength, we’re above our T cross long 1.2587.
1.2605, that’s the area I would look for potential longs to start the week because it directly matches our VantagePoint predicted low at 1.2615. So either way, we’re looking for a move back towards this particular level, and we can make the decision at that particular time if we want to buy it, or we can straddle this thing and put sell orders just below 1.2587 and pick up a sell, assuming that this is a false break and the S&P 500 is going to turn around.
Australian Dollar versus U.S. Dollar
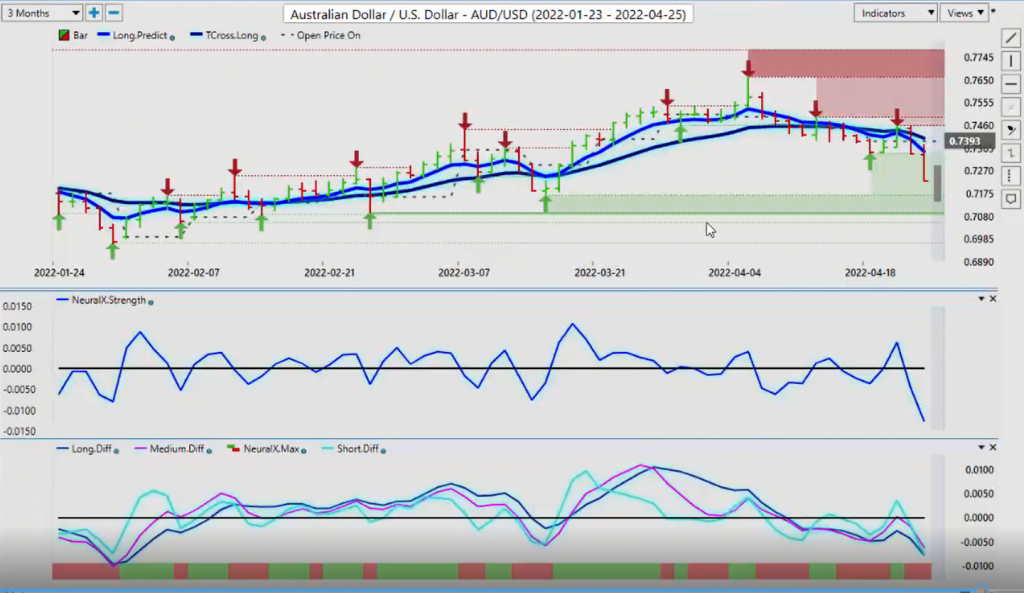
The exact same thing for next week, guys, would apply to Aussie/U.S. and New Zealand/U.S. They’re taking a hit from the stock market. You can see when the S&P 500 crashed, Aussie responded to that. But this was a double hit for the Aussie, the CAD, and the New Zealand because remember, we also had gold contracts taking a hit on Friday on that dollar strength. So between gold going lower and the S&P 500 going lower, that was simply too much for the CAD and the Aussie and the New Zealand for them to defend themselves.
New Zealand Dollar versus U.S. Dollar
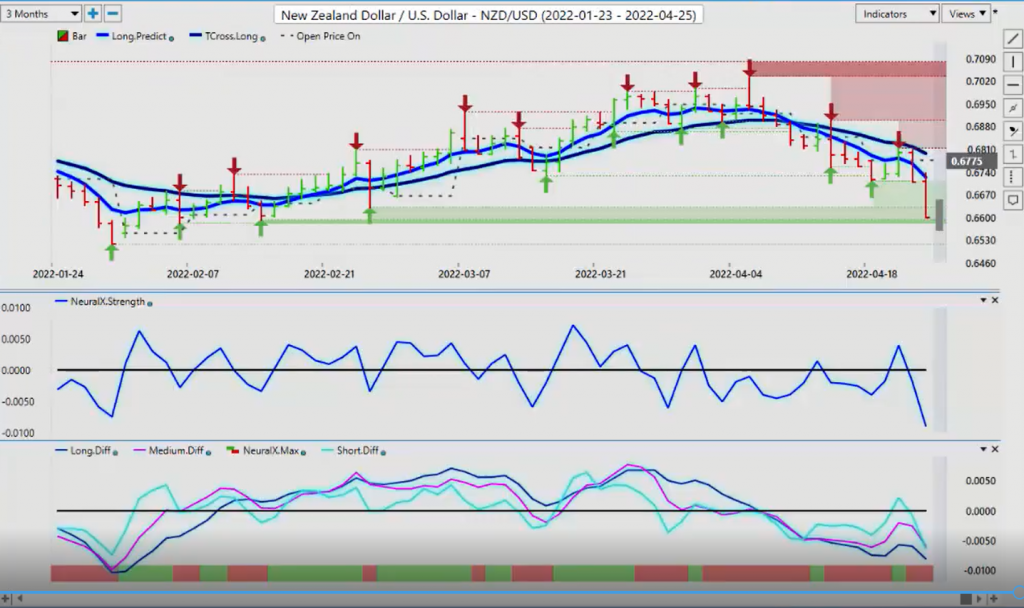
So the same thing, if we see a turnaround on the S&P 500 and if gold stabilizes, then these currencies would turn around. But you can see that how immediate the reaction is on these currencies. So even if you’re not a Forex trader and you’re on here and you’re a stock trader, then you can see that there’s a lot of opportunity in these other markets if you understand these direct intermarket correlations.
So what that said, this is the VantagePoint AI Market Outlook for the week of April 25, 2022.


