


Welcome to the Artificial Intelligence Outlook for Forex trading.
VIDEO TRANSCRIPT
Hello everyone, and welcome back. My name is Greg Firman, and this is the VantagePoint AI Market Outlook for the week of April the 18th, 2022.
U.S. Dollar Index
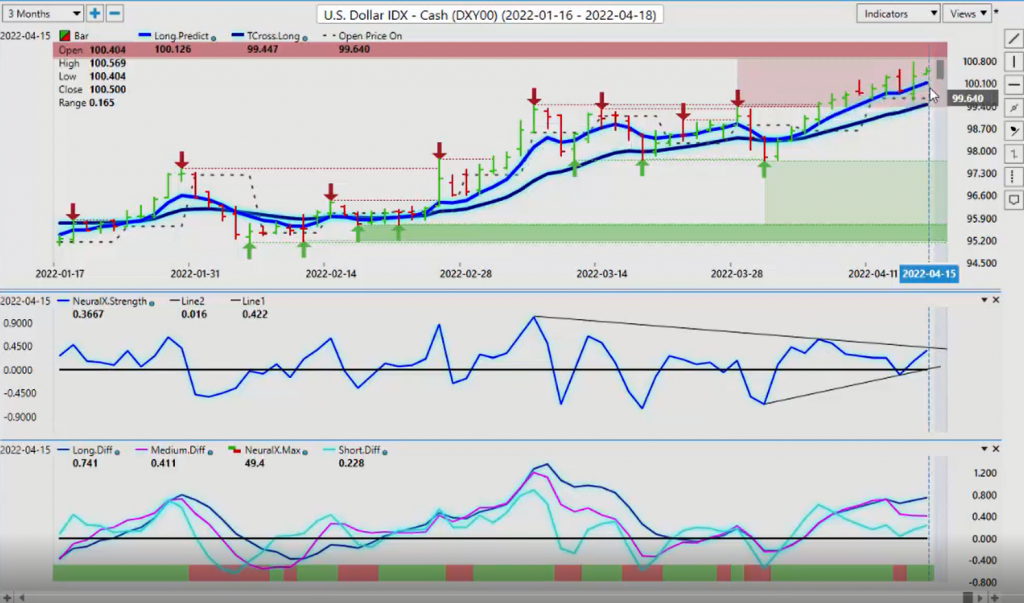
Now to begin this week, we’re going to begin where we always do with that very important US Dollar Index. Now the Dollar making another bigger move to finish the week, got into a little bit of trouble there on Wednesday. Thursday, we started to basically recover a little bit, but again, we’re in a holiday short week. Now, remember on Monday of this coming week, that it is still a bank holiday so the inner market banks are closed. I would be very, very cautious in the Forex market until Tuesday or Wednesday, until things settle down. Now, when we look closer at the Dollar here, after that recovery on Thursday to finish the week, we’re holding firmly above our weekly opening price from last week, which is 99.64, we’re above our yearly opening price.
But what we see in the VantagePoint software is a little bit of divergence here. Now our MA Diff Cross, which is our medium-term cross over, has crossed to the downside, but our Neural Index is still positive. But when we look closer at the Neural Index Strength Indicator, you can see that I’ve drawn a trend line, both on the bottom side and the upside. So this forms a classical technical pattern here, which points to a breakout. So if the Dollar cannot break up above the 100.50, and more specifically, the 100.79 area, then the Dollar would be at risk for a potential selloff, or if nothing else, at least a corrective move. We can see this congested verified resistance high at 100.50, and even stiffer resistance as we come up into this 100.70 area. So again, you can see numerous different verified zones, all tangled up in here. 100.73, that’s the immediate resistance that the Dollar must break through this coming week.
Now, the highest the Dollar has been probably over the last 8-10 years is still only the 102.35 area. So again, when we look at the Fed’s rhetoric of hiking and everything else, I’m still in the camp that the Fed may not be hiking as much as what he thinks he’s going to. Because again, most of this inflation, in my view, has been caused by COVID, we’ve caused it by shutting down the global economies, et cetera. So again, if the slack in the supply chain starts to come out, then the Fed may have to rethink this. Because again, if we look at this going back into March of 2020, the Fed was not actually hiking, he was getting ready to cut. And then COVID hit globally and that set off a whole bunch of rate cuts faster, but he was doing that anyway. So again, we’ll monitor things. But for the time being, the VantagePoint Indicators are a little bit mixed here. We’re showing that weakness in the medium-term and in the short-term and our Neural Index Strength is not making any new highs inside of our Neural Index Strength, as I’ve pointed out here.
Now, the way I will draw trend lines, is I will have a high point and then two bars to the left and two bars to the right that would be lower than that highest point. I would, again, apply that Japanese methodology in drawing trend lines or similar to the Demark trend lines where we start from right and we go to left, not left to right, and we always take current price into consideration. So again, if we’re holding above our T-cross long 99.44, the Dollar still has the opportunity to move higher. Our long predicted 100.112, but I believe that this area at 100.12 will be breached by Wednesday.
Gold
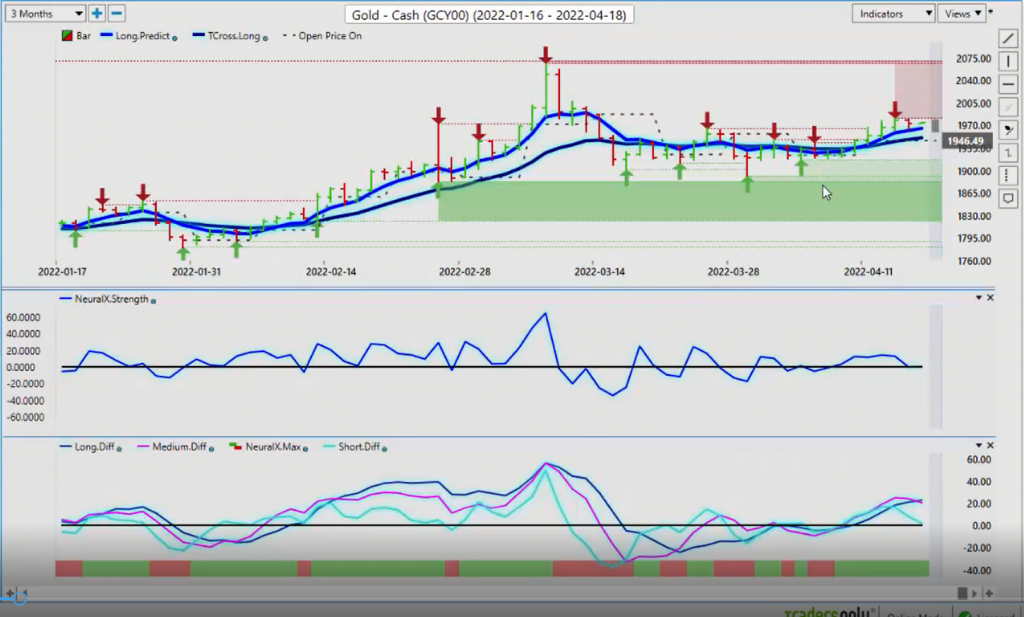
Now, when we look at gold contracts this coming week, gold’s stalling out again here. Well, not overly surprisingly. In my view, gold is the one that would have the seasonality edge here for further strength, not actually the US Dollar. But again, every year is different. A seasonality is not 100%, it’s 80 at best, right? So when we’re looking at this right now, the immediate resistance we’re going to deal with next week is the 1980 mark. If we can break above that, that could open the door back up over the 2000 mark, but gold is having a pretty solid year this year. You can see that we’ve held the entire week above our weekly opening price. We’re above our yearly opening price. But again, that Neural Index Strength is really struggling here to give us a clean, clear signal. It’s flattening out, but our MA Diff Cross is warning that there’s going to be potential downside on gold coming.
Now that pink line represents the medium-term crossover. The blue line represents the long-term crossover. So the theory here is, is that the medium-term trend is weakening against the longer-term trend, pointing lower. But again, if we move lower, that would likely be corrective in nature, down to around the 1950 mark. So keep an eye on 1950, long while above that level. But if we start breaking down and closing below 1950, we could see some short opportunity there, depending again, what happens with Russia and the Ukraine.
S&P 500 Index
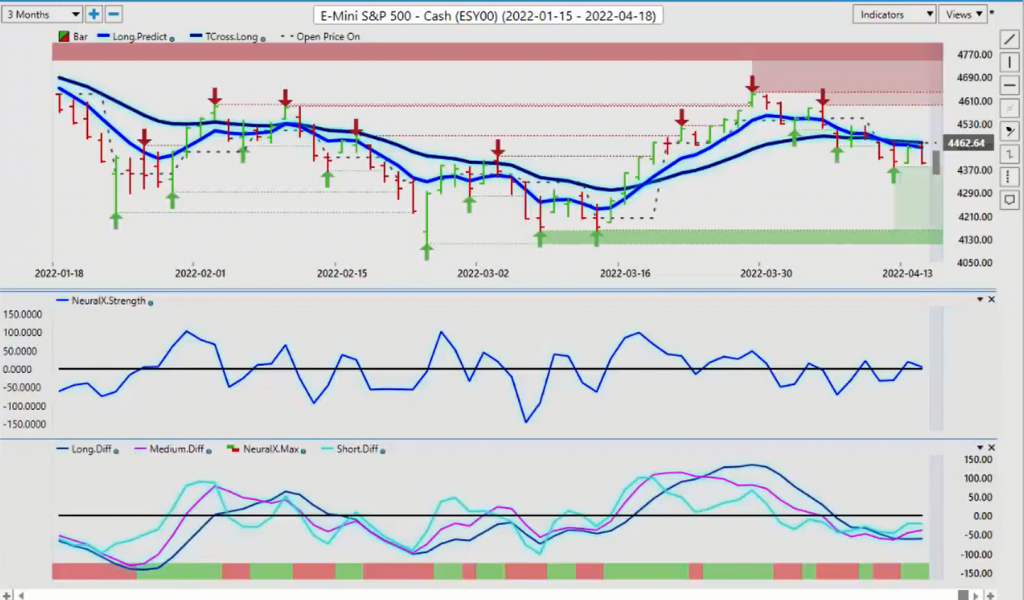
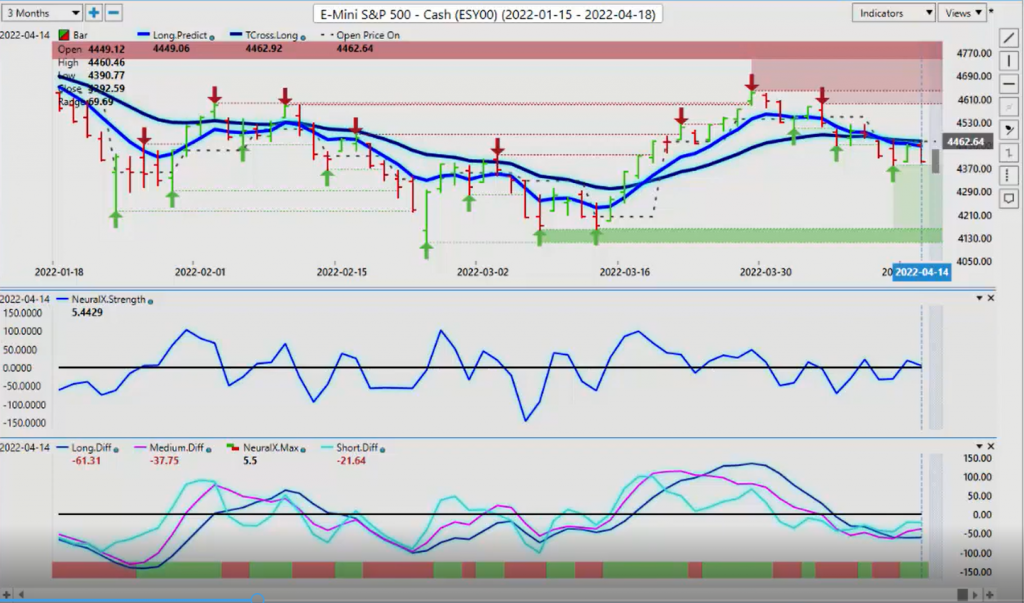
Now, when we look at our equity markets, once again, I haven’t really been in the bull camp on this one this year. And as you can see, this very significant resistance at the 4600 mark that I’ve discussed over the last couple of months now, basically, we’re unable to hold above it. So this is putting additional pressure on the equity markets, but we do have a verified low from last week that has formed at 4381. So to begin the week, this is likely where our weekly opening price is going to be, right around 4392. So we want to see if we can hold above 4392 if there’s any hope of the equities recovering. Now, our MA Diff Cross here is, once again, giving us an early warning sign that we could be seeing a reversal here on the S&P 500 or some of your global stocks. Maybe not the European stocks, but the Canadian stocks are doing fairly well, the US stocks, we could see them start to turn around a little bit here. But the main thing, right or wrong, is that it warns us that shorts may not be the best week.
Now, the strong seasonality, that I’m sure a number of people already know, is the seasonality is that the S&P 500 does very well in the month of April, May, June. These are better months for buying, so maybe it’s possible that we’re almost out of the woods here. But I question that, because this is the longest period that I’ve seen the S&P 500, in the last several years, holding below that yearly opening price. So again, our verified zone low coming in at 4397 is our support, and our resistance is at our VantagePoint T-cross long, and our long predicted, at 4462 and 4449, respectfully.
Crude Oil
Now, as we look at the oil prices for next week. Once again, an interesting move here, we’ve come back down to a known verified support low at 91.62, where once again, we saw strong buying this week. We overtook the weekly opening price by Tuesday, and then you can see the market has climbed ever since. Now, we need to hold above this particular verified high, that’s at about 105.13. But again, I don’t believe that oil has a lot of upside here at the current time. And again, that’s just strictly in my respectful opinion only. It’s so manipulated here, but the VantagePoint MA Diff Cross warned us that we should be starting to look for longs back here. And this was going back into the beginning of April. Then we’ve bottomed out this week, and sure enough, all three of our predicted differences are rising. So while I personally may not like longs, VantagePoint is pointing that there is likely going to be further upside.
Bitcoin
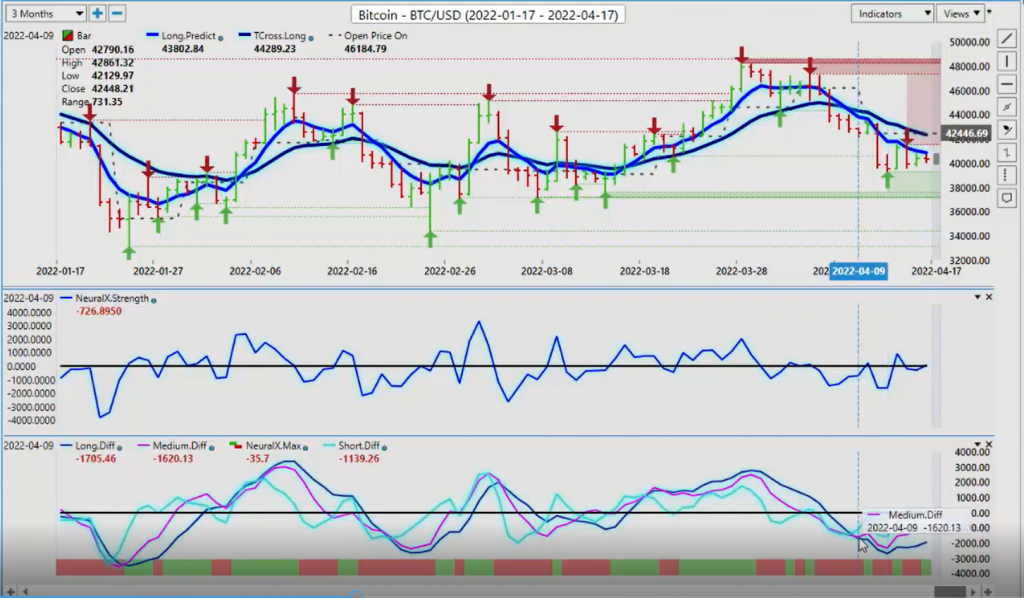
Now with Bitcoin, Bitcoin is dependent on the S&P 500, the NASDAQ turning around and moving higher. So the basis theory of intermarket technical analysis, if one market makes a move, it should trigger a move in another market. That other market here, when we’re talking about stocks, would absolutely be Bitcoin. So again, that MA Diff Cross warning us to be careful here, that there may not be a lot of downside. We have a new verified support low that’s coming in at 39,309, long while above that particular area. If nothing else, we are likely to retrace back towards the T-cross long at 42,340. That is indirectly supported by the Neural Index, the Neural Index Strength. Our predicted differences are rising. The slope of them are not pointing down, they’re pointing up. So again, we’re just looking to overtake that first resistance point at 40,832. If we can do that, then again, we should be able to target 42,000, 43,000 relatively quickly.
Euro versus U.S. Dollar
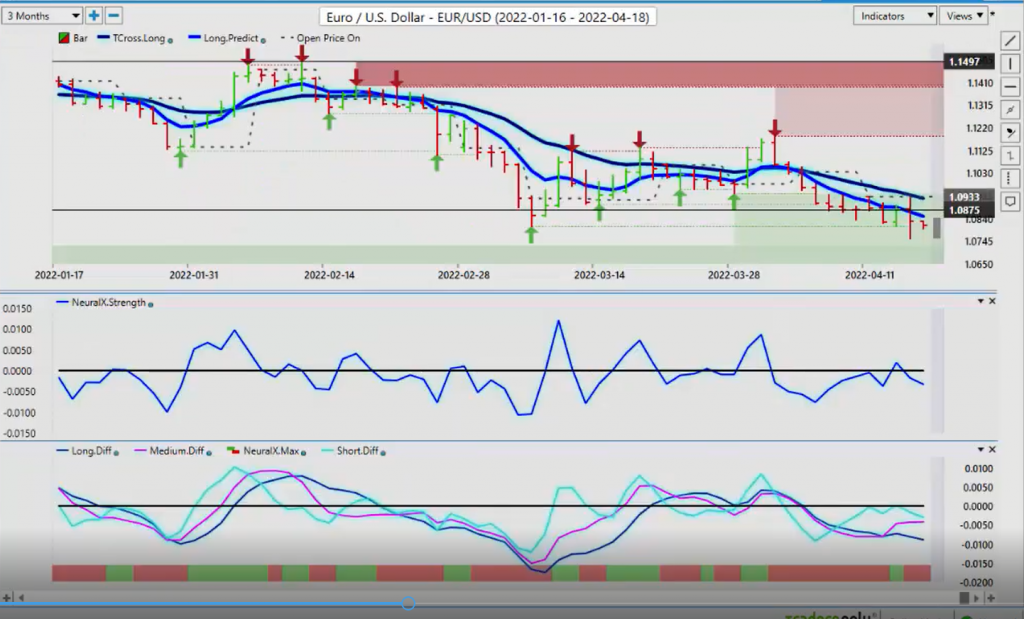
Now, when we look at some of our Forex pairs this week, the Euro/US pair, again, still in a lot of trouble down here. Now we have a verified support low at the 1.08 area. We had a little blip down below there on Wednesday, I believe it was, and then again on Thursday, just more or less a flat day here all together as we’re going into, again, that holiday short week of last week. And then next week is also, again, a holiday short week with that bank holiday. So again, we see our MA Diff Cross warning us that the downside may be limited here. So if there’s any crack in the dam in the Dollar Index, you immediately want to look for longs on this particular pair. If the Dollar can’t break above and hold above 100.73, 100.59, stay above that level, then the Euro could actually recover.
But the ECB really didn’t do much to help the Euro on Thursday, surprisingly. I think a lot of us thought they would. But again, we never trust anything these Central Banks say, they talk out of both sides of their mouth. They’re very difficult to gauge what their position really is. And they keep flip flopping, so it’s difficult. But for now, we do have some sign of life in the Euro here, but our Neural Index Strength firmly down. We’ve closed below our long predicted NRT cross long, but I’m still looking for some kind of a retracement to the T-cross long at the 1.0926 mark. Now that could be in the month of April, we’re going into a period of known Dollar strength, but again, Central Bank divergence here, meaning the Fed hiking and the ECB not, definitely favors the US Dollar on this particular pair. One could argue the same with the Pound/Dollar.
British Pound versus U.S. Dollar
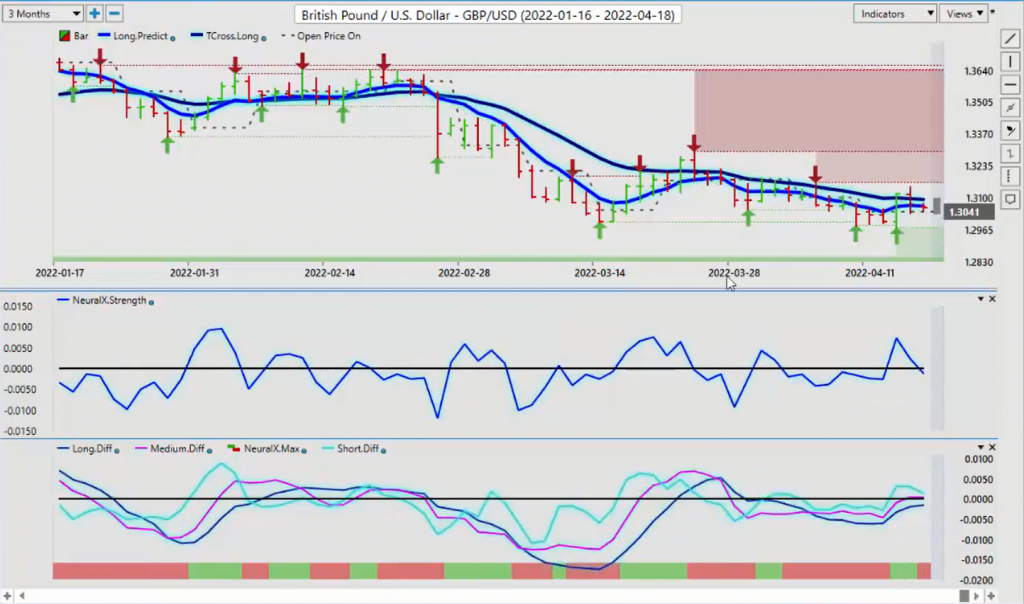
When we look at the Pound/Dollar, we’ve got very heavy support down here. The question is, can it continue to hold? That’s the million dollar question. I believe that if we lose these support lows down in this 1.2950 area, we’re going to go down pretty quick. So again, when we back our charts out to have a look over the last couple of years to see where the Pound/Dollar has actually been, if we break down below that level, our next level down, but this is the big one down here, guys. In my opinion, 1.2916 is a very, very big support level. I would still believe, again, I try and give something to the bulls and something to the bears. If the bulls are looking to catch a long trade, this would probably be the area, or just below there, where I would target.
Now, if you want to stay with the primary trend using the VP software, then we look at shorts going into the long predicted or the T-cross long, that’s 1.3095 and 1.3064. For Monday’s trading, I would argue this better for Tuesday’s trading, to be honest. Because again, Monday’s a bank holiday, guys. We’ve got the VantagePoint predicted high at the exact same level. So this opens the door to a potential straddle play here, where we sell into the VP T-cross long, stay with the primary trend, but we have a long ready to go, either above the VantagePoint T-cross long or the verified resistance high at 1.3166. But the initial move is pointing to the downside.
U.S. Dollar versus Swiss Franc
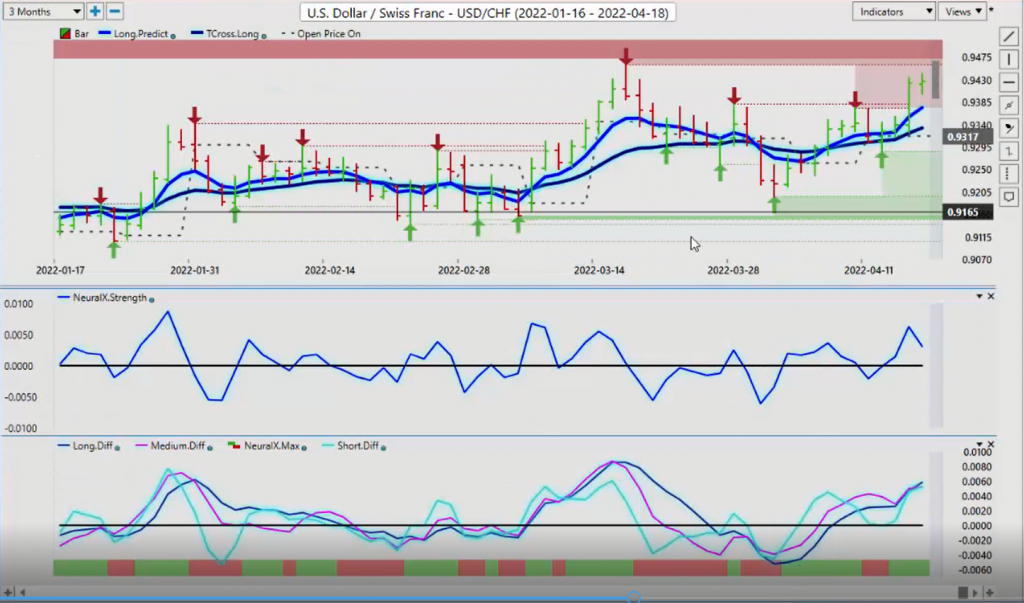
Now with US/Swiss Franc, we’ve had a little bit of a pop. I believe that we’re getting close to a top on this. We’ve got a verified resistance high going back to March the 16th. And what I will point out here, guys, too, just to be clear, is that we’re basically around the 16th of the month right now. You can see the date and time I’m doing this presentation, Sunday afternoon, just before one o’clock on April the 17th. So again, we were pulling up pretty high on this one last month too, but then we failed and down we went. So we can’t rule out a short up at these levels. Our Neural Index Strength, we can see that the slope of that is not actually strong, even though the Neural Index is green and it’s pointing up, the Neural Index Strength is actually weakening. So I would keep a very, very close eye on this resistance next week to see if we can hold under it. And that’s coming in at .9460.
U.S. Dollar versus Japanese Yen
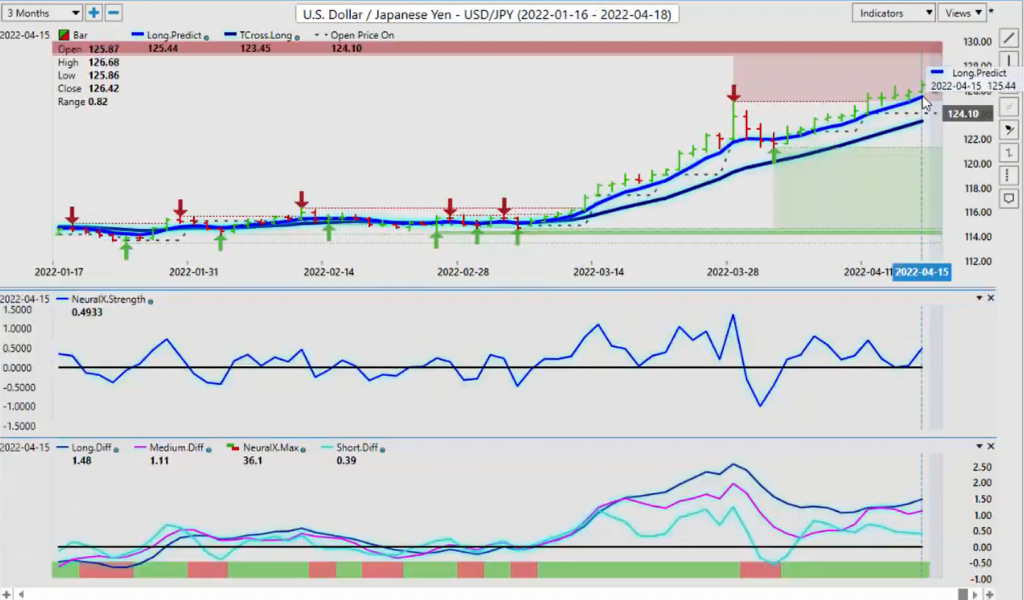
Now, with the Dollar/Yen, again, we’re looking for some kind of crack in the dam. But the Central Bank divergence between the Federal Reserve and the Bank of Japan, there’s considerable divergence there. Huge actually, so the carry trade clearly favors the US Dollar. Meaning that the interest rates go up in the US, they stay the same or go down. In Japan, Japan will probably never raise interest rates in my lifetime again, they’ll just stay below zero. Right? So that doesn’t always mean that the Dollar will strengthen. The Dollar has had a heck of a run here on this particular pair after breaking that verified resistance down in that 116.08 area, and it hasn’t looked back. But again, nothing goes straight up and nothing goes straight down. Remember that. So I’ll be watching this one very closely.
But right now, we remain still somewhat bullish on the Dollar/Yen, but I would expect some kind of retracement to this T-cross long. And that level is 123.45. So if the Dollar comes under a bit of pressure in the next, maybe even as early as this coming week, the middle of this coming week, then Dollar/Yen still could be a relatively place of decent value to sell US Dollar. But again, the diversions between the two Central Banks is always going to favor the US Dollar at this time.
U.S. Dollar versus Canadian Dollar
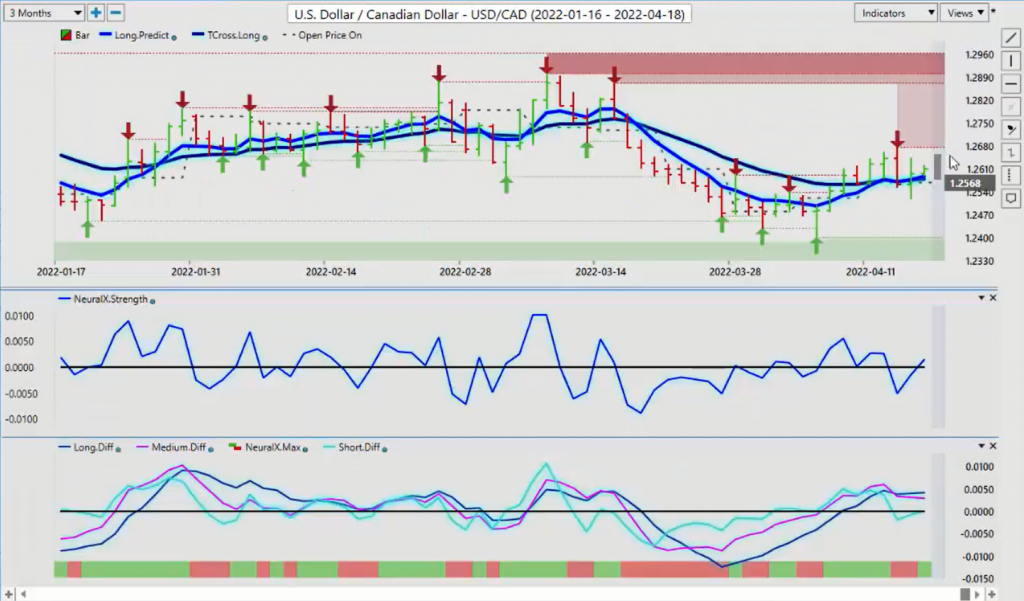
Now, with the US/Canadian pair, I expected a little bit more out of this, actually, hawkish Bank of Canada. You can see the choppy trade that it’s had this week, but again, the primary direction or the yearly opening price at 1.2632, as long as we’re still closing below that level, then again, it still basically favors the Canadian Dollar. We’ve got strong commodity prices. So for the coming week, we’ve got a verified resistance high at 1.2676. That would be a reasonable place to start to look for shorts. The VantagePoint predicted high, 1.2652, so we know where all of our resistance is. But always remember, that again, we’ve got to watch these additional indicators. Our Neural Index Strength, but I believe it’s picking up on the end of the week profit taking, the holiday short week, these kinds of things.
But still, we have an MA Diff Cross that’s pointing down, our Neural Index Strength indicator here is, again, it’s still saying there’s a bit of weakness left in the Canadian Dollar. Because just remember, the Federal Reserve is hiking too here, right? So it’s a battle between these Central Banks, but the commodities are always going to slightly favor the Canadian Dollar, so shorts still looking pretty good while we hold under the 1.27 mark. Now, if the Canadian Dollar regains that and pushes the US Dollar down, meaning the US/Canadian pair drops, that would actually push Aussie/US and New Zealand/US higher. But right now, after a big push to begin the month, right up to that 2% mark that I had talked about in the VantagePoint Live Training Room, we immediately failed once the Aussie did 2% on the month. We’ve then turned lower, but there’s also very heavy support down here.
Now, if we utilize our Point In Time indicator from VantagePoint, and we move that to our yearly opening price, then we can see that there’s, actually, the Aussie is still quite bullish. The immediate move is down, but our price on open or the yearly opening price is .7264. The theory is we would be long while we’re above that area.
Australian Dollar versus U.S. Dollar
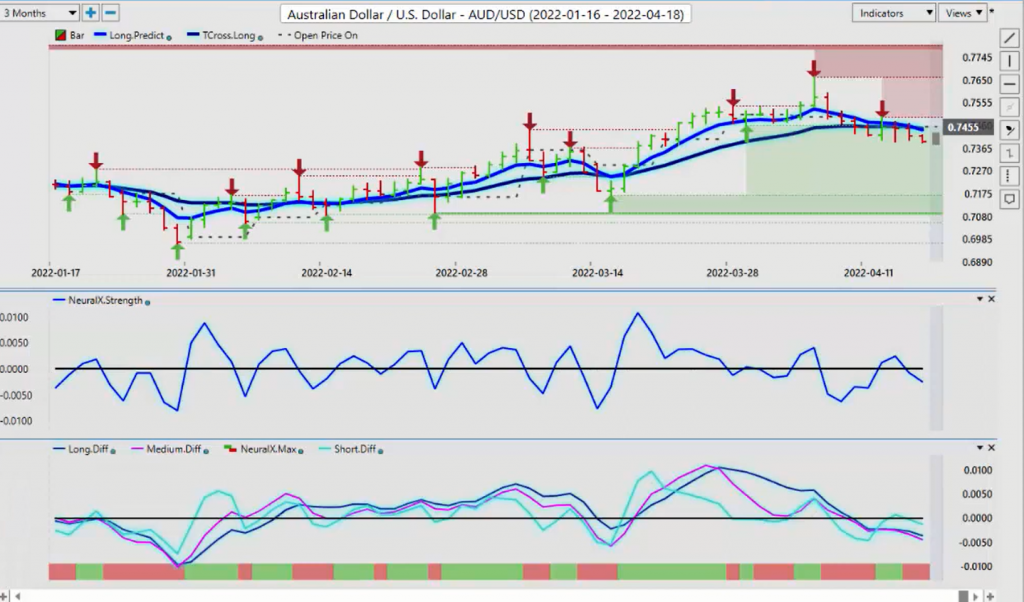
The Aussie is positive on the year against the US Dollar. This is a very easy way to determine market direction or what the overall underlying tone of this currency pair is. And again, while it’s above that yearly opening price, the Aussie is still favored. When it comes to Central Bank divergence, the Aussie is going to be hiking too. So again, is money going to move to towards the Aussie or towards the US Dollar in the coming months? I would argue it would likely move towards the Aussie, if the commodity prices remain firm.
New Zealand Dollar versus U.S. Dollar
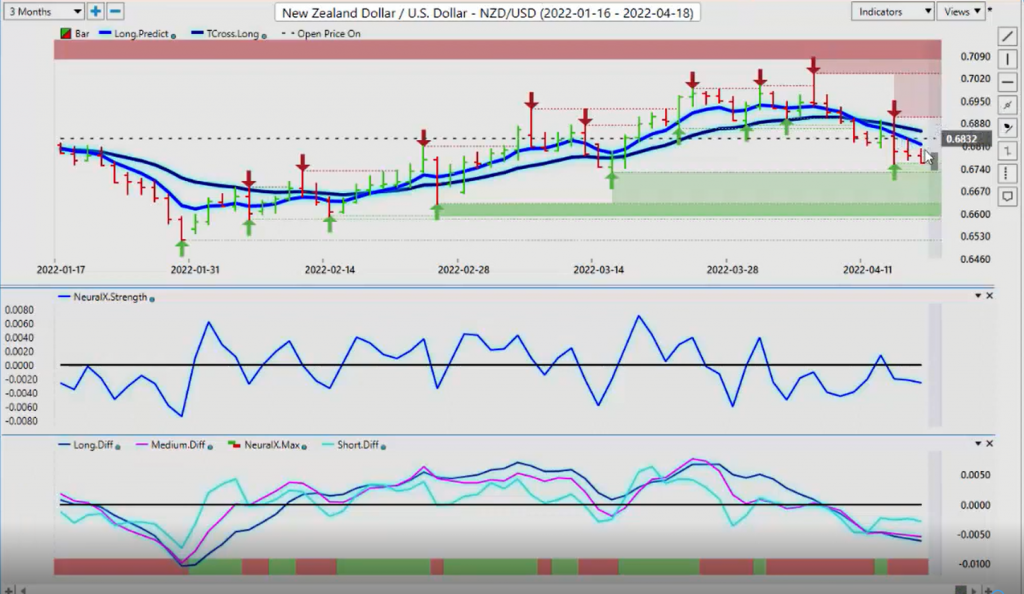
The same exact situation would apply to the New Zealand, but you can see the New Zealand is the weaker of the pair. We’ve broke down below the yearly opening price, we’re below our T-cross long. So if the Aussie rebounds and the Canadian Dollar rebounds, then a place of value to sell US Dollars could be by buying New Zealand/US. We have a strong verified support low that’s coming in at .6728. So again, watch this level very closely to begin the week. We do have an MA Diff Cross to the upside here also. So there’s a number of the underlying indicators in VantagePoint on the equity/commodity currencies that suggest that, potentially, they’re getting ready to turn around.
So with that said, this is the VantagePoint AI Market Outlook for the week of April the 18th, 2022.


