Welcome to the Artificial Intelligence Outlook for Forex trading.
VIDEO TRANSCRIPT
Hello, everyone. And welcome back. My name is Greg Firman, and this is the VantagePoint AI Market Outlook for the week of April 11, 2022.
U.S. Dollar Index
Now to get started this week, we’re going to begin where we always do with that very important US dollar index. Now, the dollar making a move based around the rhetoric around the FED or basically the interpretation of the FED minutes that the FED is going to get very hawkish on rates. What I will do here during this particular presentation is I will make bull and bear arguments for most of the asset classes we look at here.
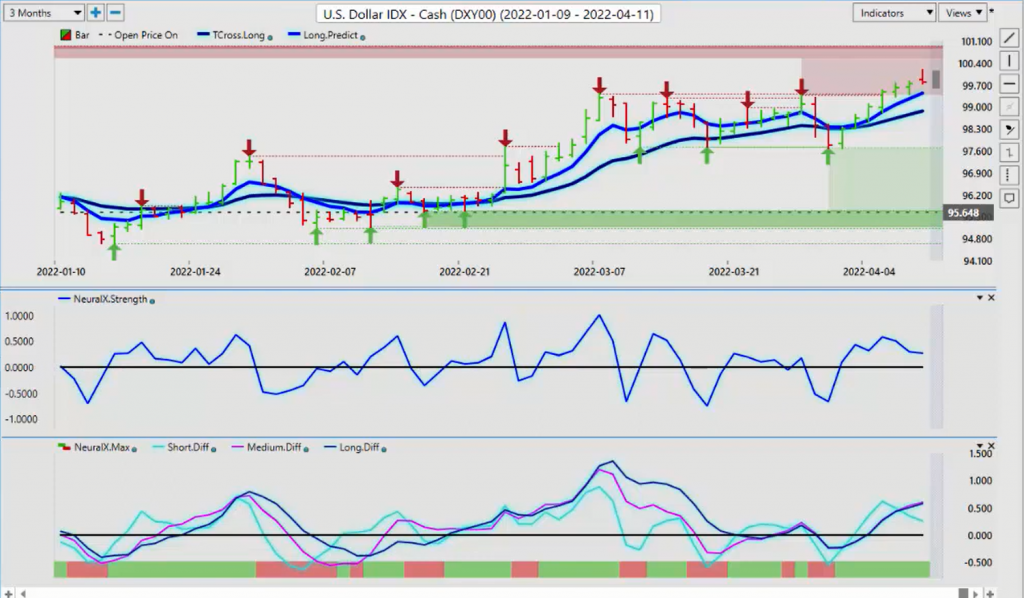
The bullish argument for the dollar here is that they’re going to be hiking 50 basis points at the next meeting, 50 basis points at the next one, so if that’s the case, then that would put a bullish tone to the dollar. Now, the market seems to be obsessing over this while at the same time, ignoring what that would do to potential growth forecast. I’m in the camp that the FED is not going to be as hawkish as what the market thinks here. So again, the bullish argument here is based around those rates, but again, growth is going to be a problem. If we look at this over the last three years, the dollar is approaching some very, very significant resistance here, just above this 100 level, 117, 150, you can see these levels.
Now what we also want to make sure that we’re taking into consideration is seasonal patterns. In most years, over the last five and ten years, buying dollars in the month of April and May has not been very good. I think around a 40% win rate, so you’re fighting that seasonality. You’ve got the market that’s getting itself all worked up over massive rate hikes, which I think they’re going to be disappointed in. So at this particular point, we look closer at the vantage point short term indicators to see if they’re in agreement, so we can see our predicted short term difference is losing momentum. When we look internally inside the neural index, it’s losing momentum here also.
Again, we’re approaching a massive resistance area around the 117 level, further resistance around 150. I don’t know if we’ll hit either one of those two levels again. As you can see after that move on Friday, the dollar pulled back, so again, we want to be very cautious when a trade becomes overcrowded. Now, in my respectful opinion, based around my experience, 20 plus years in the foreign exchange market, is that again, doesn’t mean that the dollar can’t do well in April and May, but predominantly, it doesn’t because it’s coming off a strong first quarter, a strong seasonality in that first quarter.
Again, when we put all of that together, we want to be very cautious about buying at these particular levels, unless we can break free and clear of all of the resistance that I’ve pointed out here, and that is very significant and that goes back into April again. Well, another thing to point out there, April of 2020, is where the dollar basically capped out and down it went, right? We’ll continue to monitor this, but this is a weekly presentation, not a yearly, not a monthly, just for one week, so we want to be cautious with a bull trap at these extremely lofty levels.
When we look at that, how that applies to gold, now, the seasonality in gold is that it usually actually is rather strong in April and May and I would argue even part of June. If gold continues to advance, that could be the warning sign we’re looking for that the dollar is not as strong as what these pundits are suggesting it is, so we want to be again, cautious here.
Gold
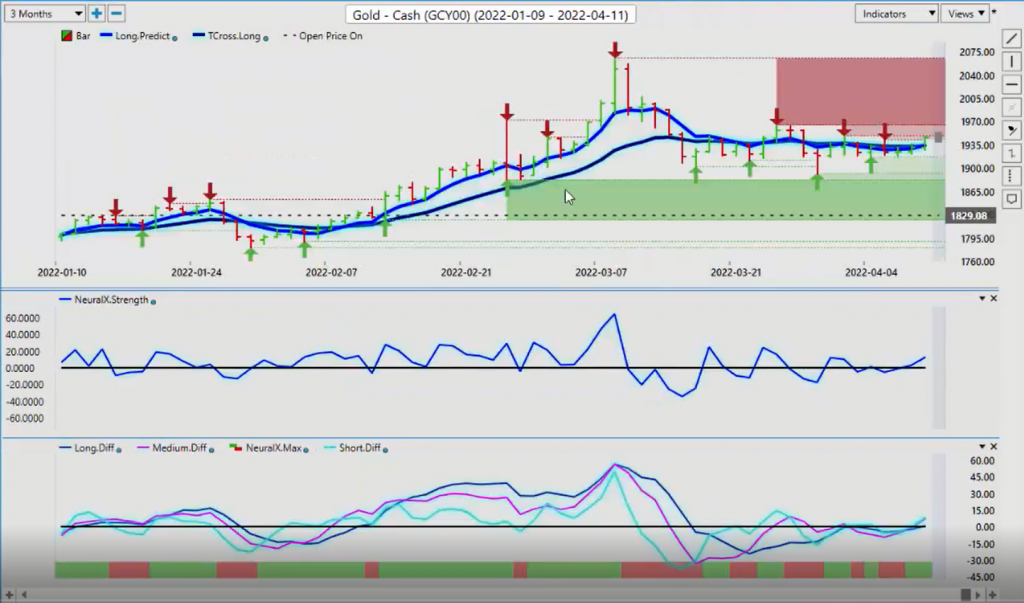
But gold, holding in there. Friday, we’ve moved back up above our T cross long and are long predicted. Those two key levels are at 19.34 and 19.34.59. As long as the market is holding above 19.34, this would suggest gold has further upside. Our neural index strength is pointing up above the zero line. Our predicted differences are a little choppy around the zero line, but basically this entire lineup of indicators is suggesting we are going higher. Now we have this dark red ominous cloud over here, which of course is the verified zone, very popular indicator and very effective indicator to warn us of potential failure points.
So I would respectfully submit on the bull side of this argument that we are likely to target 19.64. The bears, we would need a breakdown below the 19.00 mark to trigger any real sell off on gold. But as you can see, gold is firmly above its price on open 18.29. We would remain long on gold, as long as we hold above that particular level.
S&P 500 Index
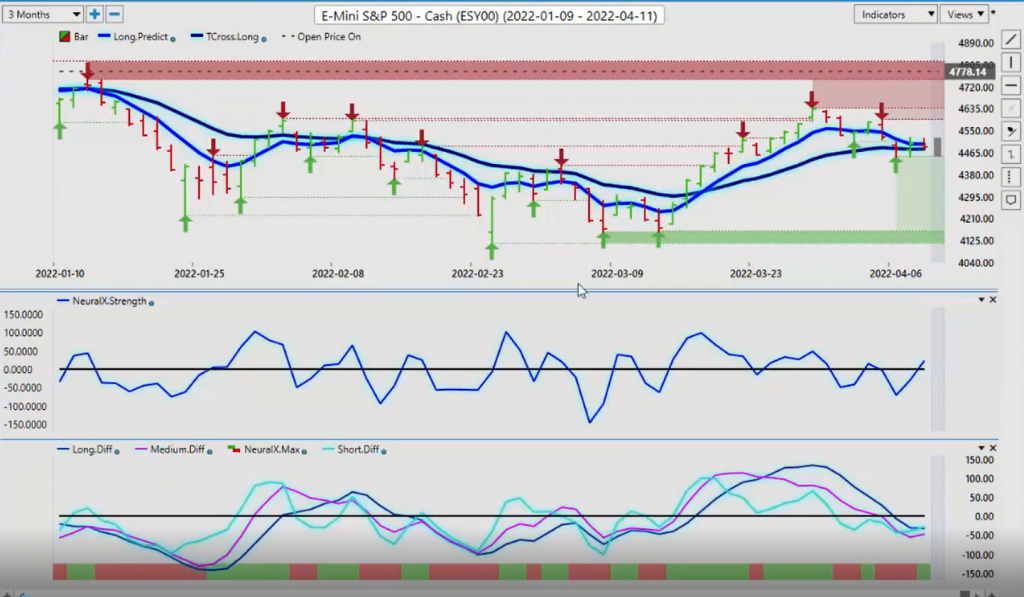
Now, as we look at the global equity markets, gauging that off of the S&P500, the S&P500 is done actually better than I thought it would this past week, because it was looking pretty dire there for a bit, but we do have a newly formed verified support low that’s coming in about 44.50 approximately. So next week, we’re looking for that level to hold, our neural index you can see the slope of the neural index is pointing straight up and on top of that we’re breaking above the zero line.
Now our predicted short, medium and long term differences with the neural index look like the slope of these are getting ready to turn back to the upside. So again, that in my respectful opinion would be strike two for dollar longs. If the equity markets recover in most cases, the dollar does not respond well to that. So again, when we look at our key vantage point pivot areas, that would be our long predicted at 44.97 and our T cross long at 44.81. Now the S&P500 still bearish on the year, still firmly below our yearly opening price at 47.78. But again, if we can hold above our vantage point T cross long, then we have a shot at going back up towards that level and I will point out that there is a rather strong seasonality in the month of April and May supporting actual longs on the S&P500 and some of your global indexes.
Crude Oil
Now with light sweet crude oil. Once again, we look at this as we can see we’re holding above the verified support low at 92.08, heavy support starting to build down on here, our neural index strength indicator when we actually have the ability to look inside of the neural index. Now we have our red meaning down for the neural index, green meaning up, but actually looking at that neural index strength, we can visually see inside of it and it’s pointing up. Now, it’s also just crossing the zero line, suggesting that oil is about to rebound again, only in my respectful opinion, making that argument for bulls and bears, that would be a further warning sign of potential pending dollar weakness. So if we combine that with the additional indicators in the correlated markets, then there could be a turnaround coming soon in the dollar.
But again, the market believes that the FED is just going to keep hiking where I think the FED is going to have to look and see what effect that would have on growth. And when I look closer at that, I don’t think that a series of rate hikes is the best idea at this particular time, given the recent lockdowns. So again, we’ll watch the verified support low, but if we can overtake the T cross long and the long predicted, then oil will likely start advancing. We also have our medium term crossing our long term predicted difference with the neural index, suggesting that this move lower was corrective in nature and it’s getting ready to turn higher. We remain firmly above the yearly opening price at 71.88, supporting additional longs, but expect oil contracts to be manipulated as long as the Russian-Ukraine war rages on.
Bitcoin
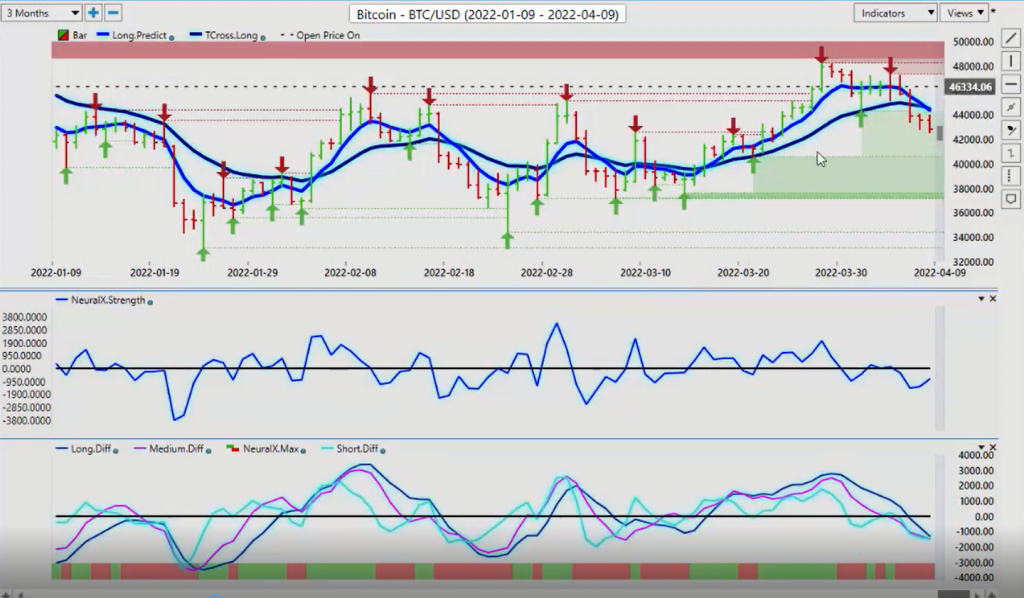
Now, when we look at Bitcoin going into next week, once again, Bitcoin failing getting above the yearly opening price, but unable to hold above it. So we’re starting to turn back down, but again, buying Bitcoin on a dip has been the preferred strategy for basically the last 10 years I would argue. The annualized returns of 230% per year still represent the strongest market, not just in the last year or two guys, but the last 10 years. So again, the bull argument there is that this is corrective in nature after a big run up and nothing goes straight up and nothing goes straight down. So we’re going to see additional choppiness in this, but if the dollar can ease off a little bit, that should help Bitcoin recover. We can see the slope of that neural index strength starting to turn back up. But again, still bearish while below our price on open for the year, which is 46.33.4.
Euro versus U.S. Dollar
Now, as we move into some of our main Forex pairs, once again, we are going to see a choppy week ahead. I believe particularly in pairs like Euro or US. Now, if the dollar index is getting ready to, let’s just say correct lower, maybe it’s not a complete reversal and the dollar will hold some gains. Even if it’s corrective in nature and we have the ECB on Thursday, if they get slightly more hawkish and I believe they will, that could be the trigger for some of the market participants to exit those, that very crowded dollar long trade. And again, from the seasonality standpoint, that dollar long trade is very crowded between January and April in just about every calendar year and then we go lower. So right now for next week, I think the verified zones are our best friends here 10806, we want to watch this area very closely.
I think we will push below it. They will set up a bear trap and then we’re going to snap higher and go back towards the T cross long 10988. So the bears, are firmly in control here, don’t get me wrong, but I think that they’re going to be pressured leading up to the ECB announcement. So keep an eye on our key pivot levels, 10925, 10988, they’re both in the same place. The further we move away from this, the likely it is we’re going to retrace to. Now, these were traces are not based around waves or Fibonacci or any of these things, it’s based around identifying a pivot point in the market, using your VP predicted moving averages, our T cross long and our long predicted.
So again, all of our resistance or our retracement point, removing the Fibonacci theory and implementing these, tells us that everything is around 10925, 10988. The dollar clearly is over bought. It’s a heavily crowded trade. So if nothing else, I believe we can get some kind of retracement this coming week. When we look at our short term predicted difference, it is starting to advance higher, warning us ahead of time, the neural index strength also starting to turn higher. So keep a very close eye, but again, I believe they will set up some kind of bear trap just below the 108 level.
U.S. Dollar versus Swiss Franc
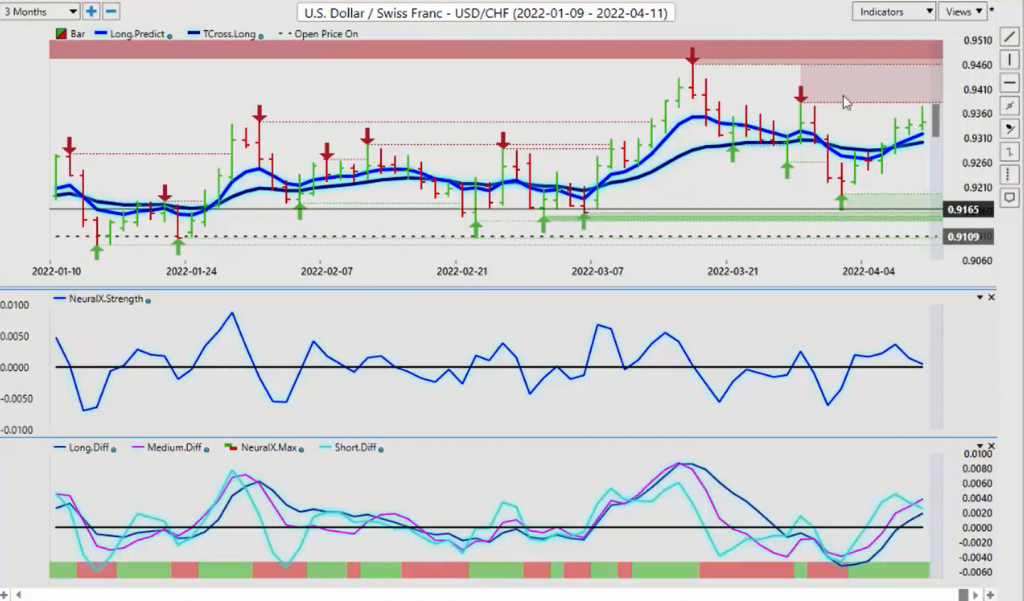
Now, as we look at the US Swiss Franc this week, again, I think that this pair is pretty much on borrowed time up here. In most cases, this pair runs out of steam by mid April. So again, when we look at our verified resistance, high 93.81, I believe we could test the high of 94.60 one more before we go lower. But the vantage point indicators are already warning that there’s a problem here. We’ve had three relatively strong up days and the neural index strength on each one of those days is pointing lower. Our short term predicted difference, also turning lower, but you can see the difference between the neural index strength and the actual neural index. We’re still green on the neural index. And that’s not to say that it’s wrong and that they were not going to go higher, but the neural index strength is saying we’re lacking momentum here.
So it’s vital that we look at that from a comparative analysis. So again, the first major hurdle that this pair is going to have is to clear 93.81 and I don’t believe that’s going to be an easy task and 94.60, well, we go back to the yearly high at that point, I think that we have a strong possibility of a failure either way.
British Pound versus U.S. Dollar
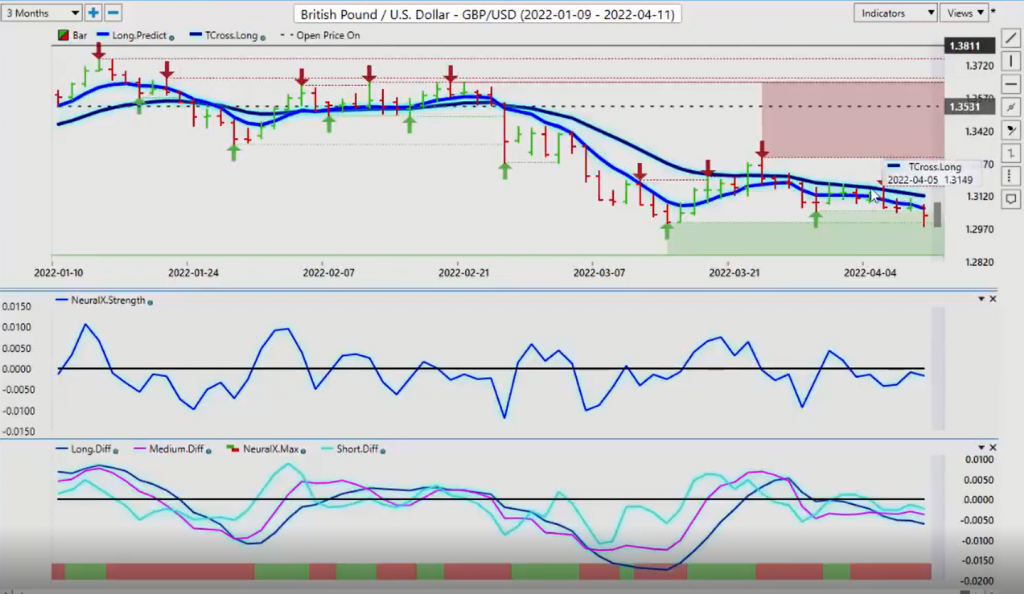
Now, as we look at the pound dollar going into next week is just too much for the pound. The vantage point, T cross long is just simply too much for this payer to get back up over, but we’ve also got a strong verified support, low at the 129.90 area. Now, once again, when we look at this, the bears are firmly in control, but the indicators and vantage point are warning us that there may not be a lot of downside here.
We’ve got our medium term crossing our long term predicted difference, but our neural index and our neural index strength are not on board. So what we need is about a dollar weakness here, which I believe we’re close to, even if it’s just a corrective nature, but in order for the pound to really break out of this, we must clear the T cross long. So again, making an argument for both sides, which I’ve discussed many times on here is again, a straddle play and you could completely disagree with everything, all of the analysis that I’ve talked about here today, but as long as you know your levels, then you can do whatever you wish. So if we use T cross long from that perspective, then the bears can sell into the T cross long at 31.21. The bulls can have their buy orders just above the T cross long or the verified resistance high that comes in again at about 131.66.
So if we’re putting our buy orders above there, then that would confirm that the dollar if nothing else is correcting lower, which would fuel pound dollar long. So again, for both sides, there’s enough meat on the bone here guys for all of us, whether you’re a bull or a bear, the critical point that I’ll try and make is, know your levels. If you know those levels, then you’re not chasing the market. You can literally straddle these vantage point predicted moving averages.
U.S. Dollar versus Japanese Yen
Now with the dollar-yen, the dollar-yen is got his work cut out for it. It has to clear this massive high from last month at 125.09 that came in on the end of the month during a period of known dollar strength. But unless we can get above here, then the dollar-yen is obviously is right for a sell off here.
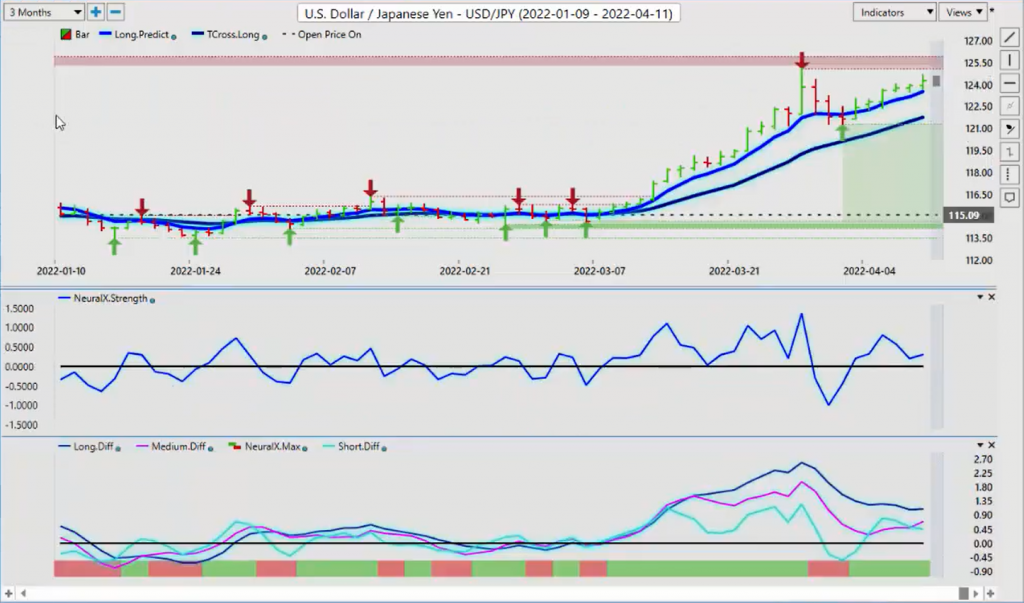
Now, I’m not saying it’s going lower. I’m saying this verified resistance high is going to be significant. And that is worthy of us looking back a few years to see where this pair has been. So you can see that this is a major breakout on the dollar-yen, so we look back to see if we can find a point in time when the dollar-yen has been this high. And as you can see, you would to go back many, many moons to find that. So we look at this clustered high up here that goes back to about the 124.58 area, but that goes back to 2015, the artificial intelligence using the verified zone will go back as many years as it needs to define this. So again, we’re looking at a significant area of resistance up here. Do I support shorts on that?
Well, that’s not my job here, guys. My job is to point out that this is a very problem area for longs and if the bulls have been firmly in control during a normal seasonal pattern of strength with the US dollar, but again, that seasonal pattern is usually exhausted by mid April and May are not strong months for buying the dollars. So we’ll keep a close eye on this, but again, our neural index strength is not overly strong here. Our predicted differences are losing momentum, can they regain that momentum on a rising yields? Yes. Bond yields, of course they can. But again, is the market putting words into the FED’s mouth? I don’t know, that’s left to be seen or is Jay Powell going to look at this closer and say, if I hike this many times, I’m going to kill growth and set off a recession, so I don’t think I would want Mr. Powell’s job at this particular time to say the least.
U.S. Dollar versus Canadian Dollar
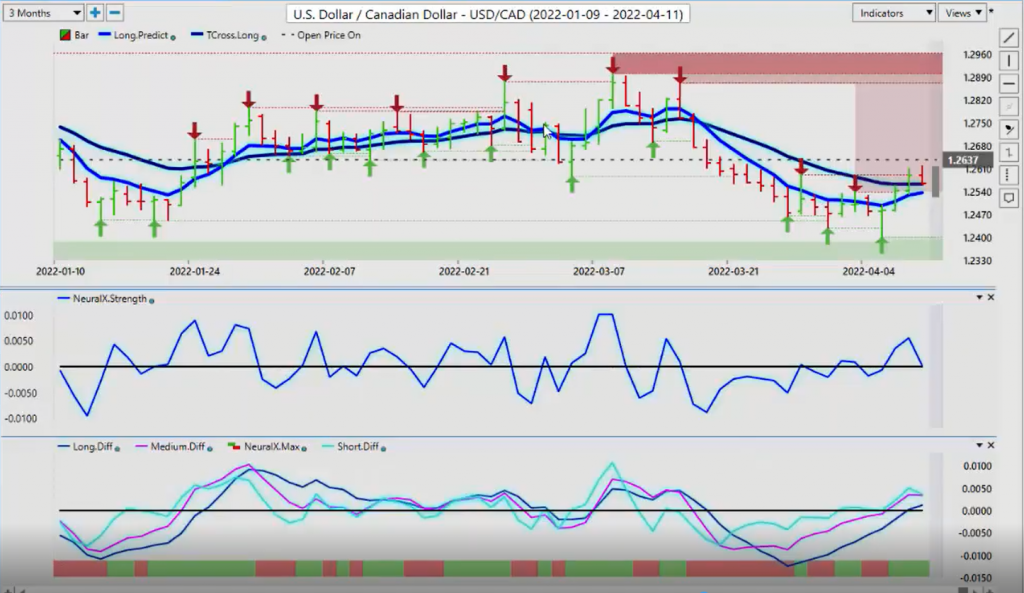
Now with US-Canada, again, not a horrible jobs number on Friday, but not really a great one, either out of Canada, it was okay. But they also released a second COVID budget, which was again, they’re talking about reducing spending, I don’t know if they will, but again, with this, it makes it easier for us because we know exactly where the price on open is set to the yearly opening price, 126.37. I do support shorts. So I’ll make the argument first for the bears that we’ve got strong commodity prices. We’ve got decent labor reports coming out of Canada. But once again, is the market putting words into the Bank of Canada’s mouth, by saying, it’s guaranteed that they’re going to hike 50 basis points next week with the Bank of Canada. Well, let me be clear, guys, COVID is running rampant in Canada.
I at the current time have COVID, I’ve recently picked it up in the last few days. It’s spreading again like wildfire here. I think the Bank of Canada is monitoring this and I’m not convinced that they will raise hike rates by 50 basis points next week. I think it could be more, let’s wait and see if we’re done with this COVID thing yet or not. Because again, I’m just outside Toronto, Canada, and the cases here are off the chart in the last couple of weeks. Again, I’ve managed to avoid COVID for two years and now it’s even got me. So again, I don’t think we’re done with this thing. So that could weigh on the Canadian dollar if we keep getting oil prices being forced lower by increasing the supply that could weaken the Canadian dollar.
But again, the primary trend is clearly down. So right now we’re closing the week on the T cross long, 125.62, but you can see the vantage point predicted high for Monday is 126.14 and our yearly opening price at 126.37. If you’re going to short that’s the area. Now again, I said, I would try and make that argument for the bulls also. So if you disagree with the short trade, I don’t blame you. There’s a number of factors that could send this thing higher. So you would put your buy limit orders and you would straddle the yearly opening price and have your buy orders sitting just above that ready to go and saying, you know what, maybe it’s going lower, maybe it’s not, but I think it’s going higher. So this is where you would put your buy limit orders and expect a very choppy, volatile trade.
Australian Dollar versus U.S. Dollar
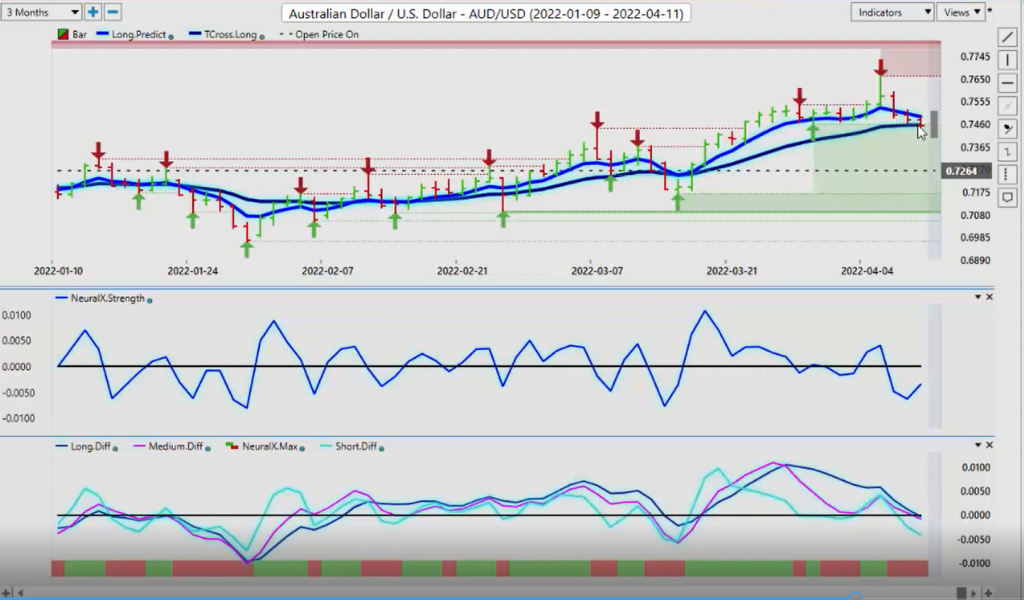
Now, Aussie-US is a funny animal. It made a big move at the beginning of the week and it actually hit its seasonal numbers for the entire month, I’ve got that at about 2.39% for the month of April on the seasonality basis. And Aussie hit that to the bloody number guys and then just tanked once it did that. Now let’s remember we’ve got our T cross long at 74.55, but we are firmly above our yearly opening price at 72.64. So the Aussie is being driven by commodities. There’s no doubt about it, but metals are still very strong here. Gold, silver, uranium, they’re still very strong. So there’s been some things going on between the US and China this past week, so that’s kind of let the steam out of the Aussie a little bit too.
But what we’ll do now is again, which I haven’t talked about so far in the presentation, but always keep an eye on your weekly opening price, where the market kind of settles in on midday Tuesday, that’s usually what it will do for the rest of the week until late Thursday. So again, watch your weekly opening price and keep a close eye in your T cross long. Right now, the predicted differences are all heading lower. You can see that the neural index is red, which means down, now that’s not wrong. But again, when we look internally inside the neural index at its strength, it’s actually pointing up. It’s losing downward momentum rate on the T cross long at 74.55. So the vantage point predicted low for Monday is 74.04, that could be a potential long area with Monday volatility, but keep a close eye in commodities and keep a very close eye on the S&P500.
New Zealand Dollar versus U.S. Dollar
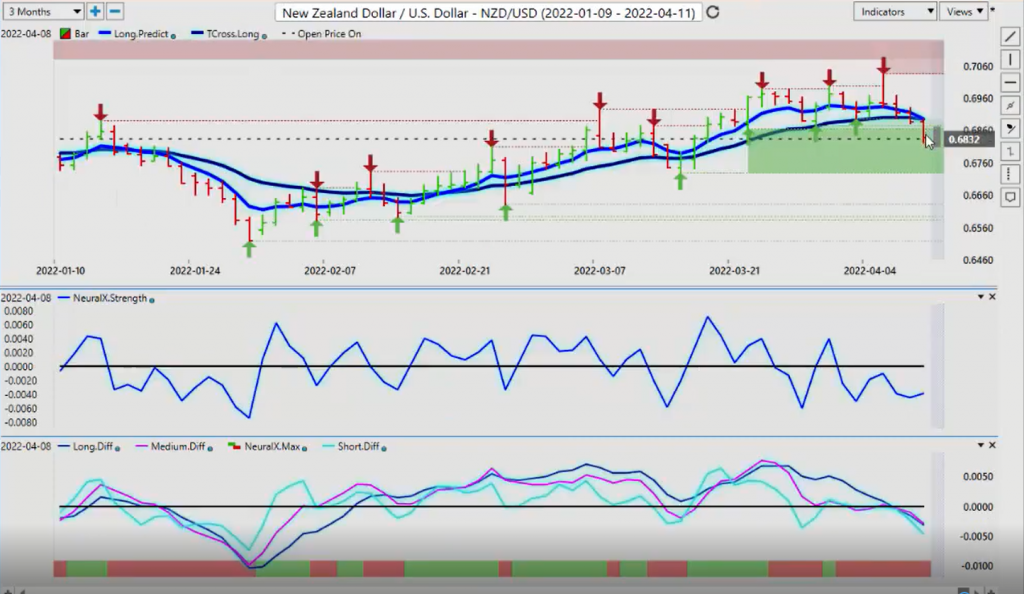
Now virtually the same thing would apply to New Zealand, but you can see New Zealand is moving more aggressively to its yearly opening price. This is what I’ve seen in years past at this exact time of the month is that the market will approach its yearly opening price after the dollar has had a long rally of two or three months, like January, February, March, it’s done very well, pushes it down, but then mysteriously the dollar just runs out of steam in the middle of April. So that would be the bull argument here where we’ve stalled on the yearly opening price, which is 68.32, right? So if this is a bear trap, it’ll move 30, 40, 50 pips bull below that then Tuesday or Wednesday, it will viciously snap higher.
Be very, very cautious of that at this particular time. In my respectful opinion, to take the real bullish tone out of this, we really would have to break down below 67.28 and break free of this particular channel. But again, you can see the neural index strength indicator is starting to slope back up after a massive down day on Friday and that’s what I love about predictive indicators guys is they don’t look at the Friday chop. They’re looking at the underlying intermarket correlations and the underlying intermarket correlations, the neural index is picking up on something, that’s exactly what we want from our vantage point software. So what that said, this is the VantagePoint AI Market that look for the week of April the 11th, 2022.