Welcome to the Artificial Intelligence Outlook for Forex trading.
VIDEO TRANSCRIPT
Hello, everyone, and welcome back. My name is Greg Firman, and this is the VantagePoint AI Market Outlook for the week of April the 10th, 2023. Now, to get started this week, we’ll begin where we always do with that very important US Dollar Index.
U.S. Dollar Index
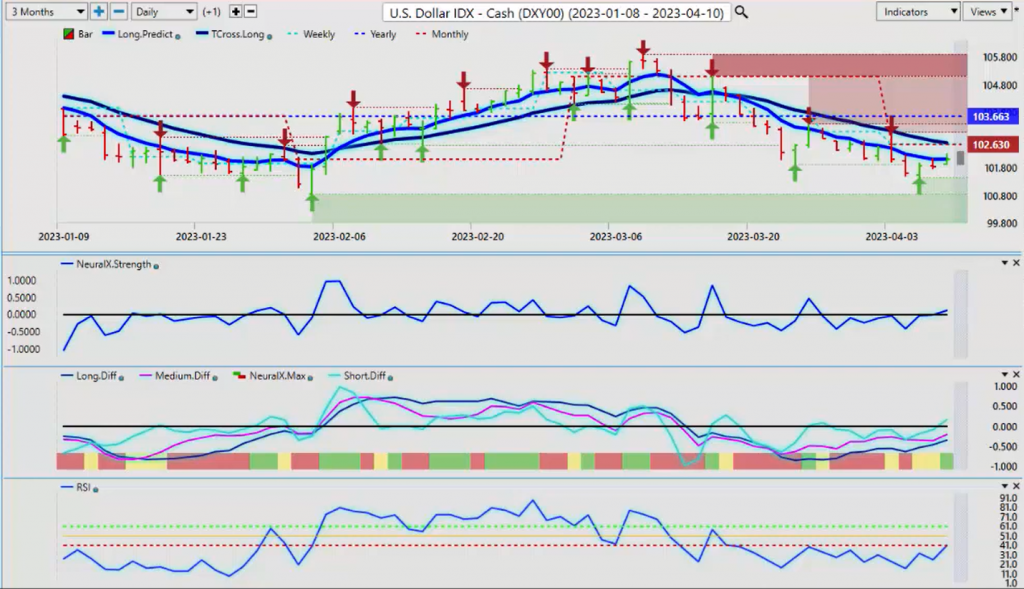
Now, coming off that nonfarm payroll number, not an overly great number in my respectful opinion. I would highly question the upward revisions to the previous month, but those are the numbers they’ve given us and those are the numbers we have to deal with. So right now we can see that our VP indicators are slowly rolling over to the Longside in the dollar, but the dollar will struggle in the month of April unless the Fed starts talking about hiking more, things of that nature. But when we look at the VantagePoint indicators, our predicted differences are rising. Our neural index is positive. We’re coming out of an oversold territory here, but that doesn’t mean the dollar can’t go lower.
Now our key upside pivot points using our Long Predicted and our TCross Long, the resistance area 102.27 and 102.98. A break of these two levels will trigger some dollar Longs, but I question how far the dollar can actually go as we remain firmly negative on the year below the yearly opening price, that price coming in at 103.63, but our monthly opening at 102.63 were also below that. So there’s very few buyers of US dollars right now. Our VantagePoint TCross Long is intersecting with our monthly opening. So the key level you want to watch to begin the week to see if we can overtake it would be that 102.63 levels. Up until that point, it’s strictly a retracement, not a new trend.
S&P 500 Index
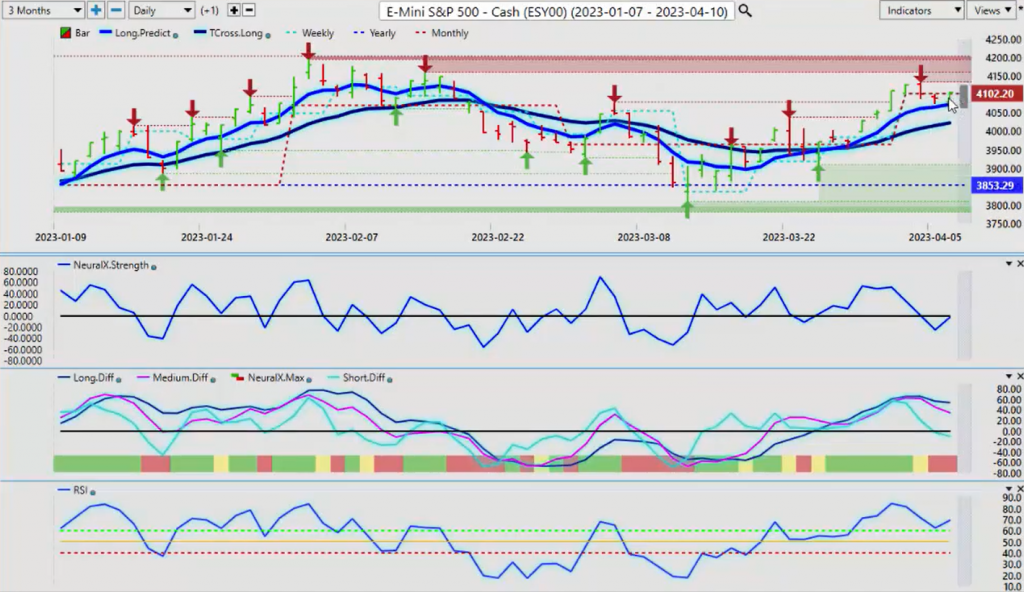
Now if we look at our main indexes, they continue to rise on this dollar weakness, but my concern here is again, with the S&P 500, we’re not holding above that monthly opening price. We’re still negative on the month. But we are holding above the VantagePoint TCross Long at 102.72 and our Long Predicted at 4072 and our TCross Long at 4022. Now again, the monthly opening price is still very important to us because we want to see that prices staying above the opening of the month, and we still have buyers up here. But we are struggling and we have a stronger verified resistance high that’s coming at about 4159. So we’re still in this overall primary range. That goes back to basically the beginning of February, I would argue. We’ve got our high at 4195 and are low points so far in March or in 2023. That area’s coming in at or about the 3808 area. Very, very strong buying. Anytime we get near, the yearly opening price, we see strong, strong buying down here.
Now again, if we look at that and we do a comparative on the ETF side, the SPYs have never been negative on the year, guys. We have to make sure we’re not using rolling performance, going back at where we were from a year ago today because it’s not particularly relevant unless we’re applying a seasonal pattern to it. So if we look from one year ago, we did have a large selloff on the SPYs and the S&P 500, but that was clearly because of the Fed going crazy with these interest rate hikes. He said he was only going to go to 0.95 or 1% for all of 2022, and instead he goes to almost 5, which obviously drove the ETFs, the stocks, everything lower. But again, we want to make sure that we’re looking at things on an exponential basis. So what I mean by that is if we look at the SPYs going back to October, we haven’t had a new low since October the 13th.
So the main thing we want to make sure is that we’re looking at current pricing going back too far. So if we look at the SPYs, we’re up 17% in the last six months. But again, in my respectful opinion only, we would only look at that up until the beginning of January the 1st. Then we look at January 1st through December 31st. So if we take a same comparative analysis of proximate levels and we look at it where we are on a year to date with the SPYs using the proper calculation on a yearly basis, we can see that we’re up almost 7% on the year. So again, I’m a happy seller of the S&P 500, of the SPYs, of individual stocks, but not until such time as we actually turn negative on the year.
So going back, using rolling performance is very similar to using a simple moving average. It’s a lagging way of looking at something. So when we look at current pricing from the new year, the stocks are having a good year. Yes, we’ve had some significant replacements throughout the calendar year, but we can also assess that we’ve still got buyers. Now again, going into next week for both the SPYs and the S&P 500, we do want to consider where we are in the current range and we are at the top of that range. So we are likely to see some sellers coming out of the woodwork up here. But the trigger point would be that dollar getting strong.
Gold
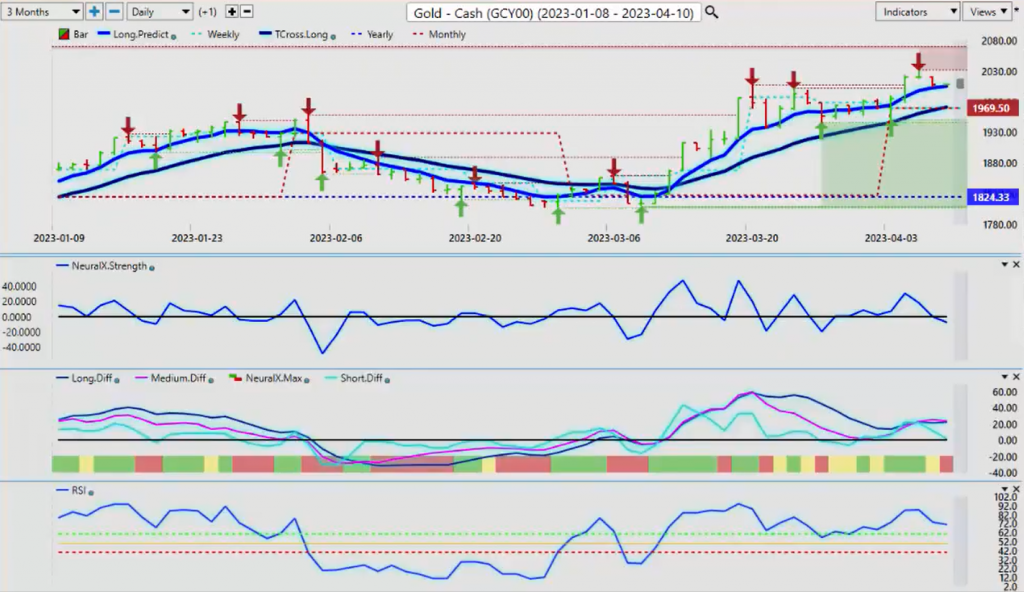
Now, gold prices, I think the market is clearly banking on a recession here with gold prices continuing to advance after we had a Long retracement last week. You’ll notice we stopped right on the TCross Long, at that TCross Long coming in at 1945. So the savvy trader seeing this uptrend in gold, which has been very strong throughout the year, again, perfectly normal, these retracement points coming during that seasonal pattern of known dollar strength, once that passes, we can see VantagePoint immediately picks up on that using the yearly and the monthly opening price. The Long Predicted in the TCross Long and of course the neural index.
But when we look at the predicted RSI at this particular time, you can see I’m using a 60/40 split. When we break the 60 level, that led to a significant rally providing we remain above the predicted moving averages and the RSI remains above 60. That points towards momentum in the market. In many cases, your stochastic, your MACDs, your RSI are used improperly. They’re used as something to show overbought, oversold. We’re not in 1970 or 1980 or 1990 here, guys. We’re in 2023, we have a momentum based market. And when we have momentum, the last thing we want to do is fight it.
Again, the whole theory here is that we don’t want to beat the market. We want to join it. And using intermarket correlations allows us to see things that others don’t. So again, as gold starts pushing up to the upside and the VP indicators are confirming that, the last thing we want to do is try and sell this. So we’ve had a significant rally. We’ve broken through a verified resistance high at the 2007 mark, but I believe we still will have some type of retracement next week. I think the dollars should see a little bit of strength here. Very mixed bag here, but predominantly, the neural index down, it is showing some weakness.
Crude Oil
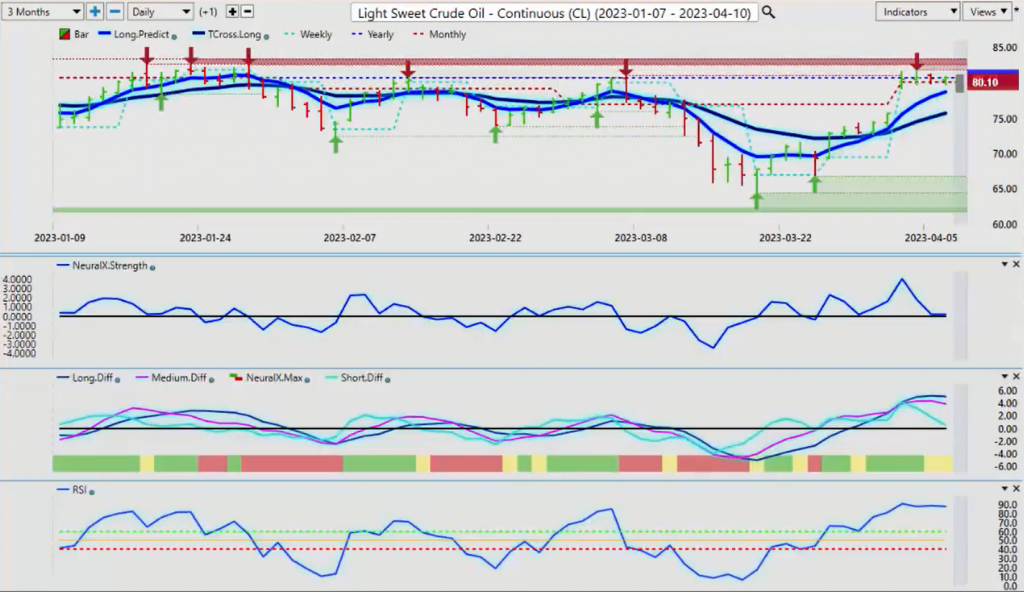
Now, oil prices have settled down somewhat after the OPEC, but once again, guys, it’s very, very important to identify using verified support and resistance. We’re coming back to basically almost where we started the year here in January. So we’re back up near that high and you’ll notice all of a sudden near the yearly opening price and some of the VP verified zones that we start running out of buyers up here. So once again, if the market believes that the US or globally there’s going to be a recession, then that’s not necessarily the best time to be buying oil even if they are cutting production. But right now, I personally would like to see a bigger break of this area. So when I zoom the VP charts out, you can see very, very heavy resistance in this 82, 83 area.
And again, the indicators are not looking overly bullish here. So I would respectfully submit that we would need that break of that level to continue to buy. Very, very dangerous buying for this particular levels. Particularly when the VP predicted RSI is basically stalled, the predicted differences are weak, the neural index is yellow, the only light at the end of the tunnel here is the neural index strength. It’s refusing to break down below that zero line, and this is why we have a yellow on the main neural index. Very important to use both of those two indicators because it really does show us something different here.
Bitcoin
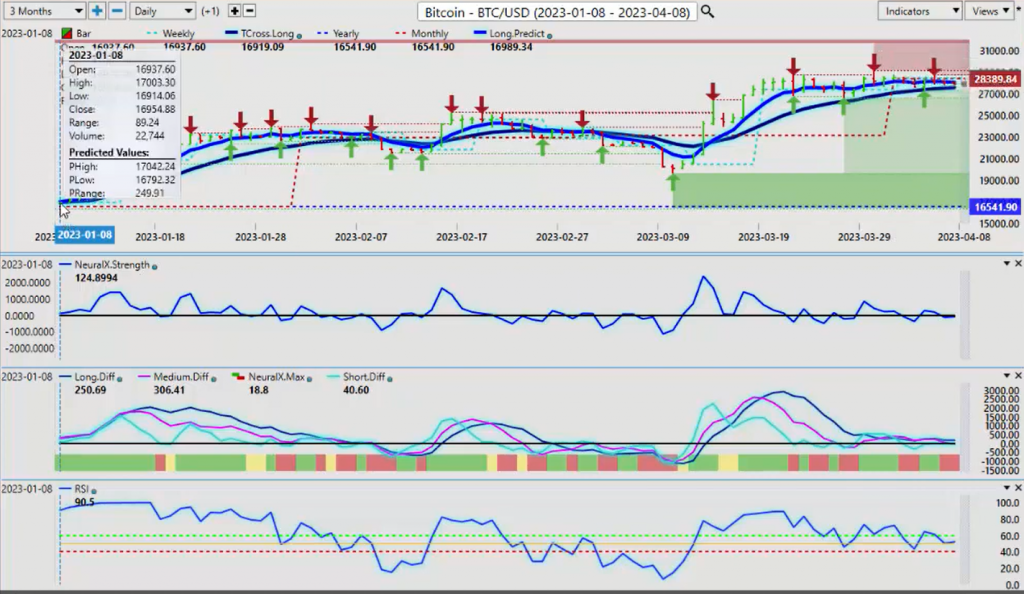
Now, when we look at Bitcoin, Bitcoin, again, once again through the calendar year of 2023, massive recovery. Even if I just go back here from January the 8th, I won’t go all the way to the 1st, to basically where we are right now, the pundit saying that Bitcoin is a scam, don’t buy Bitcoin, facts matter here, guys. I’ve been a strong advocate that Bitcoin will move higher with the equities. But as of late, what I was looking for is for Bitcoin to correlate itself to gold, which it’s done. This big move up in Bitcoin that occurred this starting back in another significant leg up on March the 13th, when we cross reference that to the gold contracts, we can see that basically they’re within a matter of days of each other. This is a very positive correlation here. So even if stocks tank guys, the thing we want to understand is that Bitcoin is becoming very adaptive to different market conditions.
So again, if they don’t want to go into dollars and they don’t want to go into stocks, but they’re going into gold, they appear to be going into Bitcoin now. And this is something I warned about here on the AI weekly outlook months and months ago, that I’m anticipating that this could occur based on my knowledge of intermarket correlations. So this is something we want to continue to watch very, very closely. So if gold pulls down, then basically it’s saying that Bitcoin could pull down also. But again, we’ll continue to monitor it. Bitcoin’s key level for next week, 27,562, but firmly above the yearly opening price. But like gold again, and equities, we’re struggling up here around the verified resistance high. That mark is about 28,100.
Euro versus U.S. Dollar Index
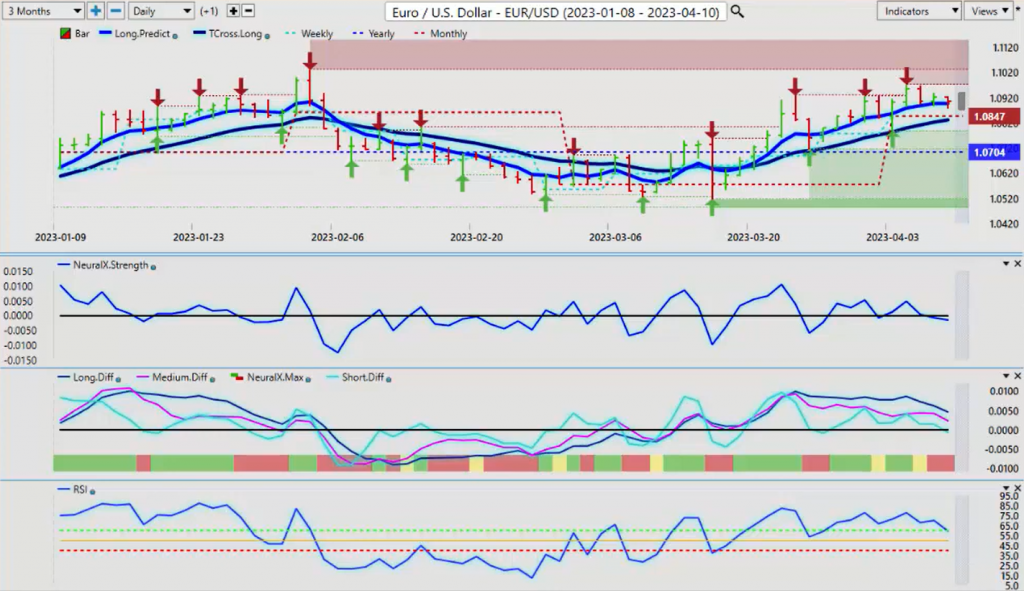
Now, as we come into our main FOREX pairs, I’ll run through them quickly here this week because it’s all based around whether we’re buying or selling US dollars. There’s a very, very soft buy signal in the dollar. In most cases, 85, 90% of the time the dollar sells off the week after the nonfarm payroll number. We’ve got a holiday this past Friday and we have a holiday on Monday. So I would respectfully again submit, let price settle well into Tuesday before you start going after a lot of different pairs or anything in the market, because I believe there will be a lot of reversals.
But right now the Euro is showing signs of weakness, weakness like the dollar index. So again, I think if nothing else, a corrective move lower in the Euro is likely. Our TCross Long 1.0830, our yearly opening price 1.0704. I would argue that we would continue to be buyers, the Euro/US, provided we stay positive on the year, much like what I’ve talked about this entire calendar year with the SPYs, the S&P 500. They were never negative on the year. So selling them is basically fighting momentum in the market. So the Euro, think of it the same way. Long while above this area. Just let the price shake itself out of bed.
U.S. Dollar versus Swiss Franc
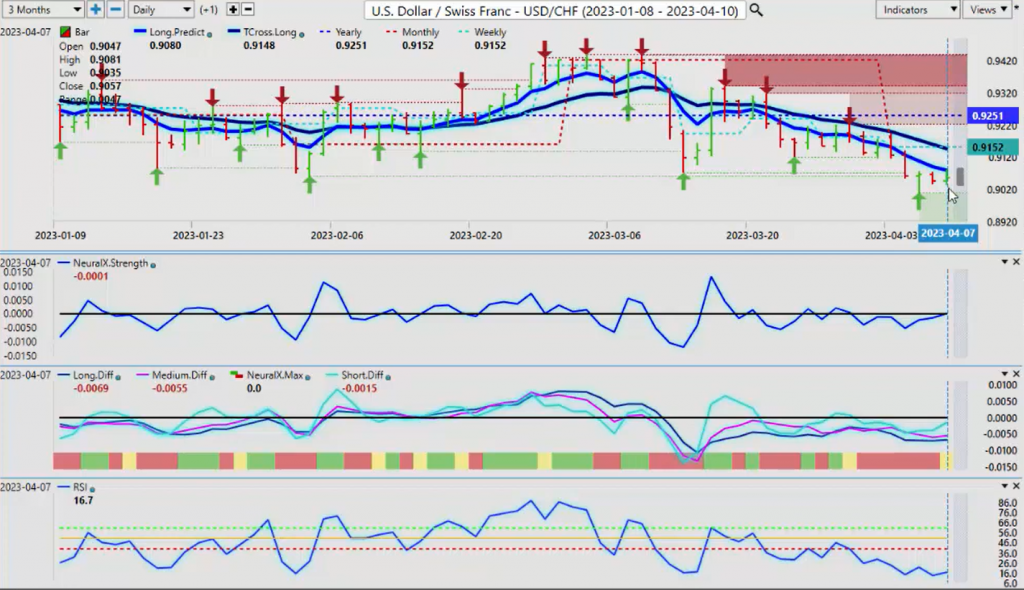
Now if the dollar does recover and starts moving higher, then US/Swiss Franc will likely follow. We have a newly formed verified support low that’s coming in around the 90 cent mark. But again, my view hasn’t changed on the dollar that it will struggle this year. Risk on, risk off doesn’t even seem to matter as much for the dollar anymore because money is going into Bitcoin, it’s going into gold, it’s going into the Swiss Franc, it’s going into the Japanese yen. They’re bypassing the dollar here. So again, if the dollar has a short-term recovery, then likely this pair will too. But it would also likely be a retracement. To our TCross Long, that comes in at .9148. In order for a new trend to form, we need to break above that level at the very minimum, but we’re still below the yearly opening price at .9251. That’s a major problem.
British Pound versus U.S. Dollar
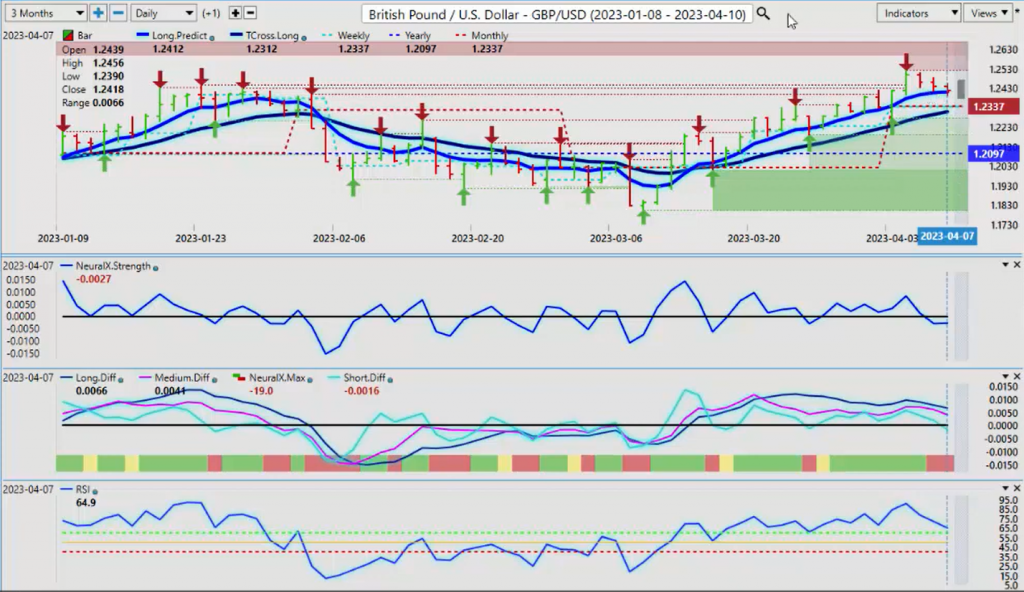
Now with the pound/dollar, once again, the pound/dollar getting a little toppy up here. So a retracement is perfectly normal. Fibonacci is one way of looking at replacements, maybe not the best. It’s up to the individual. But the predicted moving averages give us a line in the sand, the monthly opening price, the yearly opening price. These are price action based indicators, and then combining them with the predicted indicators. This points to, again, a different way of looking at the market. So right now the British pound is bullish. We’re above the yearly opening price. We’re above the TCross Long. But the bulk of the support for next week is going to be sitting on the TCross Long at 1.2312. Then we have the monthly opening price at 1.2337. So this area will likely be challenged by early to midweek, but then I would look for a reversal back to the upside late week. But keep a very close eye on that dollar index because obviously the pound will be affected by that.
U.S. Dollar versus Japanese Yen
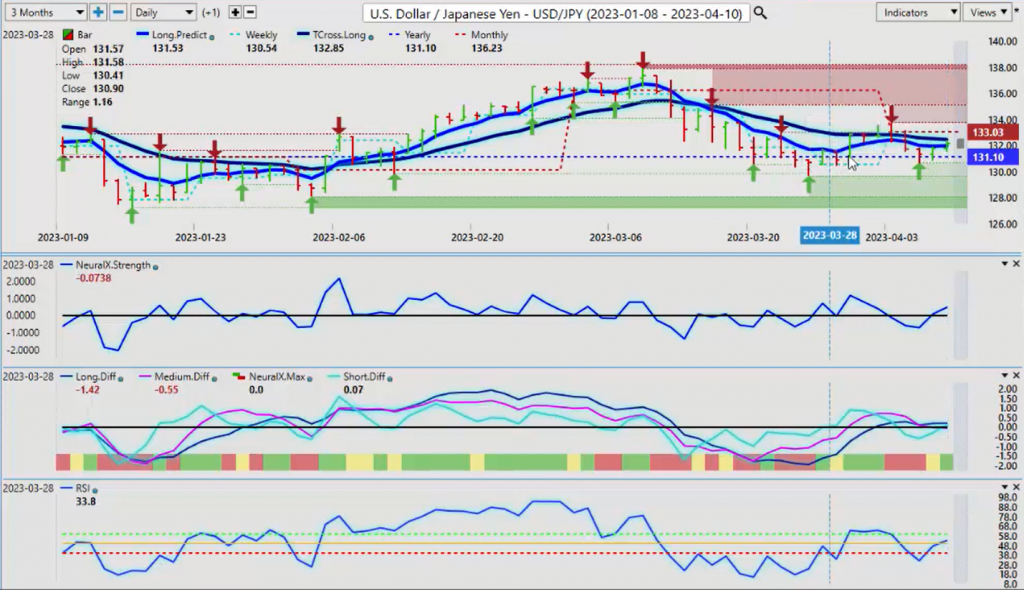
Now, last week we saw basically a sideways week on the dollar/yen, but once again, you can see that the dollar/yen is struggling to turn negative on the year. Now you’ll see all kinds of different things out there. It’s bullish, it’s bearish. This constant push/pull. “My indicator’s better than your indicator.” Guys, the yearly opening, 131.10, if the dollar/yen can hold above this level, then it remains positive on the year. The overall range is something we would be very mindful of. That lower end of that range is 127. Again, if you cross reference this to the dollar index, you can see it clear as day, it’s almost exactly the same. The low is 100.82, and the high point that we would be looking at would be approximately 105.88, where we were strong sellers, both in the VantagePoint live training room and here in the AI Weekly Outlook. We need a sustained break of that area before we continue to buy dollars, which of course we didn’t get. So as long as you’re identifying these zones, then you’re ahead of the game is what I will say.
Combining the indicators, combining price, inner market correlations, predicted moving averages, and then bringing in our shorter term indicators like the neural index strength and the neural index. We’ve got a rising predicted RSI above the 50. Breaks above 60, we should see some momentum, but we’ve got to break through the TCross Long. That’s coming in at 132.46. This is a major hurdle to break through. If we can get through it, then we should be able to start moving back up again. But any kind of risk off scenario, money will go into the yen in my respectful opinion, not the dollar. That’s what we’ve been seeing.
U.S. Dollar versus Canadian Dollar
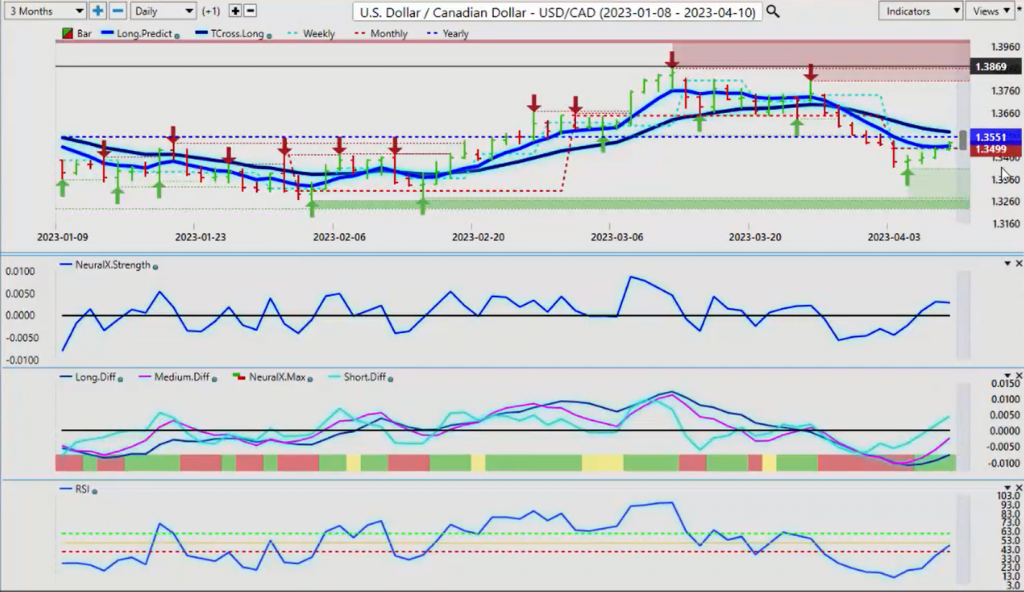
Now, the additional equity based currencies, your CAD, your Aussie, your New Zealand for next week, these are ones we need to keep an eye on also. You can see that the CAD is starting to reverse, but the overall primary range here. Our low point, 1.3263. Our high point, 1.3862. We’re smacked dead in the middle of this thing. So we’ve got to be a little bit cautious. But there’s our yearly opening price, 1.3551. If we can break above that and the TCross Long at 1.3575, then the US.CAD will continue its uptrend. But again, it’s very important to identify whether something is positive or negative in the current year, not on a rolling year or rolling dates. This is a lagging tool, lagging misleading indicators. Be careful with that.
So if we turn positive on the year, we would be buyers. But right now, the VP indicators are warning that this is going higher, our predicted differences, our neural index, our neural index strength. We’ve got a rising predicted RSI, but still below the 50 level. So again, this very likely could just be corrective in nature. If we get further broad dollar weakness going into late April and May, my optimism is still guarded on that because I don’t trust the Fed. One word from the Fed and the dollar goes to the moon. So be cautious with that. The main thing is know your levels.
Australian Dollar versus U.S. Dollar
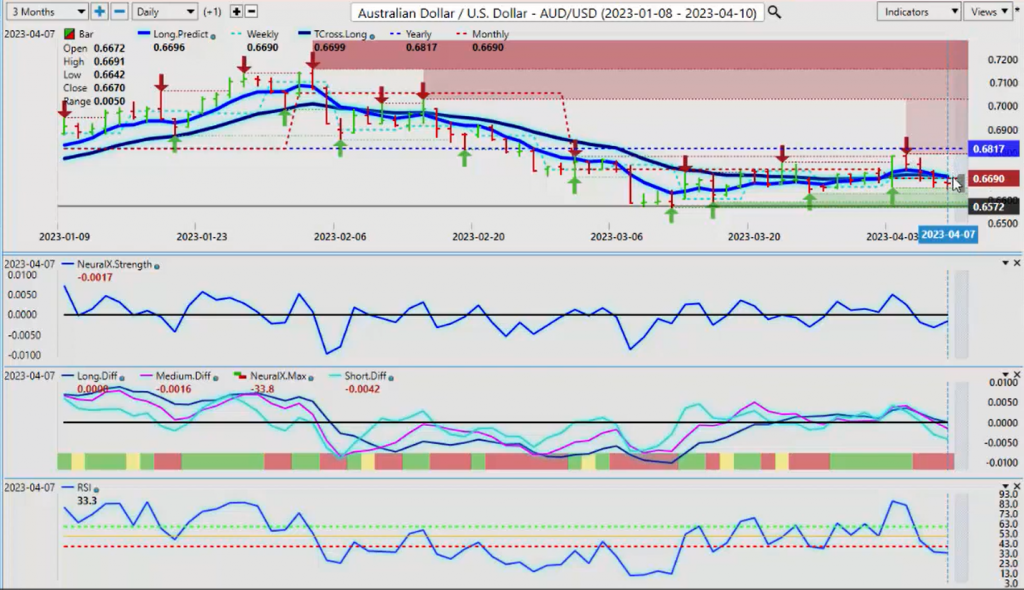
The Aussie, same thing, will follow. If stocks continue to advance, then the Aussie will go higher, US/CAD will go lower, New Zealand/US will go higher. But right now, the Aussie is a leading indicator for the S&P 500, the SPYs, some of your other stocks, and it’s warning us that okay, things may not be is how they appear with the major stock indexes. So again, we’re turning lower. Keep a very close eye on this. The yearly opening price, .6817, but our TCross Long is far more important at this stage. That’s coming in at .6699. We need to break above that so we can target .6817. Another viable strategy is tagging limit orders just above the VantagePoint TCross Long. So if the market starts moving higher aggressively, you can have a limit order sitting there waiting to trigger. Very, very good strategy using the VantagePoint software because these levels are not lagging, they’re not moving, they’re stationary. So we know where those are. When the market breaks above them, then we’ve got an opportunity to make some money.
New Zealand Dollar versus U.S. Dollar
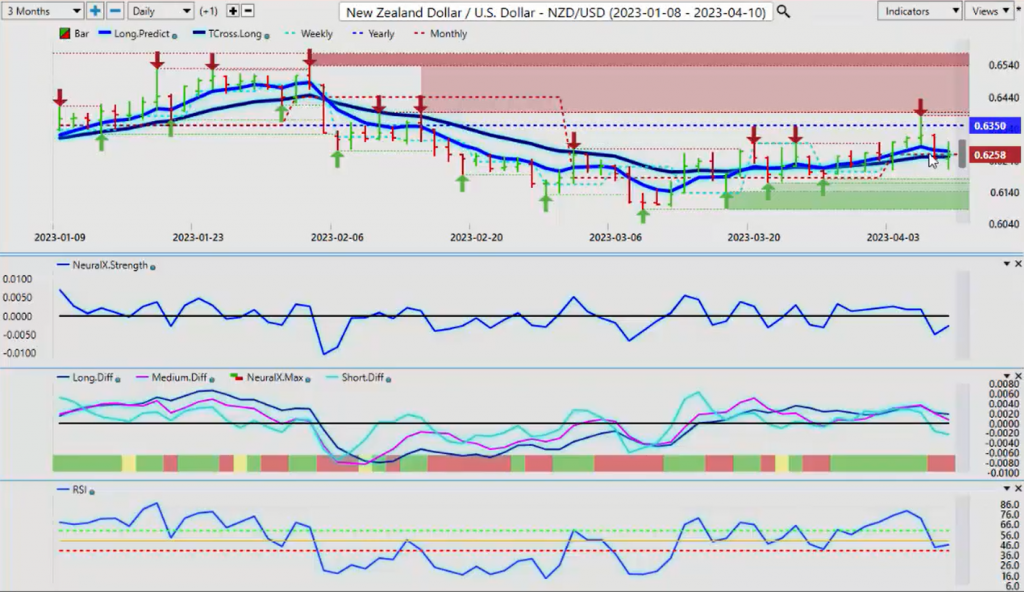
I would argue something very similar with New Zealand, but New Zealand is clearly the stronger of these two. I think they’re at about 5.2 interest rates now, 5.25 interest rates. So the Kiwis the stronger, but it’s struggling here also. Now it’s holding above a TCross Long .6250, but only by about eight one-hundredths of a cent. So not overly strong, but the indicators are very mixed. We’re not breaking down below the 40 level on that predicted RSI. The MA diff cross is definitely concerning here. We’ve got a reverse check mark on the neural index strength, but that’s pointing towards a move to the upside. So once again, we’re going to have a very choppy week next week. We’ve got some more inflation data coming out. But remember, we’ve got a bank holiday on Monday, so it’s still going to be another holiday short week. So with that said, this is the VantagePoint AI Market Outlook for the week of April the 10th, 2023.