The Hot Stocks Outlook uses VantagePoint’s market forecasts that are up to 87.4% accurate, demonstrating how traders can improve their timing and direction. In this week’s video, VantagePoint Software reviews forecasts for Range Resources ($RRC), H&R Block ($HRB), GrubHub($GRUB), American Semiconductor ($AMSC), and First Solar ($FSLR).
Register for a Free Live Training
Hello again, traders and welcome back to the Hot Stocks Outlook for May 21, 2021. Hope you’re all having an excellent week out in the financial markets, and as always, plenty of opportunities to cover in today’s outlook. So we’ll start out here with shares of Range Resources. We’ve also got H&R Block around tax season here at, Grubhub, American Semiconductor, and lastly here, First Solar.
So starting out with shares of Range Resources, really good example of how all of these forecasts work really regardless of the market that you’re trading. What we have here is daily price action so each one of those candles there represents a full and complete trading day and right up against that price data, you’re going to see that there is a black line and also a blue line there. Now the black line that you see there, that is a simple moving average. So that’s a very common technical indicator. In this case, it’s going to look back over the previous 10 close prices, add those all together, divide by 10, and you get a good rolling measure of where market prices have been.
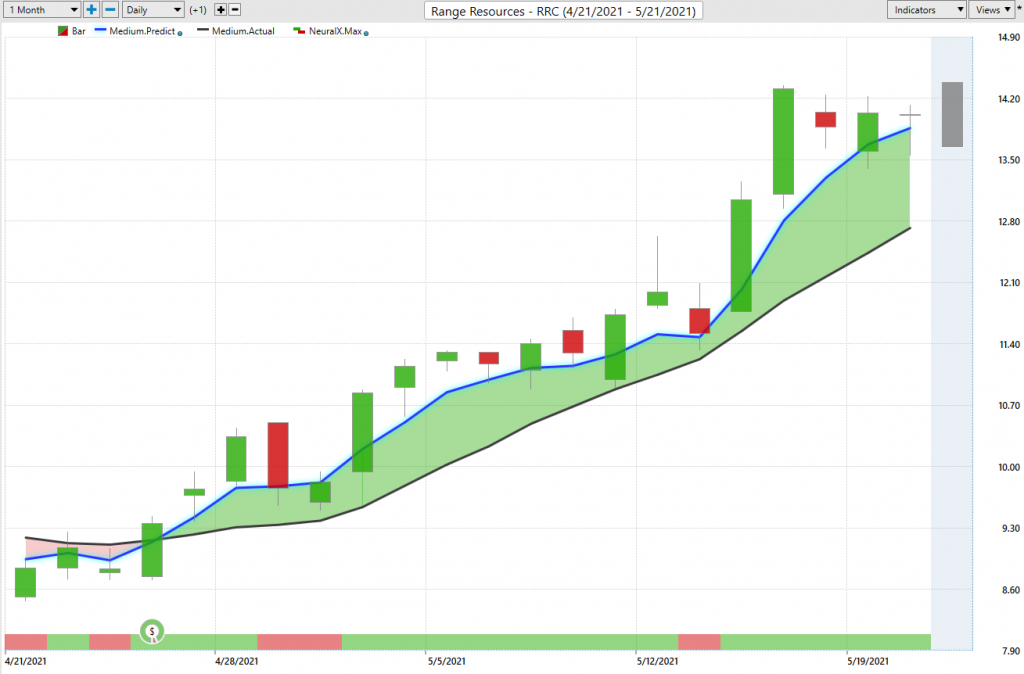
But obviously traders need to understand, “Well, where are things going to go moving forward so we can be ahead of that move?” So what VantagePoint traders are able to do is compare the value of that black line to this blue line. And for that number to get plotted and calculated against the chart every single trading day, VantagePoint is utilizing its technology of artificial neural networks to do what’s called intermarket analysis. So what that means is specifically for Range Resources, the technology has identified markets that are known to drive and influence future price.
Now that can be things that has positive correlations, inverse correlations, those can be leading or lagging relationships. And that’s what the technology is able to do is look at those huge amounts of data, how all these things are playing against each other, and actually use that to understand how these intermarket relationships are affecting future price. So what the software does is take that information, generate an actual true prediction of what’s likely to occur in the future. And take that value of that prediction to actually build it into the value of these indicators turning what was lagging indicators that are really just getting dragged around by whatever’s already occurred in the market into a forward-looking predictive tool.
And so what we’re able to do is whenever we see that blue line crossing above the black line, it’s suggesting that average prices are going to start moving higher. Now, that is just one component of this technology being applied to market forecasting. So this is generating this predicted moving average. So it’s able to give us really a very early indication of trend change in the market and let us know where average prices are more likely to gravitate towards in the future.
Now, if you look at the very bottom of the chart here, you’ll see that you have a bar and this can change from green to red every single trading day. And of course, it gets updated at 6:00 PM after every single trading day and it’s forecasting for the next trading day. But what it’s doing is actually again utilizing that neural network technology, but this is tuned to look ahead 48 hours, so very short-term strength or weakness in the market. And actually it has an aspect of volatility. So it looks at the highs and the lows and the close of the trading day. And that can warn you of short-term strength or short-term weakness over that subsequent 48-hour period.
Now, this is really helpful when you have that directional bias it’s very helpful to know when potentially short-term weakness is coming into the market. May be a great opportunity to potentially buy on the dip, but more importantly, understand, look, don’t get out of your position if the trend is still up you may need to deal with a little bit a weakness, but you expect it and then it can potentially manage that opportunity better.
Now to round all this out as far as the core VantagePoint forecast here, if you look at the very right of the chart again, you’ll see that there’s a predicted high and a predicted low. And again, this neural network technology is really ideal looking at huge amounts of data, then tuning it to try to solve a problem, in this case, what sort of timeframe are we looking at to try to get an accurate prediction? In this case, we have an intraday so predicted high, predicted low levels derived via that neural network process, a 48-hour indicator and the overall trend.
Now we can look at this and say, “Okay, well, if you’re looking at Range Resources and see this crossover come to the upside, well, then you’ve got a roadmap, every single trading day, that’s going to let you know, ‘Well, how do you want to be actually trading this market?” And so what we’re looking at here is the actual predicted high and low forecast against the actual market day. So what will happen today is a trading day will fill in here and we’ll see how accurate today’s predicted highs and lows are. But you can see that once you identify that trend and say, “Okay, I want to be long in,” in this case, Range Resources, whatever the market might be, you have this roadmap because all of these levels that you’re seeing here regenerated before the trading day occurred.
So before that candle occurred, so you have all of this information that lets you know, “Look, you want to be a buyer down at these predicted low levels if you want to go ahead and take this long position.” And you see, it really gives you the great opportunity as well to potentially buy the market back here and use those profits to add to the position and really make a lot of money as that trend continues as you’re utilizing those VantagePoint forecasts. So this is really the key here is having a tool that’s able to adapt to changing market conditions. It’s able to look at how are those intermarket relationships affecting future price. And we’ve seen how important this has been when the dollar starts moving around, when the gold market starts moving around, oil. It’s going to have a rippling effect through all of these individual stocks.
We want to make sure that we’re able to take advantage of that. So when the big macro market starts pushing markets around, it’s only really benefiting the stock trades.
Here’s H&R Block seeing this crossover to the upside, exact same approach, same tool, same everything, a lot of strength from the Neural Index. Then you get this roadmap. So you may get some weakness from the Neural Index. You see for a day here, you may see some lower lows over the next 48 hours. You see here, Neural Index goes bearish, lower lows over the next 48 hours. But the overall trend in that blue line still very much above the black line, that distance between the prediction of the moving average and the actual moving average.
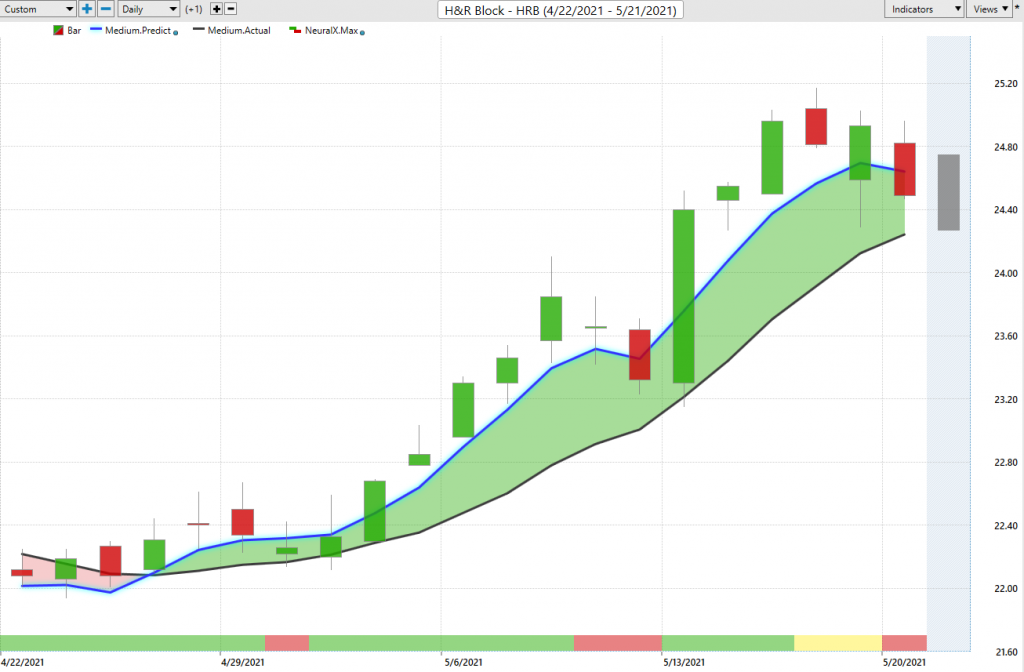
And once again, we have that roadmap that says, “Okay, well, if we’re coming in every single day, where are we actually looking to be a buyer in these markets?” And you just see how effective this not to be chasing the market or dealing with things when the market’s just running sideways, and really get on these kind of lower parts of the range here to really experience the overall trend as it continues higher here. So not as big of a move as we have here in Range Resources, but another nice opportunity nonetheless, about a 12% move in the past 17 trading days.
And moving on here, we’ve got Grubhub. So I wanted to bring through again, it’s been a very interesting market. We saw last week going into Wednesday, huge sell-off in the market. There’s been areas to be short, but what happened is all those markets actually got oversold. We see a lot of them start to bounce higher, and that created a ton of actually really bullish opportunities going into last week. So going into to the Monday really, going into this week actually. And it’s been a very interesting environment, but with the help of these VantagePoint forecasts, you’re really getting the best of it here.
So here’s Grubhub. You see this crossover to the upside saying, “Okay, well over this period, sure, go ahead and get long really spotty price action here, but still a good area to go ahead and be long there.” But more recently, very clearly sort of like Intel we looked at the other day, there’s some areas here where you clearly do not want to be long in the market. You can hedge that portfolio if you do have some long positions and take some shorts and it’s been a very profitable period where we’ve seen a lot of volatility and that’s exactly what traders need is a lot of volatility and movement in the market.
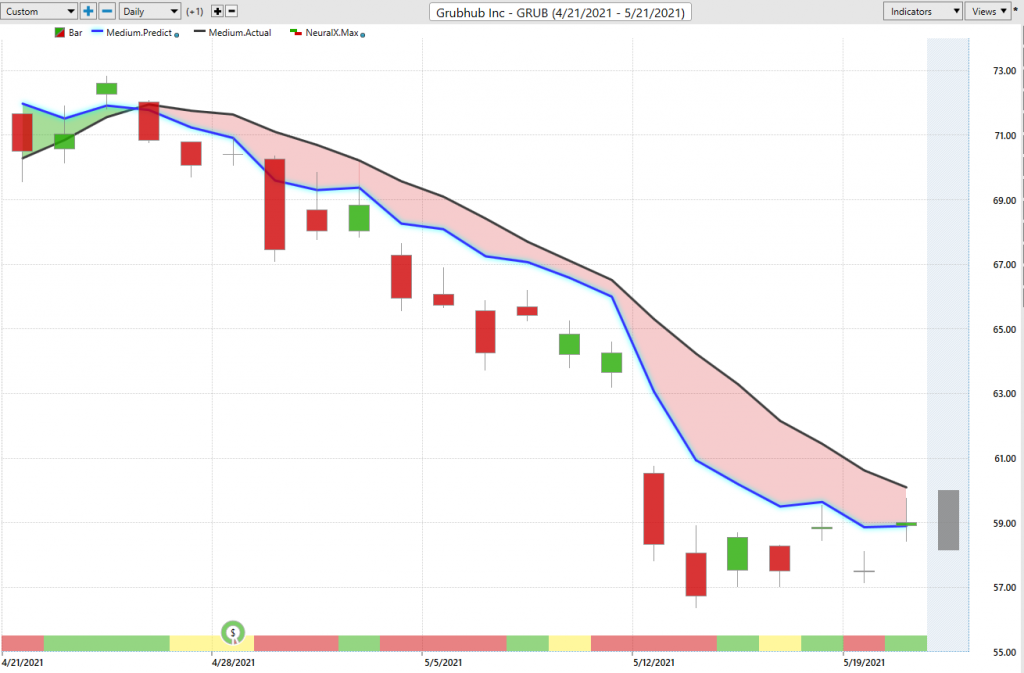
Again, you see here, this market moving down about six or seven entries as that downtrend continues there. But again, this is one of these areas where you see how you’re already positioned to really benefit from that aggressive weakness we saw in the middle of last week, but you’re already up five, 10% on the trade. You can trail your stops, take it very easy and then that volatility is really a benefit to you. Here we see shares down 19% in the last 18 trading days. And this is really what I want to highlight here in today’s video is there’s been a big shift in the market.
We had a lot of situations where, like I mentioned, before that big sell off on the Wednesday you were seeing crossovers to the downside Monday and Tuesday, so I’m going to look, there’s a big drop coming here, get short, if anything, start a trend trade, potentially trail your stops from there. But two days later, the VantagePoint software’s producing a lot of opportunities to the upside and it’s very specific. You get a lot of correlation in the market. And so you really want to identify these areas that are starting to reverse, that you can focus in on and pay attention to, and then use the guidance of those predictive forecast to buy at predicted lows, manage the trade, do all the things that we’re talking about in these other examples here.
American Semiconductor ($AMSC)
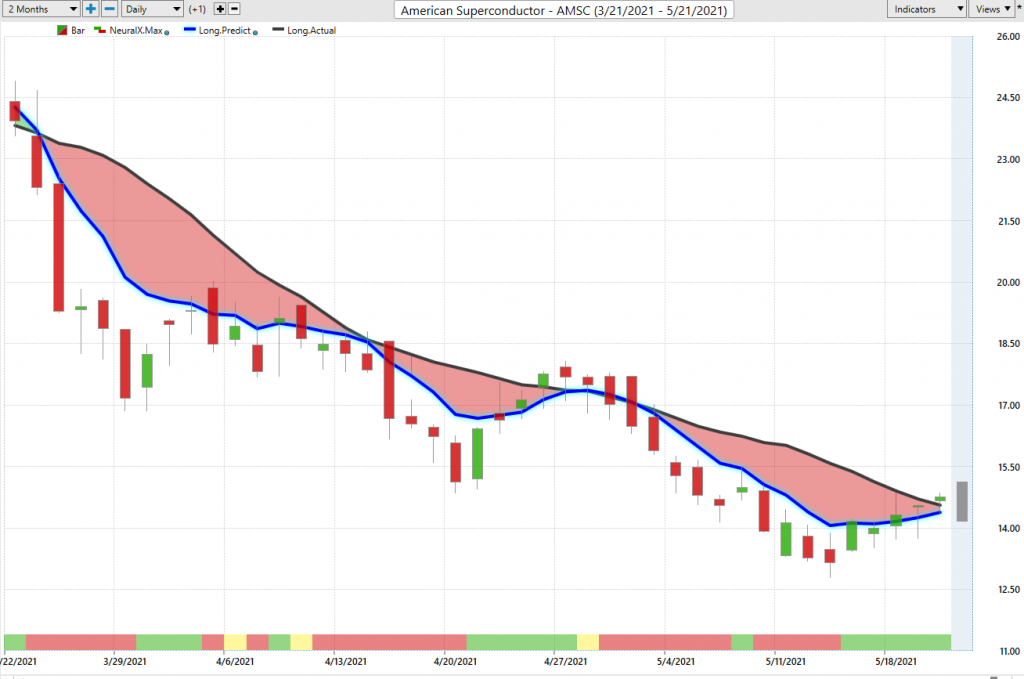
So here’s American Semiconductor and what I just want to highlight is we have a scanning feature inside of VantagePoint here that’s able to identify fresh crossovers between these predicted moving averages and the actual moving average. So when we get these signals we recognize not only in American Semiconductor, but there’s a lot of other areas in the market that something’s going on right here, and it’s likely to take up a whole group of markets if we see strength broadly across equities.
:
And you see here more recently, this is just this past week, this crossover to the upside, and then the help of those predicted highs and lows. And you see this, it’s telling you, “Look, be a buyer down here.” You get a little bit of volatility, but you’re closing right at that close level for the day, next day’s predicted low here, next day’s predicted low here. And with that strength from the Neural Index telling you that, “Hey, there’s strength here.” Look, short-term traders, this might be a place where you want to be target the predicted low, shoot for the predicted high. Trend traders, you’ve got a fresh start to a potential new trend, a new opportunity.
And like I mentioned, it’s really the scan and letting the tools help guide you to where are the opportunities opening up? And so there is American Semiconductor.
Well, in the same night that you’re doing your scan, pretty similar chart here for First Solar. We’d been in a downtrend. Very clearly, you didn’t want to be long in these areas, but these things will reverse. And you see this crossover to the upside, Neural Index bullish. It has remained bullish through the entirety of this week. So had you gotten long, it’s still saying, “Look, this still looks like it’s going to move higher.”
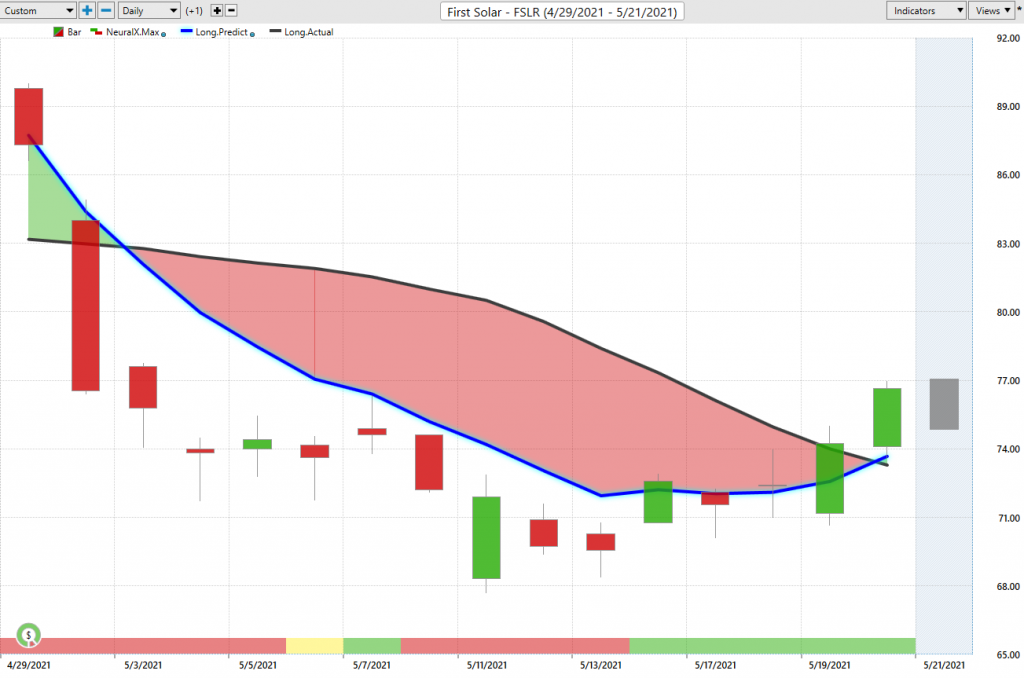
And again, the help of those predicted lows, so intraday. Before any of this occurs, you have an outlook that says, “On day one, look towards this predicted low. Day two, look towards this predicted low. Day three, over here.” So you’re getting that adaptive forecast. So regardless of what happens here, the VantagePoint software is going to look at those intermarket relationships, see what has occurred and then produce the updated forecast so that you can get the best of this opportunity, and of course manage the opportunity based on what’s going on out there because it’s been very critical as we’ve seen.
If you’re trading in tech stocks, it’s coming down to interest rates, the dollar, the broader futures markets, and there’s a lot of really great opportunities opening up to the upside and to the downside. But you really want that roadmap and guidance that says, “Okay, if you’re going to trade here, where do we want to come in? How do we want to manage our opportunities?” And like with Grubhub, if something shifts, if something changes, are we going to be made aware of it so that we can change that position, potentially reverse, go short and do what we need to do to protect that portfolio and protect our asset value?
So once again, this has been our Hot Stocks Outlook for May 21st, 2021. Thank you all for watching< best of luck out there, and bye for now.