The Hot Stocks Outlook uses VantagePoint’s market forecasts that are up to 87.4% accurate, demonstrating how traders can improve their timing and direction. In this week’s video, VantagePoint Software reviews forecasts for Prologis ($PLD), Gamestop ($GME), AMC($AMC), BG Foods($BGS), and Workhorse ($WKHS).
Register for a Free Live Training
Hello, again, traders, and welcome back to the Hot Stocks Outlook for June 4th, 2021. Hope you’re all having an excellent week out in the financial markets. And as always, plenty to cover in today’s outlook and really a lot of exciting opportunities that we want to go ahead and cover here. We’re going to start out here with Prologis and we also have AMC and GameStop, as well as BG Foods and Workhorse.
And I just want to highlight with really every single one of these opportunities, what we’re going to highlight is a little bit of what we’ve been talking about over the past couple of weeks, and that there was a big sell-off in the S&P 500. That happened on a Wednesday a couple of weeks ago. And as the market started to reverse higher and we’ve seen strength come through the S&P, you’ve seen where are those markets that are benefiting from that. And that’s where we’ve really seen some tremendous moves coming off of those lows.
This is really important. So looking here at PLD, what we have here is daily price action. It’s the same for any market you might be trading. Even if you’re trading S&P 500 futures, it all works off of end of day data. Right up against that daily price action, you’ll see that there is a black line and also a blue line there. Now, the black line that you’re seeing there, that is a simple moving average. We refer to it as the actual simple moving average.
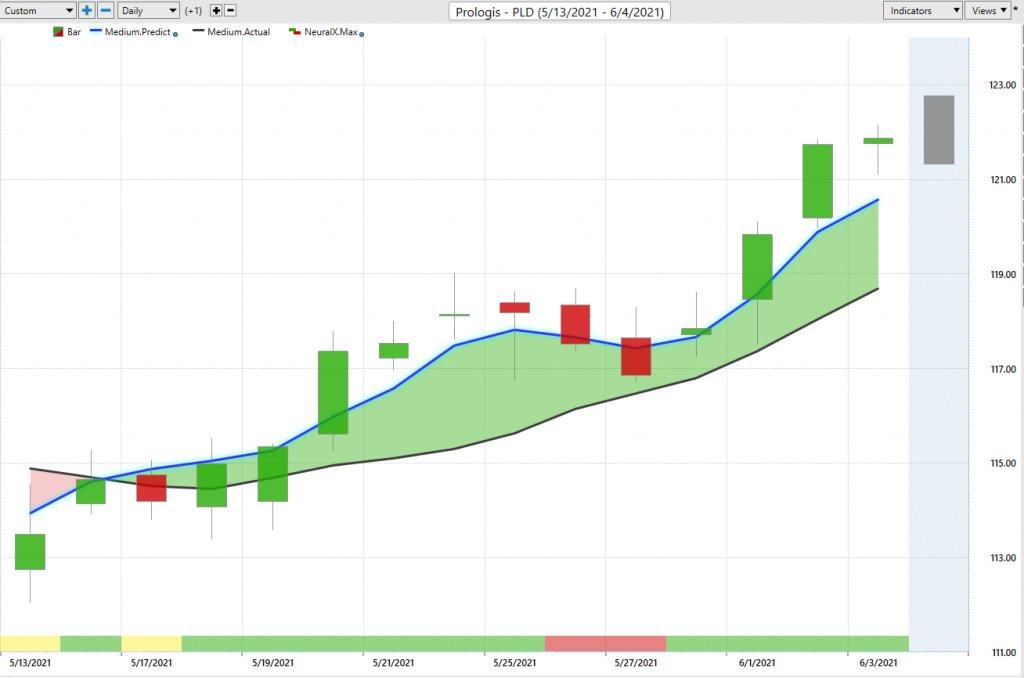
It’s a very common technical indicator, and it works very good to look back at the past and really smooth out the price data, letting us know where the market has been over a given period of time. But as traders, we need to be ahead of that and understand where are market prices moving forward. So to make that assessment, what we can do is compare the value of that black line to this blue value that’s plotted. And for that number to be calculated and plot it up against the chart, VantagePoint is utilizing the technology of artificial neural networks.
And they’re utilized in a way that’s what’s called… It’s doing intermarket analysis, meaning it’s looking at relationships between markets, looking at an unbelievably huge amount of data, learning those important market relationships that are significant to the target marketing question, so in this case PLD, and it’s able to understand, okay, well, what is the S&P 500 doing? What is the dollar index doing? What are interest rates doing? What are ETFs in this supply chain sort of area of the market doing? What are other related stocks doing?
And it’s able to look at those relationships, whether they be positive inverse relationships, leading or lagging relationships, and it actually makes a true prediction of future price. Now, this technology here is utilizing a lot of different timeframes and indicators to make that overall prediction, and that’s really what you need to understand here. But what we have here as far as this blue line crossing the black line, you can think of that as your overall trend direction.
It’s telling you that average prices, so this value being higher than this value, average price are expected to move higher than where they’ve been. Now, at the very bottom of the chart, you’ll see that there’s this bar that also gets updated at the end of every single trading day. 6:00 PM the night before, this’ll be either green or red. And what it’s telling you is actually it’s a measure of very short-term strength or weakness in the market.
So while the predicted moving average is a measure of average prices moving forward, we can obviously trade above and below those average prices, the neural index is a short-term prediction of short-term strength or weakness in the market. And by short term, I mean, 48 hours. It is tuned to only look ahead 48 hours. So every new prediction is, again, looking ahead over that 48 hour window and letting you know about short-term strength or weakness to help you deal with that volatility. Now, lastly, you’ll notice that there’s a shadow candle here, right?
And what’s going to happen is the trading day is going to occur and it’s going to fill in with the actual market data, and we’ll see how accurate these predictions actually are. But what we can do is we can look back at our previous predictions and see how accurate those were. What VantagePoint is allowing traders to do is understand, especially like we’ve had recently, you notice running your scans looking for these fresh crossovers via our intelliSCAN feature, that things shifted right here around 4/15 to 5/17.
There’s a weekend there, and that’s the weekend after the sell-off on the Wednesday. So you had the sell-off, market bottomed out, recovers a little bit on Thursday and Friday, but you’re getting those signals on Friday and through the weekend that this is looking like a very bullish opportunity in a lot of different markets.
You can decide, okay, where do I want to pick my spots? If you want to look for very high volatility, potentially very profitable opportunities, well, here’s AMC.
You can see that even a stock like this, which is driven by a lot of things going on in the internet, it’s benefiting off of broad-based market strength in the same way that the S&P has benefited over this same period. And as a trader, what that allows you is to get a good entry on a potential trend trade, and you see why that’s obviously so effective here. But we can look back again and say, okay, well, look at the entirety of the forecast here. One day you come a little bit outside of the range.
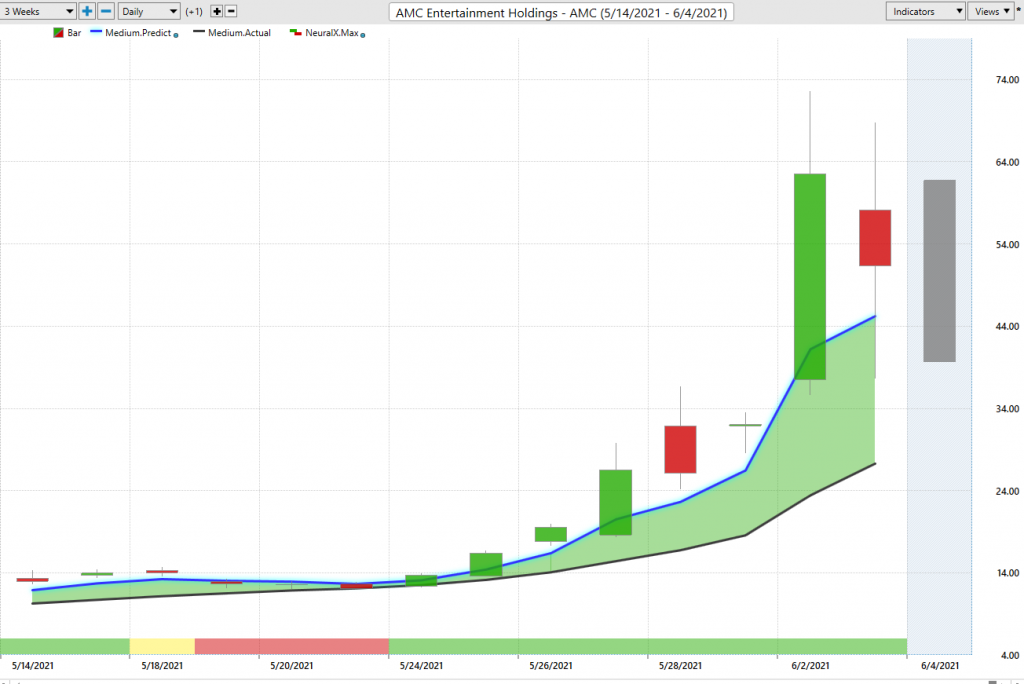
You’re tapping up against these predicted lows market pretty much just running sideways, and you see that breakout really start to take off. But you see here the neural index as well looking at these forecasts and understanding that, look, the overall trend is clearly to the upside, but it’s letting you know here, expect some weakness over the next couple of days. After this day, it’s pretty much off to the races and the market moving higher.
Obviously a huge percentage move here, but understanding that, look, this has been clear all the way back now 14, 15 trading days. Again, after that bottom out period, it was very clear that now’s the time to get bullish exposures to stocks. There’s potential for really great entries. And of course, VantagePoint will help you manage that as the time goes forward. So letting you know, look, the trend is still up. You still have these predicted levels coming through to help guide you and hopefully be around for the big breakout.
Here in GameStop, same thing. You see these crossovers coming through right over that weekend not just here, but broad-based. You’re seeing, well, this looks pretty strong. You see, you get these little dips in the neural index. The market runs a little sideways for a couple of days, but then things pick up and that breakout really starts to happen and things accelerate. These stocks are obviously on a lot of people’s radar and really exciting things to highlight here.
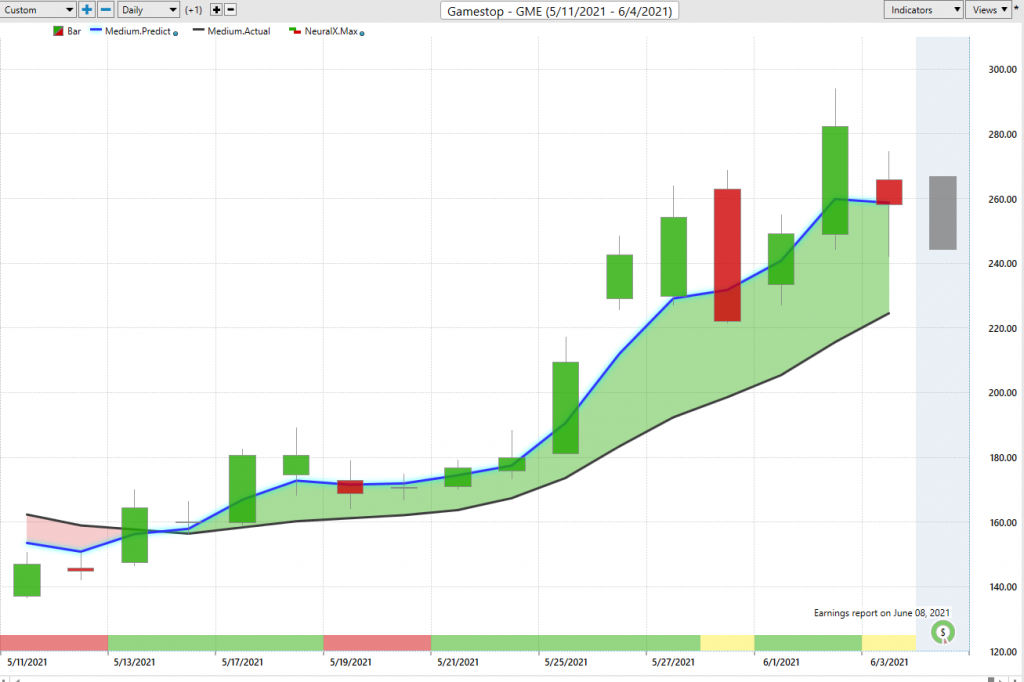
But when you have a tool like VantagePoint, it makes it very simple to say, okay, well, we can benefit from overall market strength. There’s high volatility potential here in these markets as well. And then I have a roadmap going forward that says, okay, well, I may get involved in the market back here, but I don’t know what the forecasts are going to look like here, right? You want that guidance continually after each and every trading day that tells you, look, the overall trend is still up. In this trading day, you want to buy down at these predicted lows.
On this trading day, you want to be having an order. And you see how this works where you have a down day, you close at the low, but you need to be buying on the weakness because this thing is ready to move higher there. It makes sure you get a good overall entry in the overall trend and, of course, benefit as much as possible while taking as little exposure as possible, right? So if we can get these positions on with as little risk as possible here, you see a 74% rally, 73 and a half, let’s call it, in about 12 trading days.
And again, it’s that same period of that sell-off a few weeks ago, markets bottomed out, and you just saw the whole market through this intelliSCAN feature direct you and say, look, things are looking fairly bullish. This is a good opportunity to come in as a trend trader and get some good entries and potentially trail your stops if you want to hold longer-term or just trade bullish over this period.
Here’s B&G Foods. Things run a little bit sideways here, but you had… A lot of markets will look at Workhorse.
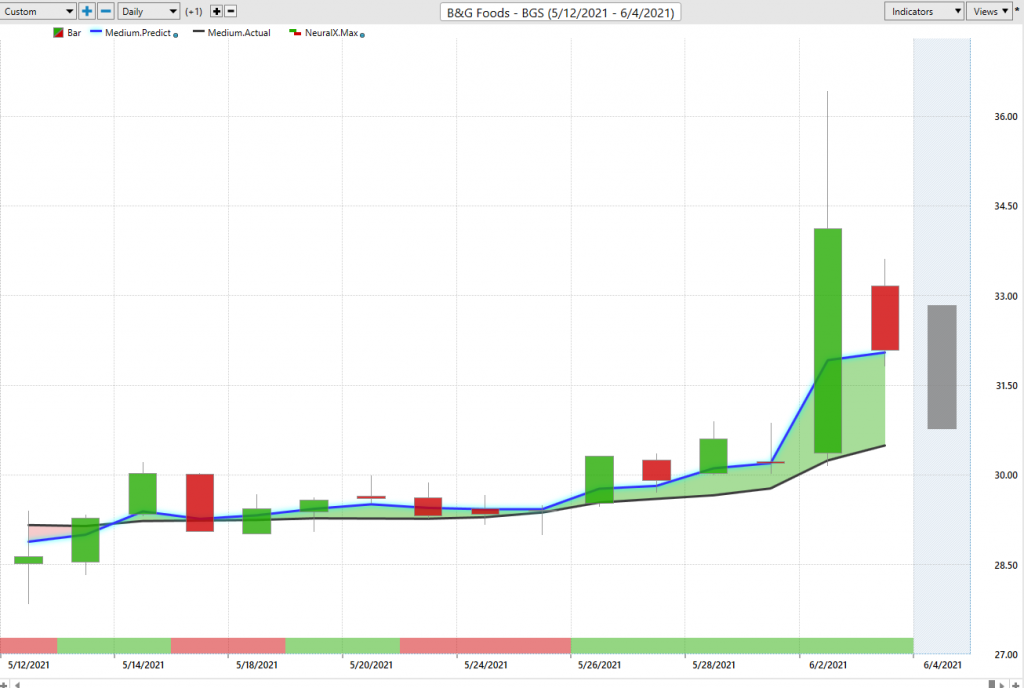
Some of these things were running sideways over this period. But you see pretty clearly that, yeah, you may get some weakness over these subsequent periods where the neural index is bearish, but that blue line is over the black line. You understand the overall strength in the market, and you see as a short-term indicators get bullish once again, the trend really starts to break out and things accelerate. And of course, you’ve got those daily levels as well.
If you’re that short-term as far as you’re thinking, you’re saying, okay, well, if I want to buy intraday, where should those entries be coming in at all, right? You see about one, two, three, four, five, six entries here before this thing really starts to move higher here. Good stuff like this.
When you have a neural index bearish here, you understand expect weakness over these couple of days, but down at the intraday predicted lows would be where you’d expect at least intraday or within that 48 hour window and would make sense to be a buyer as the overall trend is still bullish there. And then, of course, that context again, with all these markets, again, sharing a very similar relationship and all benefiting in a very similar way.
Here’s Workhorse Group and we’ve seen a lot of this. There’s also a Lordstown Motors.
I think the symbol is RIDE. But a lot going on in the non-Tesla electric car areas. You’re seeing these stocks, again, benefit from the overall strength from that bottoming out in the S&P. But specifically, where are the stocks where I want to be over this period of time? Well, it’s this whole crossover periods, 5/14, 5/17, that weekend. I started saying, look towards these fresh crossovers that are coming through for new opportunities to the upside. And again, you see that neural index gets bearish here.
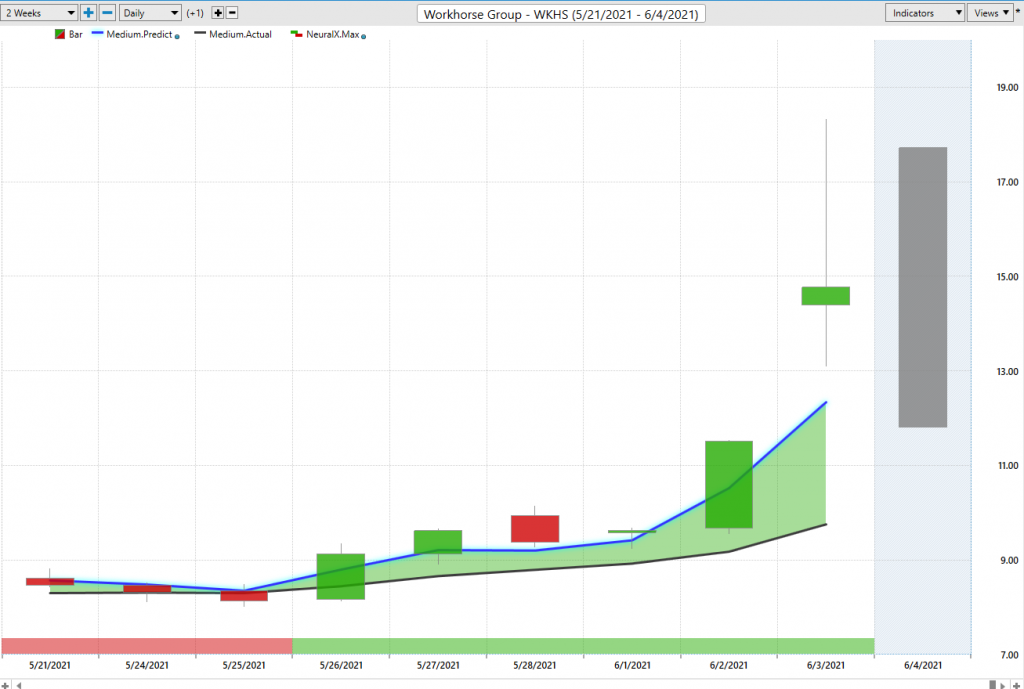
We get some weakness over these days, but that blue line is still above the black line and the overall trend still very much to the upside. We’ll take a look, of course, at those predicted highs and lows. And again, the guidance of saying, okay, well, where am I going to be a buyer at all in this market if I’m looking towards predicted lows? We don’t quite hit it there and don’t quite hit there, but still the effectiveness of understanding that this is where you want to look for prices to participate in the upside and these things have sort of popped again.
It’s a very advantageous time to have entries at such good levels, right? You can take profit along the way, use your predicted highs and things to help guide you and hopefully get some cheaper prices if you take some profit predicted highs, but understanding that a lot of these markets are very bullish. The trends are up. You want to be long, and this is a great way to benefit from those market correlations. This is, again, just what I’m trying to help people understand here.
We’ve got five different stocks, all different areas of the marketplace, some of these things meme stocks driven by who knows what. But what’s going on behind the scenes is you see a very similar pattern and that has to do mainly with things like the S&P 500, the NASDAQ, the big indices, but also, again, those subtle relationships that are happening in ETFs, the individual stocks.
That’s what’s helping these very short-term forecast really get a hone on this and help you with those subtle relationships that are important and meaningful and going to affect the markets that you’re trading. Once again, this has been our Hot Stocks Outlook for June 4th, 2021. Thank you all for watching. Best of luck out there in the markets. Thanks again and bye for now.