Welcome to the Artificial Intelligence Outlook for Forex trading.
VIDEO TRANSCRIPT
Hello, everyone. Welcome back. My name is Greg Firman, and this is the Vantage Point AI Market Outlook for the week of September, the 6th, 2021.
U.S. Dollar Index
Now, to begin this week, we’ll begin where we always do with the US dollar index. I’ll highlight the indicators being used. In this particular presentation, we’re using bars, not candles. The predicted MACD, the predicted short, medium, and long-term differences, which we will discuss shortly. The neural index, the predicted RSI, the triple cross, and of course the very, very critical verified support and resistance zones. Now, when we look at the dollar going into next week’s trading, once again, I think it’s highly likely that that number was leaked prior to the release.
But with respect to that number, it was nowhere near as bad as what they suggested. The U6 number is going back to pre COVID levels. There’s some real positives in that report. But what I am the most impressed with here is the ADP report is finally getting closer to the actual employment numbers. They only missed it by about 100,000 jobs this month. They were still wrong on the revisions. Again, this tells me that the labor market is going to start to normalize to some degree as the government checks, I believe in the US, are going to stop rolling this month. People should be going back to work, which again, all benefits the US dollar.
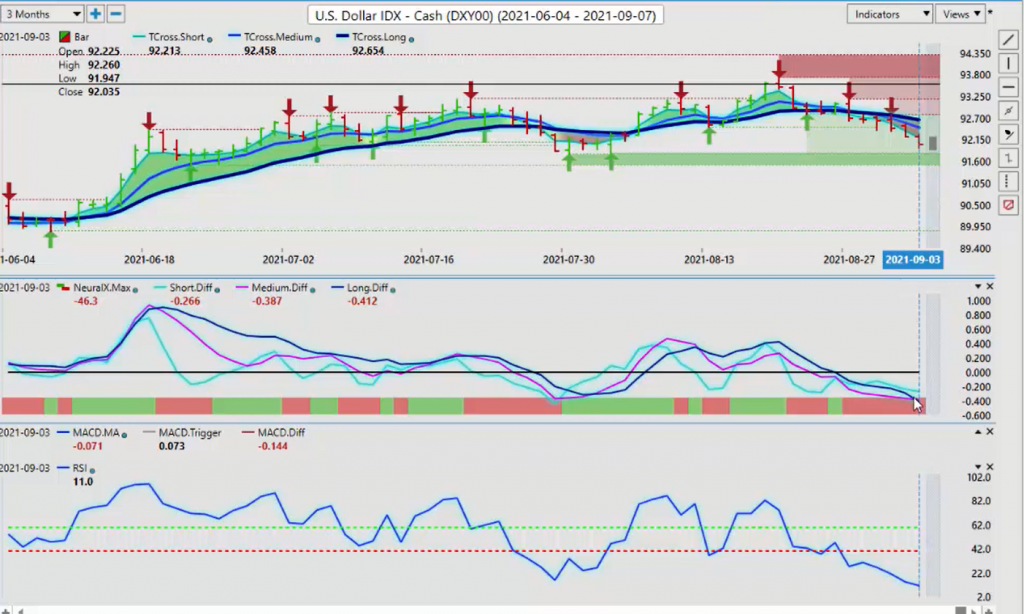
When we look at the current signal in the Vantage Point software, because again, this is an outlook, not a recap of something that already happened. We look to predict what the likely outcome is going to be in several markets for next week. We can assess here the medium-term crossing the long-term predicted difference is starting to turn back to the upside, warning of dollar strength. Now, bear in mind, we’ve been in summer trading. We are just at the end of summer trading and we are going back to normal trading starting next week. It is a holiday short week, so be very careful on Tuesday. Wait until mid-week. With luck, prices settle. But right now, this is pointing towards dollar strength.
We have a verified support level of very close by at 9178. I suspect that this level will hold. But either way, whether it does or not, we can clearly identify that particular level and have a buy signal, whether it be corrective or a new trend signal, it is forming. If that buy signal forms, the medium term crossing the long-term difference, which again, we’ll talk more about in a minute. We’ve also got our predicted RSI that is basically running out of steam to the downside here. We’re losing momentum, 11 on the predicted RSI. When we combine the verified support zones with the predicted RSI in a heavily oversold, a buy signal forming on the medium-term trend, then we would look for a recovery after one more push to the downside.
Gold
Now, once again, when we look at the additional markets that are correlated to this, the first one would come up … There’s two that’ll come up, but I’ll start with gold. When we look at gold, nothing has changed here, guys. We’re still at the level that we’ve discussed for the last several months. We cannot get past this 1835 level, or 1833. We’re stuck here. Again, when we look at this particular move, it’s unlikely we’re going to see any significant upward move in gold, unless we can clear this verified resistance zone. Now, regardless whether we have, for example, a medium term crossover. This is one of the most generic basic forms of the Vantage Point software.
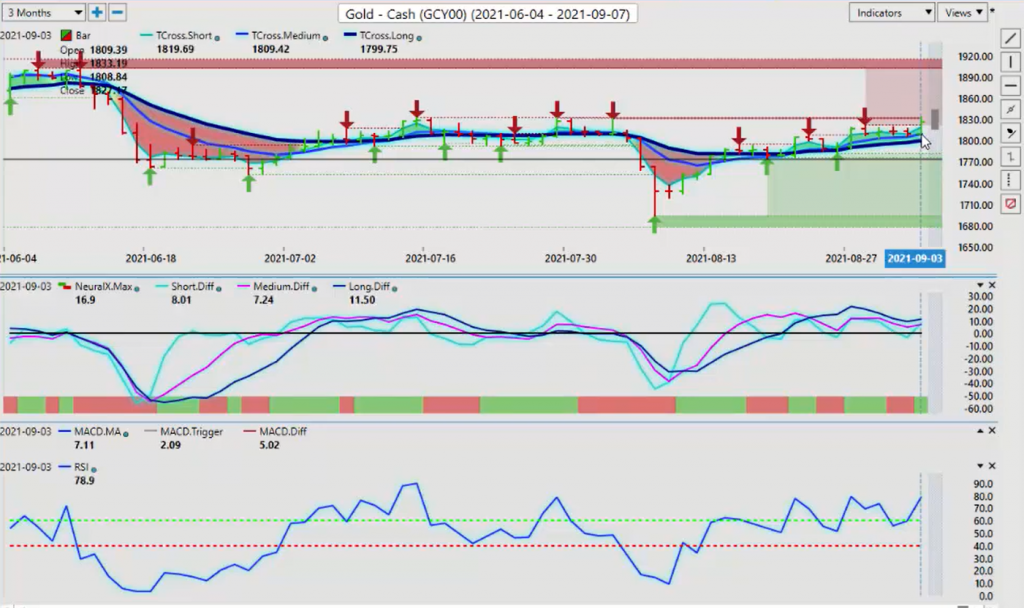
This signal took place a considerable period of time ago. Again, we don’t focus solely on that crossover because, again, when we look at this, our medium term crossing our long-term predicted difference over here is yet to cross back to the upside to tell us, okay, we’re safe to go in for long. But when we look at the resistance building in this area, again, we must break free and clear. I would respectfully submit that gold wouldn’t even even be at this level unless the market, at least on a short-term basis, viewed that labor report as negative, where, yes, there was negative parts of that labor report, but there was also some pretty strong positives.
The U6 really is the number we want to keep our eye on, and it dropped significantly. Again, when the government check start rolling in next month, we should be able to start normalizing the labor market in the US, which is actually a positive for the US dollar. If it’s a positive for the US dollar, it’s not a positive for gold. But we will continue to monitor this level. But how, in most cases, I will play this is I need two consecutive days in a row where we close above 1833, and we stay above this level. Because again, a lot of retail traders get caught in buying too high or selling too low thinking that there’s going to be a breakout based on that labor report, when in actual fact, that’s very unlikely.
But it’s possible but unlikely. For now, we continue to monitor this. Vantage Point is saying we do have a little bit more upside in gold. But once again, when we click on our F8 here, this is the level you want to watch to begin the week. Tuesday, Wednesday, and Thursday, the long predicted 1811. We need to hold above this particular level. Again, an excellent straddle play is that if you do not want to get long on this thing and you’re in agreement and saying, “Okay, I think it is going to go short, but there’s going to be volatility,” then you can stay out and put your limit orders to sell gold just below 1810.
When the market breaks, inevitably, which is very likely, a high probability, breaks down below that level, you’re sitting there waiting to pick up that gold short.
Crude Oil
Now, once again, when we look at the additional markets here, light sweet crude oil, we talked about this last week. Once again, when we use our point and time indifference, which is very, very important. If we look at our Vantage Point indicators, we can go over here to our open price here. Let’s just come down point in time. Excuse me. We apply the point in time indicator, and then what we’ll do is we’ll modify this point in time indicator.
When we come up to here, and again, it’s a very, very useful because it really does allow us to see the real price. If I change this and I go to the week, and then I’m just going to change this here to color-wise so we can apply it, and then we’ll hit apply to all here, we can really see what actually happened with light sweet crude oil last week. Now, once again, the VP AI Weekly Outlook from several weeks ago, this was your long trade on light sweet crude oil and anything related to light sweet crude oil. When we look at this, you can see on just one contract. Now, bear in mind here, guys. Okay?
That with that, you’re only required to use a maintenance margin, which would be about 5,000 or so, to take this particular contract. That produced 11% in eight days off of that MA diff cross, $7,310 in profit. But again, as I had stated in last week’s Weekly Outlook, most of your less experienced retail traders or advisors or analysts, for that matter, they see this as a breakout play. When in actual fact, when we look at the open on week price, oil has been down the entire week. It’s done nothing. When we look at Thursday’s trade, when the OPEC release, it popped up here only the turnaround and give back all of those particular gains on Friday.
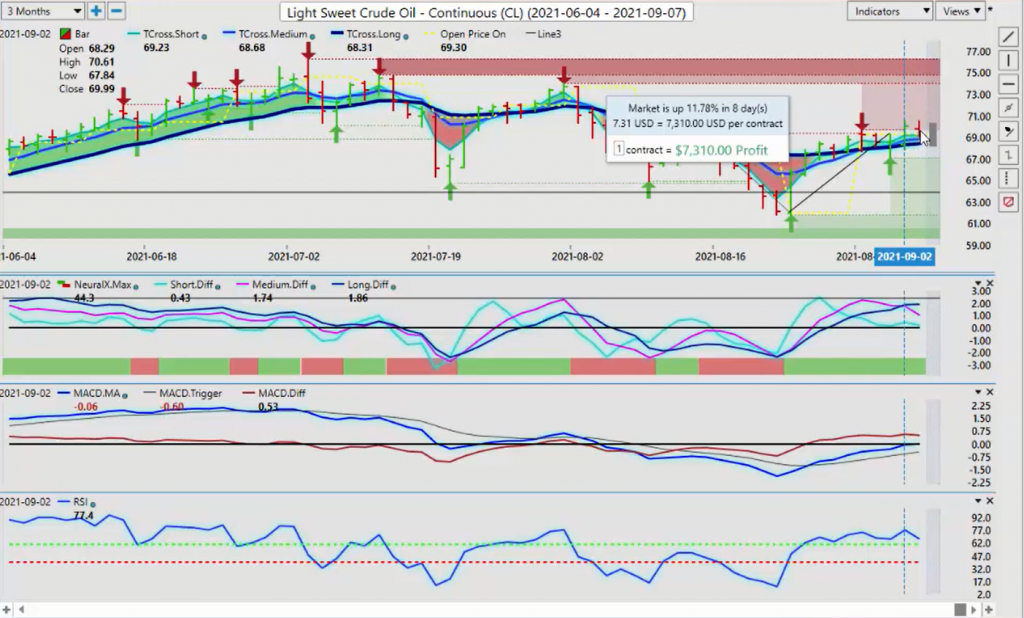
Now, again, what was warned is that, again, when we look at the signal here that tells us, look, we probably shouldn’t be buying a light sweet crude oil here, and we certainly shouldn’t be buying energy stocks related to it because there’s a very, very high correlation. When we look closer at this, as the market has moved up, the Vantage Point at medium term crossing the long-term predicted difference has told us don’t buy this here. Again, we must make sure that we’re utilizing all of the Vantage Point indicators, not just some of them, because again, that can be misleading. When we combine the indicators, first of all, we assess that oil has been down the entire week.
We had one big move up, that I’m not even really sure I would call that big, but it came off of the T cross long at 6831. On that OPEC announcement of refusing to increase oil production, oil pops for a few hours, and then the next day it gets hammered lower, even though we had US dollar weakness. Now, again, we’re going to look at that in a minute from an inner market standpoint. But first of all, we’ll look at this versus stocks and see which is the better play here. When we look at this again, and we click on our very generic medium term crossing our long-term predicted difference, we can see, for example, on Callon Petroleum, CPE, this is a very small, small move.
Again, it didn’t clear the verified … You have the same verified resistance high at 3510 on Callon, as you do on light sweet crude oil. You have the same medium term crossing the long-term predicted difference telling us that there’s probably not a trend change here, and this is likely a false move. Again, when we talk about this, it’s a relatively small move on this stock of only $3 and 25 cents per share, which is about nine, little under 10%, but 500 shares at $1,625. Bear in mind here, guys, stocks versus futures, in this particular case, you’re going to have to put out with most brokers, unless you’re on margin. You’re going to have to put out $15,000 of your own money to buy these 500 shares for a mere $1,625 return.
Now, when we’re understanding inner market correlations and why light sweet crude oil futures is the place to be, once again, you have access to get in and out of that trade in light sweet crude oil futures, which as you can see is the exact same trade as this particular stock. You can get out of that almost 24 hours a day. I think 23 hours a day, you can get in and out. You are not going to be subjected to these wild gaps in the market that you get with these stocks. Because again, the stock market, you’ve only got about six or eight hours, and not even eight hours a day of trading in stocks where the futures is about 23 hours.
The futures produce consistently more profit than what these energy stocks do. Again, it’s all about understanding this. But then we want to take this one step further when we’re talking about this, because this is, again, what a lot of your inexperienced traders will say is that, well, if the dollar is down, then oil is up. In actual fact, we need to take a closer look at that and see if that’s actually factual. When we break our chart using our Vantage Point software, and we split our screens in the chart, we can see that that’s not factual either. There is the beginning of the year. Oil is in a firm uptrend on the year, but so is the US dollar.
If we use the point in time and we set it to the yearly price, looking at the yearly price, you can see that the dollar is in a very, very firm uptrend from the beginning of the year, but so is light sweet crude oil. I’ve marked this with a vertical black line. You can see that oil and the US dollar have actually been moving up and down virtually together. They are not inversely correlated. Only in the last couple of weeks have they become more inversely correlated. But one could argue here too, that if we apply a seasonality to oil, then a lot of your seasonality firms that advise on specifically seasonalities, their view is that oil doesn’t do very well in autumn, where others will say it does fantastic.
But either way, we want to make sure that we understand that when the US dollars started to move higher, oil also started to move higher, and that’s been going on for this entire calendar year. It’s only recently did that shift. We want to make sure that we dispel some of these myths. Now, in our market correlations, they vary from time to time, from a week to week, month to month, or … The basics of what I would argue is monthly, quarterly, and yearly correlations, but the yearly being the strongest. We just want to make sure that we understand everything that we’re looking at here when we see this. Always make sure that when we’re looking at the medium term crossing the long-term predicted difference that we’re not getting caught with false signals.
Or again, making that classic retail trader mistake. When something is moving up, that we’re only basing it off of one indicator. That’s never a good thing to do. The market is only trending 20% of the time. 80% of the time, it’s just back and forth with inside of a range. When we’re doing complete analysis, then yes, we may have a short-term trade here or there, but I would argue again that even the short-term trade in oil here was several weeks ago, and it was down based around the medium term crossing the long-term predicted difference. Now the same signal that put us long is telling us if nothing else, even if you don’t want to go short, this indicator is telling us we do not want to continue.
S&P 500 Index
We want to take profit on this trade because something’s wrong. The market’s moving higher, but the Vantage Point predicted indicators are moving in the opposite direction. Now, when we go into … When we take a closer look at that, again at that oil contract, that puts a bit of a red flag on the S&P 500, because we know that these two also have a very high correlation to each other. As you can see, the same signal is forming the medium term crossing the long-term predicted difference. Now, in my respectful opinion only, this is a far better way to use that medium term crossover against because what we’re doing is we’re measuring the strength of that medium term crossover and then pinning it against the strength of the long-term crossover.
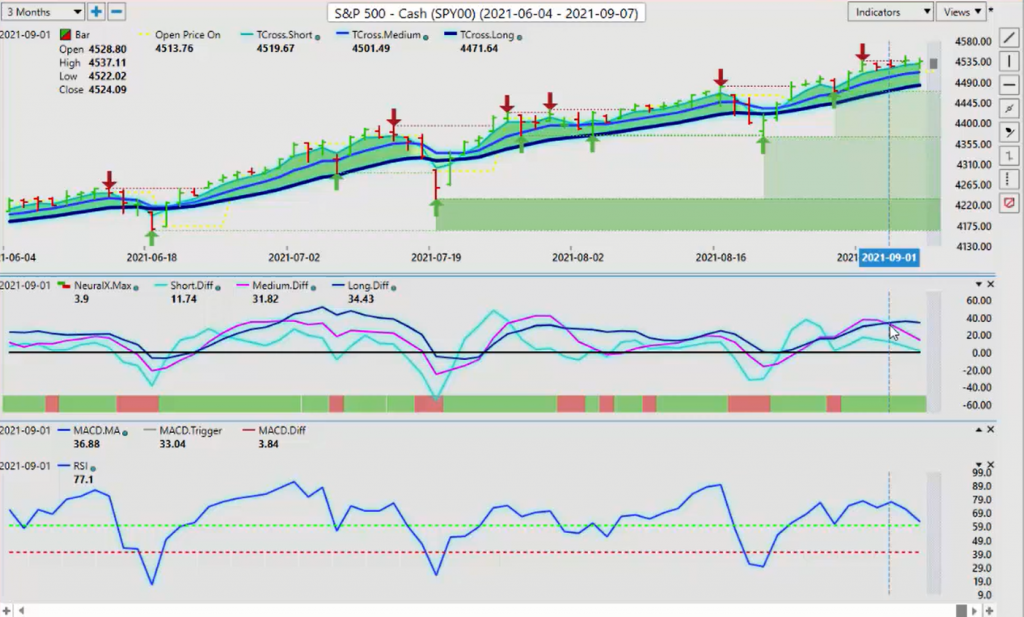
To some degree, we move away from a form of single market analysis, where we’re looking at multiple indicators and multiple timeframes in our charts all at the same time. This, again, in my respectful opinion is very, very important. We’re not getting caught or falling into that classic retail trader trap where they’re falling into these bull traps and bear traps because they’re not seeing the bigger picture, they’re not understanding what the actual real inner market correlations are. The S&P, as you can see, oil has had its ups and downs, but the S&P has had a lot more ups than downs. If we look at seasonalities with the S&P 500, and we bring that into play. Statistically, September is not a great month for equities.
That’s just a statistical basis. Again, we’re looking at predictive indicators, we’re looking at verified zones, we’re discussing seasonalities. All of these things are relevant in our final decision-making when it comes to a trade. When I look at the S&P, I’ve got a pretty strong verified resistance high up here at 4737. I need a clean break of this. But that MA diff cross is making sure that I’m thinking outside of the box here, that, look, it’s been a strong uptrend, but maybe this is not going any higher than where it is now, and maybe if I’m long during this period, I should be taking some profit. Again, that’s a very reasonable thing to do.
Our T cross long now at 4483. A corrective move back down to this level, that’s what our MA diff cross is telling us. What I prefer is a signal very much like what I just showed you with light sweet crude oil. I prefer that it be with the neural index. In this particular move here, we can see our medium term has crossed our long-term predicted difference. We have serious divergence between what’s going on up here. But our neural index, we’re looking for that neural index to be in agreement. Excuse me, I believe that was on Callon Petroleum. Yes, it was. Callon Petroleum becomes now a leading indicator for us to short light sweet crude oil should we be so inclined to do.
But when you have an MA diff cross and you have a neural index that’s in agreement with it, it’s very, very seldomly wrong. It’s, an accuracy rating of about … I would give it at least 80%. Again, you can look through your case in point all over the place. Now, with either light sweet crude oil or with this particular energy stock, then again we would need to close above 3510 two days in a row. But after that very minimal move up on Thursday, it was pounded lower all the way down to 3332 closing at 3337. Once again, the second the trader gets long, he turns around and he stopped out. We must be careful with these types of moves. Now, the one that continues to shine through all of these other different markets is, of course, Bitcoin.
Bitcoin
Bitcoin, not having too much trouble, retaking the 50,000 mark. Again, we continue to hear negative things about Bitcoin. Bitcoin’s a scam, we’re not investing in Bitcoin, like Warren Buffett and all that. Well, if Buffett hasn’t been investing in Bitcoin, then he’s missed the trade of the decade, an annualized return of some 230% per year. Again, I have no bias for or against Bitcoin. I simply prefer to identify a good investment and a bad investment. For somebody to say that Bitcoin is a bad investment or has been a bad investment over the last 10 years, that’s simply not factual information when you look statistically at this. Bitcoin for now, 47,980 in previous sessions on here.
In the Vantage Point live room, I’ve shown that there’s still a high correlation between Bitcoin and the US dollar. Well, we have another buy signal forming on the US dollar that tells me that Bitcoin is likely getting ready to make another push above the 50,474. But remember down here when they were telling us down at 29 and 30,000 that Bitcoin’s a scam and Bitcoin’s this and Bitcoin’s that? I made very, very strong arguments on the AI Weekly Outlook that that’s not factual in any way, shape or form, and this is a fantastic buying opportunity. The second I got confirmation from Vantage Point, going back into the early to mid July, I jumped all over it again.
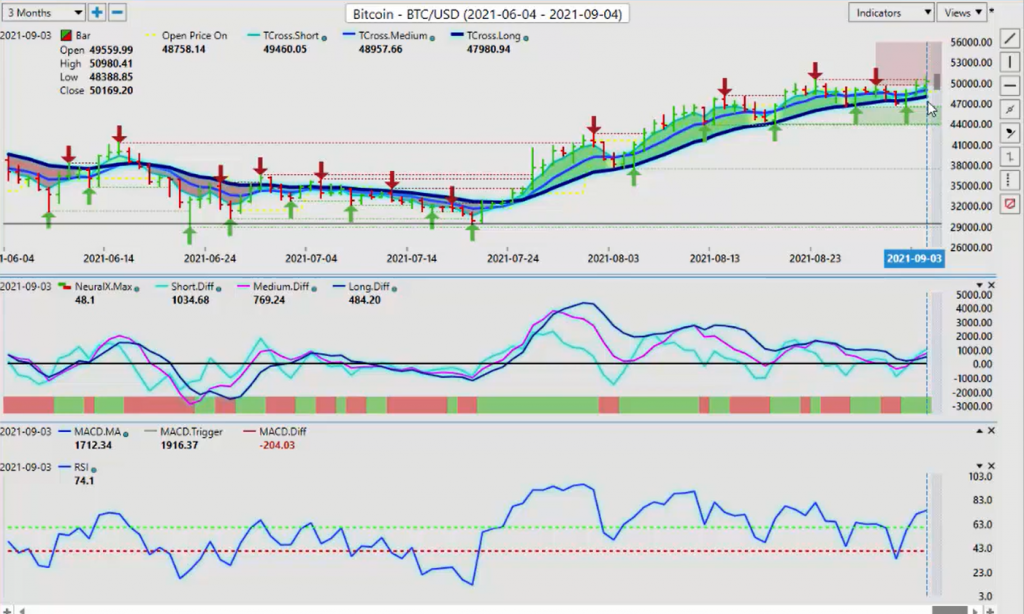
But again, this is why that yearly opening price is very important. The real opening price, I would pin this at 28,890. My view is not changed. We’re long while above that level, but you can see that we’re getting some very strong support forming off of this 44,000 level now. Now, again, we’ll look at our VP level, but we have a fresh buy signal on the MA diff cross. This thing looks like it’s getting ready to pop again. Guys, if you apply the proper indicators, know your inner market correlations, study the charts over a longer period of time and combine quality indicators, not quantity. That’s what we’re … Because again, I could fire 50 indicators at this and it wouldn’t change my …
If 49 of those indicators said it was going lower, I would still look at the charts over a 10-year period and say, “Look, I want to be involved in this.” If I’m lucky enough to get it to go lower, that doesn’t mean it’s a trend change. It means I have another buying opportunity. For now, we’ve got 47,980. That’s the level that we want to watch to start the week. Now, as I review some of the Forex pairs for this week, I’m just going to hit the main ones. The primary bias tier guys in the Forex market is you’re either buying or selling US dollars. It really is not as complicated as what some people make it out to be.
But again, if we take into consideration some of the comments that Warren Buffett has made over the years saying very similar to what he’s making about Bitcoin right now. Back in the ’90s, again, Buffett said, “Forex is a scam. Forex is this. Forex is that.” Well, guys, he pretty much bankrupted Berkshire Hathaway by buying all of these different stocks, and then he had to officially announced to the world he’s entering the currency markets where he actually did very well. Again, we don’t want to have our biases or backs up on certain markets just because we don’t understand them. Buffett proved that he didn’t really understand it. Now, to clarify, the Forex market is upwards of $6 trillion a day in daily turnover.
This is the top of the food chain, guys. Stocks, futures, commodities, they are at the bottom of the food chain, not the top. If you combined all the global stock markets and even the bond markets and some commodity markets, put them all together, they’re going to be one 10th the size of the Forex, right? We like to deal with facts, not fiction. Again, much like Bitcoin, currencies are something that I want to take part in. Even if I’m not good at, we’re not good at it, I still know that this is a good investment. Again, when we look at the Euro right now, the Euro is a very high correlation, extremely high correlation to gold.
If gold can breakout above 1833, 1835, close above that level two days in a row and start advancing towards the 1900 mark, then the Euro will absolutely break through these levels. But that appears to be very, very unlikely as Bitcoin asserts itself as the new goal, the new safe haven flow. Maybe it is, maybe it isn’t. But I know that corporations are not hedging their inflation in gold. They’re hedging it in Bitcoin. They’ve repeatedly stated that to the general public, and Wall Street still comes out and argues and says, “Well, that’s not a good investment. Bitcoin’s a scam.” Okay. Well, these are very large companies with very intelligent CEOs. I fail to see where they’re making these comments from.
Euro versus U.S. Dollar
But at the same time right now, we must break through this particular level at 1909. I can assess here that the likely outcome will be a slight move above this level, and then ultimately the Euro extends its downtrend. The Euro is in a significant downtrend on the year. We opened the year at 122.40. It is indisputably bearish. If you bought Euro/US on January 1, you have been losing money all year. Period. Yes, we have short-term crossovers, we have cumulation distributions, we have overbought, we have predicted MACDs, neural index. We have all these things, right? Which are great. They guide us through these troubled waters. But first of all identify what the real overall trend is, much like what I showed you with oil and the US dollar.
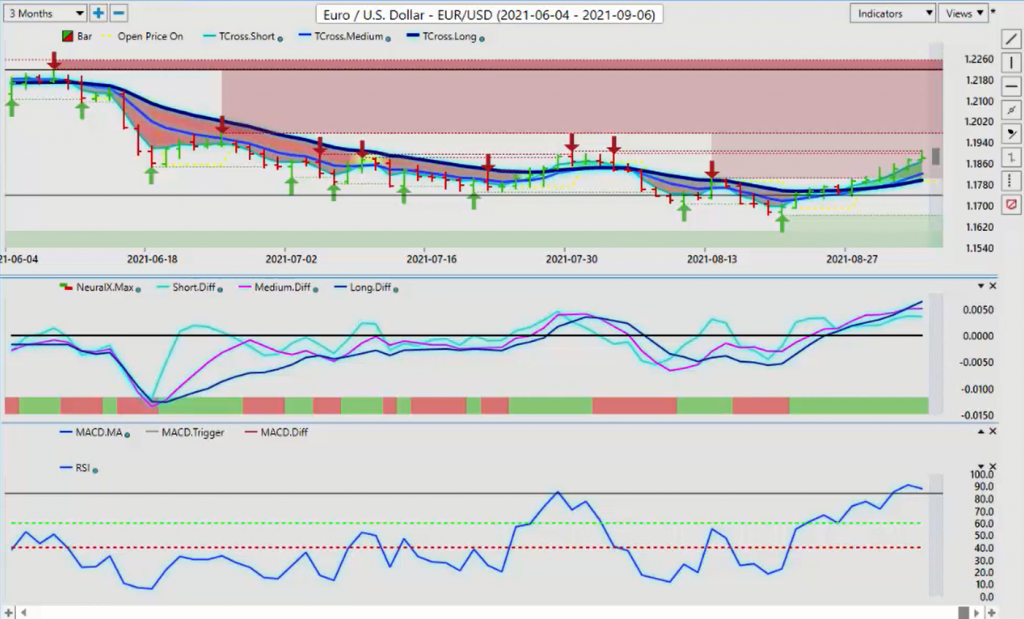
First of all, they’re not 100% inverse correlated. They’re barely even 40% inversely correlated at this particular time. But gold and the Euro, there’s a very, very high correlation between these two. If gold cannot break out, neither will the Euro. I suspect by mid-week, we are likely going to be heading back into the lower 118 area. I believe that would be a good selling opportunity if, and this is a tall order, getting to 119.75. I believe that that could be a false break because we have the MA diff, we have the medium term trend, the pink line over the blue line weakening against the longer-term trend. When that neural index turns green, from green, excuse me, to red, that will be the trigger to hit the sell button.
Don’t be overly concerned with the perfect entry point at the predicted high or any of these things. But even if you are, in Tuesday’s trading, not Monday, Tuesday’s trading, Vantage Point predicted high is 119.14. There’s a very good possibility that that’s all we’ll get from this particular pair. With that MA diff crossing, the predicted RSI at 91.9, this is not the perfect entry for a long. I wouldn’t even say it’s a good entry. Now, with the pound/dollar, again, this is another big pair in the Forex market, but the pound/dollar can fuel itself based off of your weakness. Remember, we got Brexit. Brexit has done. They’re not the same currency per se, or they don’t correlate as much to each other.
But right now, once again, we’re getting another warning sign for dollar strength is pending. I don’t believe it’ll be on Tuesday, but I believe it could be on Wednesday or Thursday of next week. Because again, this is an outlook, not a recap of something that already happened. That’s very easy to call this and say, “Well, if you did this on this day, this is how much money you would have made.” Well, that’s great, but that doesn’t really help anybody for next week’s trading, does it? We look at these predictive indicators. We’re all speculators, guys. We all get it right, we all get it wrong. We want to make the best educated decision we can.
British Pound
This is warning that the pound/dollar is probably going to move up into this high near 139.57, or just below it. Then it’s probably going to plummet by midweek. Maybe not a big amount, but I would say that we will be coming back either way to 137.87. Excuse me. Same thing, predicted RSI, heavily overbought. The market needs to take a step back here. They need to look closer at that labor report. Remember, we’re going to have all the major players are going to be back in September. They’re going to look at this and say, “You know what? That labor report wasn’t as bad maybe as what the media is trying to spin this. Maybe we better par back some of these dollars shorts that we’ve been in for a week or two.”
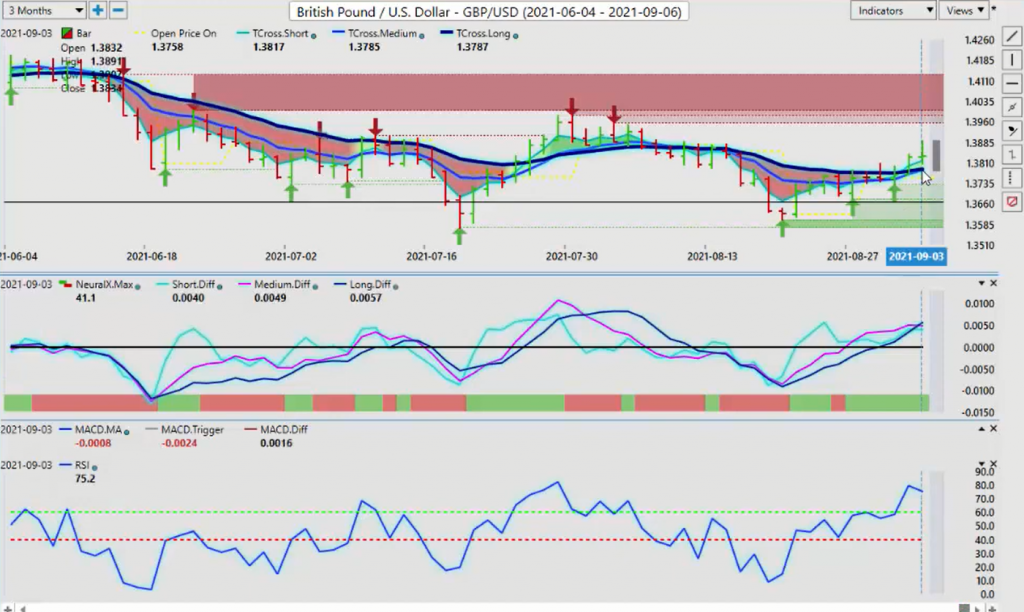
Again, keep a close eye on this verified resistance zone and to see if the medium term crossing the long-term predicted difference, if this signal continues to form with, of course, the neural index going from green to red. Now, with the dollar/yen, again, if we see gold prices unable to break above 1835, get above that area and stay above that, then the dollar/yen is going to recover back to the upside if gold and the Euro cannot advance. That’s what you want to watch trading the dollar/yen, The predicted low for the next week to start the week is 109.41. In this particular case, it’s showing that the medium term crossing the long-term predicted difference, I believe internally the software’s picking up on the correlation, despair has to the S&P 500.
Japanese Yen
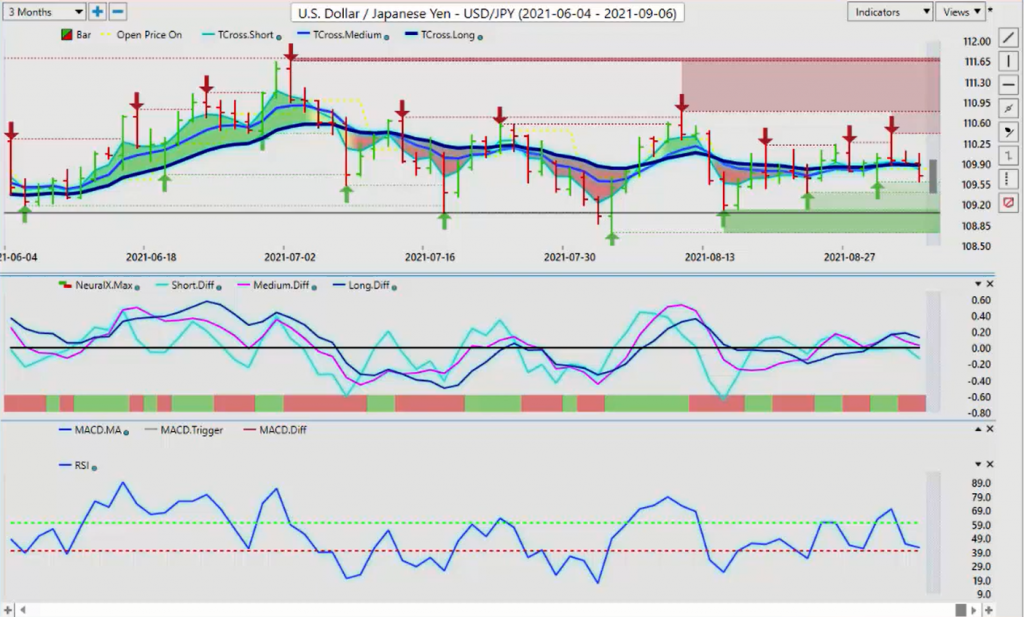
If the S&P 500 crashes, then that may not necessarily help the dollar against the yen. That could help the yen. Again, we’re going to watch the verified support low that’s coming in. We’ve got 109.59, and we have the additional level that the next support level is 109.41, but this is the big one you want to watch, guys. The low at 109.11, I believe that level will hold, and we may be able to get a long opportunity, but not if that predicted RSI breaks below the 40. That will tell me that we’ve got momentum building to the downside. Now, again, when we’re looking at some of these additional Forex pairs, we look at the Canadian dollar and we look at Great Britain. As I showed in last week’s outlook, the very high correlation the pound and the Canadian dollar have to light sweet crude oil.
Canadian Dollar
If crude oil does tank, then US/Canada longs could be very attractive on this level at 124.75. Canada is going into an election on September the 20th, and I believe there is a very strong possibility that there’s going to be a change in government. If that happens, we will have to reassess this trade. I believe Justin Trudeau is in a lot of trouble here. It was a huge mistake calling an election when there was still two years left in his term and the minority government was working with the other parties. We’ll see. But just be aware, for people that don’t live or are not familiar with some of the things going on in Canada, that election could be big for the Canadian dollar.
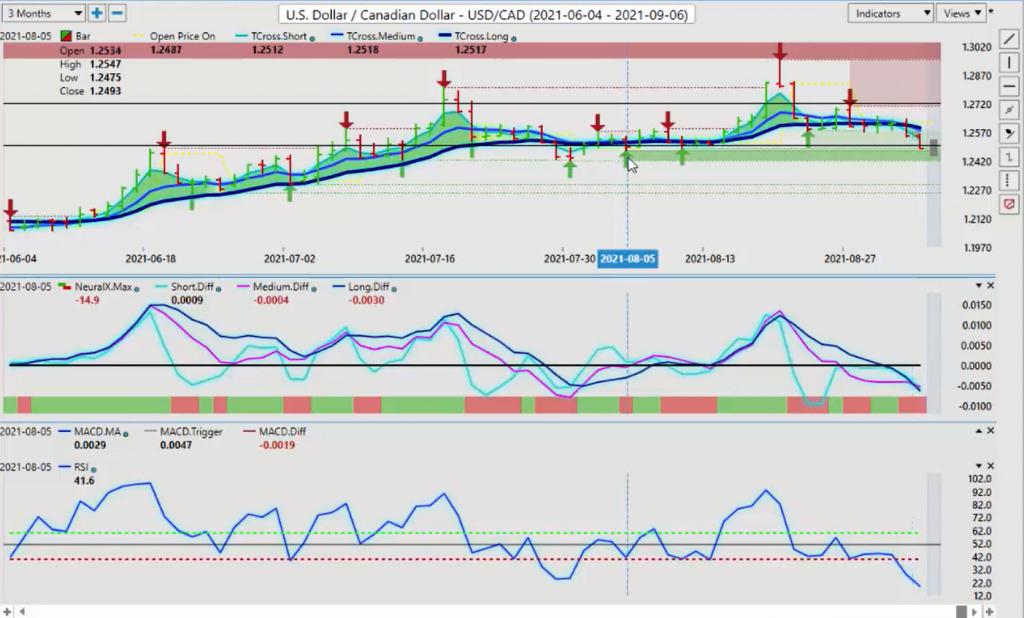
I believe if Trudeau does get reelected, it will hurt the Canadian dollar. That could trigger the Canadian dollar going much higher as the printing presses are fired back up. Again, people often say, well, the US is printing all this money. Well, so is Canada, so is the UK, so is Europe. Again, we go back to that analogy of the prettiest horse in the glue factory, right? Often times, that does warn us. But here’s the concern we have with US/Canada. We see again, that signal, that MA diff, the medium term crossing the long-term predicted difference. The neural index is not on board just yet. But an early warning sign, that’s where these verified support and resistance levels come in.
We combine the verified support with this particular signal. When the neural index turns green, and not to mention the predicted RSI here, guys, 19.4. Not a lot of room to move down here, in my respectful opinion. It can still go lower. It can flatten out. It can do all those things. But if this signal continues to develop, then I think we have a trade here, right? That would be the same as we would look at that from the US/Swiss franc’s standpoint. If you don’t want to trade Euro/US on the short side, then US/Swiss franc long is down off of this 91O1 area also look pretty decent here. I think that when the dollar recovers …
Australian Dollar
It’s very interesting. You see this yellow line is the price on open on the week. We closed right on that. If the dollar is as weak as what they’re trying to sell us, then again, you would have thought that the support level on US/Swiss franc at 9099 would have easily have been broken. When in actual fact, you can see that they’re buying off of that level. Watch that 91 level very closely because I believe there could be a long trade there. Now with Aussie and New Zealand this week, very similar trade here. But again, I think that they’re getting all tangled up in these verified resistance zones, and yet again, we have another sell signal suggesting dollar strength.
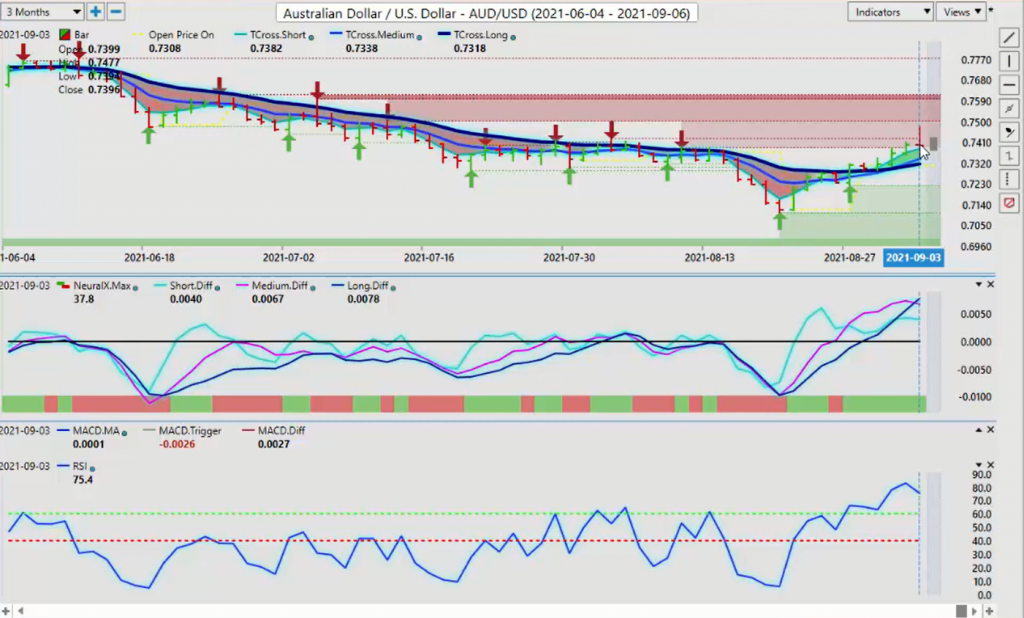
Once again, when some of these analysts, junior analysts are saying dollar weakness, dollar weakness, buy oil, do this, do that, you have to take that with a grain of salt because how was that analysis formed? Was it a broader, bigger picture? Well, the Aussie is not doing well in the year, and for the most part, neither is the Kiwi. They’re still well down. Once again, you have these up weeks and down weeks. My view is, as I stated in last week’s weekly, look, the dollar is usually strong in the first week of the new month. That could be argued it was last week. It can be argued it’s this coming week because we’re in summer trade and everybody, real money is back in the market on Monday. Or Tuesday, excuse me.
New Zealand Dollar
Again, that dollar strength is still potentially there, and all through the Vantage Point software, we can see the signal is forming across the board. There it is on New Zealand. We’re simply waiting for that powerful neural index to confirm the MA diff cross. But again, this is a form of single market analysis. When we’re using a blue line crossing the black line, it is an absolutely vantastic indicator. But we must use it with the additional indicators in Vantage Point. The neural index, the predicted difference, the modified predicted RSI, the pivot levels. For example, here, New Zealand’s making a strong move. If I click on my F8, I know exactly the level to watch, the long predicted 7062.
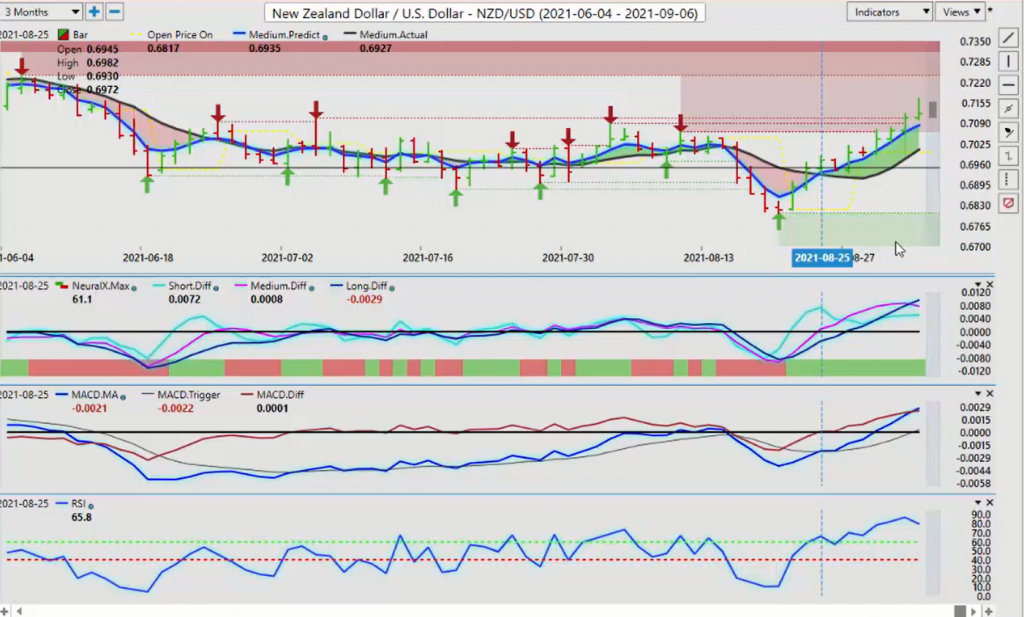
The only way I will go long on this, guys, first of all, I have to be very, very close to that blue line before I’ll hit the buy button, but these signals are warning me not to do that. Be very careful. In this particular case, I can sell back down to the blue line, then I can have an additional short sitting just below that pivot area of 7062. Using these straddle type plays are absolutely vantastic when you know what you’re looking for, when you understand the inner market correlations and the critical levels. In the Vantage Point software using the predicted moving averages, the verified zones, all of these things will lead to your success. With that said, this is the Vantage Point AI Market Outlook for the week of September the 6th, 2000-