


Welcome to the Artificial Intelligence Outlook for Forex trading.
VIDEO TRANSCRIPT
Hello, everyone and welcome back. My name is Greg Firman, and this is the VantagePoint AI Market Outlook for the week of October the 4th, 2021.
U.S. Dollar Index
Now to get started this week, we’re going to begin where we always do with that very important US Dollar Index. But first of all, let’s have a look at some of the markets we’re looking at for this coming week and the indicators being used in this particular presentations.
Some of the markets we’ll be looking at today, US-Canada, British pound-US dollar, Euro-US, dollar-yen, US-Swiss Franc, light sweet crude oil, our main equities, the S&P 500, the Dollar Index, of course, gold, Ethereum, Aussie-US, New Zealand-US, and Bitcoin. Now, we’ll look at some of these, maybe not all of them, but we’ll get through a few of them. Now, first and foremost, we want to look at the Dollar Index and upcoming event risk this week, of course, will be the nonfarm payroll number.
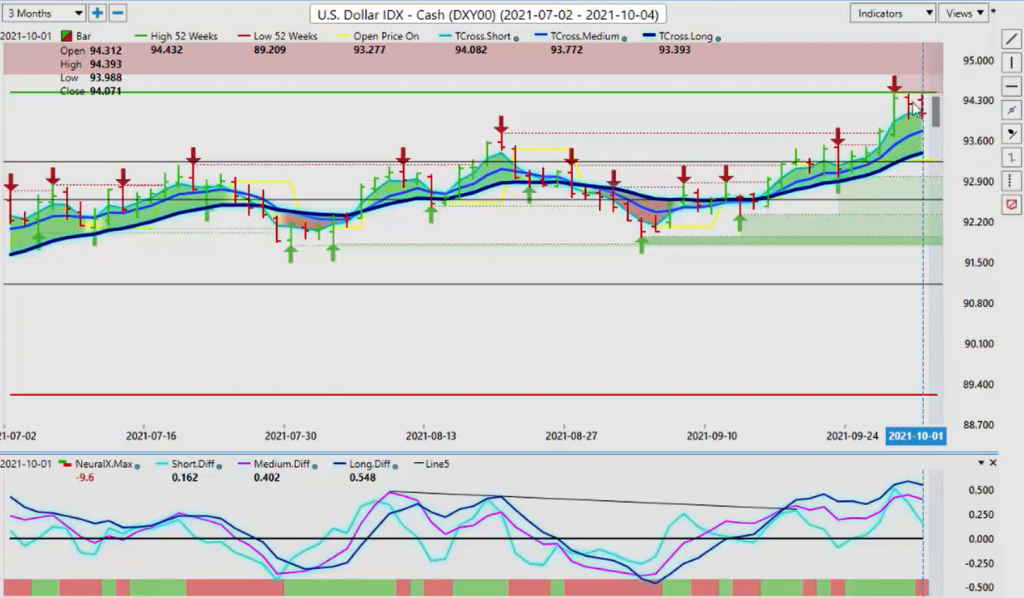
In my respectful opinion, only this could be a make or break area for the dollar here. Now, when we look at the dollar, you can see that we’ve put a top in place at or about 94.43. Now, again, the indicators being used here at the 52 week look back, we’re using bars, not candles, the predicted short, medium, and long term difference, very important neural index, point in time or PO point in time price, triple cross, and of course, the very popular verified support and resistance zones.
Now, when we look at this in a three month period or in a custom shorter period, we see one view. But when we back this out and we look at it over a two year period, we really do get a very clear picture of where the dollar has been and where it currently resides. Now, this major resistance here, 94.30 and 94.74, this has contained the dollar on the upside for approximately the last basically year and a half. We’re hitting this high up near this particular area, but we’re unable to get above it.
The low area of this particular channel is coming in at or about 89.32. This is the structure of what we’re looking at, but the verified resistance right now at least at the 94.40 is holding. But again, in my respectful opinion, this payroll number will be a determining factor. The fed has pushed the dollar higher. It hasn’t got up here on its own merits. Basically the fed talking up that they’re going to be looking at raising rates earlier which is prompting the dollar to extend higher, but very minimal.
When we look at the current structure of where this market is at, you can see in the point in time using the weekly opening price, the dollar is held above the weekly opening price, but we’ve put this high in place. Now we have two bars to the left and two bars to the right that are lower than this highest point. That has triggered our neural index to turn down. Now, when we look at our MA diff cross, which measures the strength of that medium term crossover, which I’ll illustrate here by clicking on the F7.
Now, the crossover point is highly accurate. We’ve moved higher. But at this point, right on this particular bar, at this high of 93.45, this triggered and started to show that the strength of the dollar may not be as strong as what we think it is. And again, this is a highly accurate indicate. Now, the neural index is an agreement on this. But again, when we look at this move, a lot of this is being caused by the fed, the fed testimony, but the Dollar Index is still or the dollar itself is a fiat currency.
With the printing presses, they’re going to be producing I think another four or five trillion in debt that they’re going to have to cover. They’ve raised the debt ceiling, so that’s past. But now the payroll number, the fed is going to be watching this payroll number on Friday very, very closely. What he’s looking for is to see if the labor market is really starting to strengthen. The average hourly earnings are up, the U6 being down. They’re going to be measuring this.
Again, a very, very important risk, but that fed announcement is likely going to determine this. Now, what I’ve talked about in the past many, many times is there’s a cycle of dollar buying around the beginning of the month. We would have to make the determination here, is this just part of the normal monthly cycle where the dollar is strong at the beginning of the month anyway, and then it sells off on the Tuesday or the Wednesday after the nonfarm payroll number? That is still a realistic outcome.
That is one potential outcome. The other outcome is that the payroll number is a blowout number of 900 or over a million jobs. Unemployment rate goes lower. Everything the fed is looking for is met, and then that triggers the market into thinking the fed is going to raise rates sooner rather than later and that should strengthen the dollar. But again, this is very formable resistance.
When we look back at these seasonalities, over that two year period, we can see that the dollar is sold off in each one of those years by November the fifth, with money moving offshore to avoid or minimize their taxes that they have to pay, only to bring that money back in January, where we always see the dollar strengthen from usually January to about March 30th or so. Almost every calendar year we see this. I don’t think that this year is really that much different.
I think that the dollar is recovering from this mess that COVID has caused. But again, we will see. The main thing is that we know our levels and we look at the immediate advantage point forecast. Again, the neural index is picking up on weakness in the dollar. We have a high point where we’ve failed and the MA diff cross has still to date has not… The pink line has not crossed the blue line back to the upside. They’re actually starting to slope downward again.
This is a warning sign, if nothing else, to be very, very cautious buying dollars up at these extremely lofty levels. Now, when we do a comparative analysis from the dollar to gold, then we can further assess here that gold is trying to recover here. We’re looking at gold making a potential move here. Now, when we look at it from the triple EMA cross, again, using the VantagePoint predicted moving averages as pivot levels are very important.
Gold
Now, gold has had a substantial recovery from Wednesday, that big move up on the dollar. And really when you look closer at the dollar chart, most of the gains in the week were on Wednesday with that fed testimony. Gold basically shrugging that off. We’ve had a good rally off that verified support low, but now we’re getting tangled up in the TROs long itself at 1749, or excuse me, 1760.84, the T cross long.
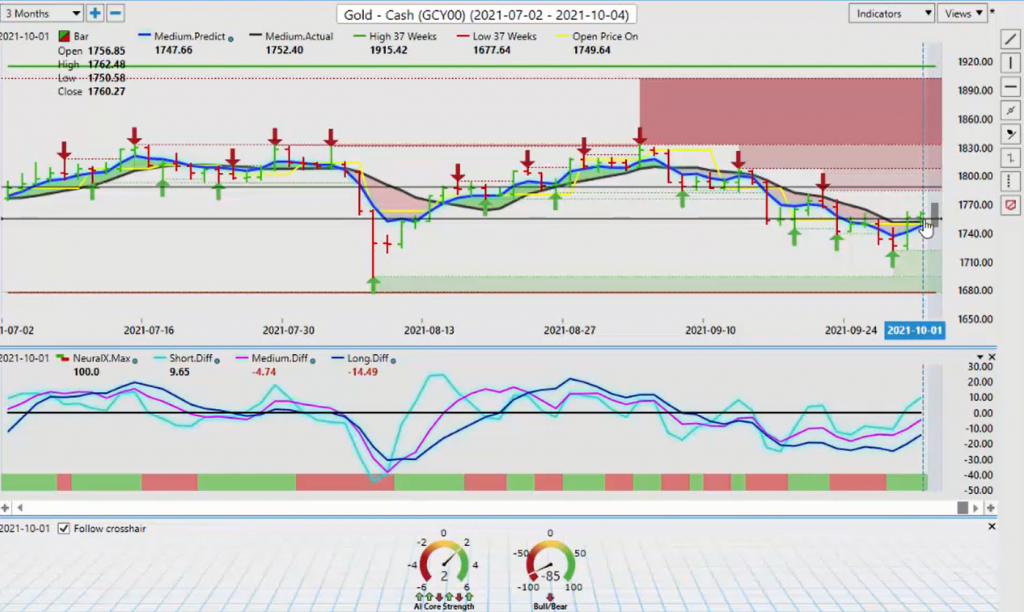
So again, we would look for the market to get to break above this, but I think that that’s somewhat unlikely in the week of the nonfarm payroll number, because we know that we’ve got dollar demand. Now, if we can clear 1760, that should take some of the pressure off the downside in gold. Again, we are not making any new lower low here, which suggests that gold can recover with some of the other commodities. We’ll be watching that one very, very closely.
But again, if we click on our F8, one of the ways to really get the most use out of the VantagePoint software with a minimal amount of lag is to actually remove the black line, use the blue line by itself. We’ve closed above this blue line two days in a row. Now, again, you can see two days in a row when we closed below it here, that led to a substantial move lower, but now we’ve closed two days above that blue line, which suggests that there may still be some life in gold.
Our neural index, excuse me, has been up for the last two or three days in a row and our predicted differences are pointing up suggesting that gold is still recovering. But again, be very cautious with gold in the week of the nonfarm payroll number. Now, with stocks, again, stocks stalling at a known level here, 4305, the verified support low. Very strong buying off this on Friday. Probably we’re getting close to the global equity markets turning around and going back to the upside, but some caution is required here.
Now, again, with the dollar strength in most cases, that pushes equity markets lower on that dollar strength. If the dollar reverses here, which I’m not convinced will be next week, I think it’ll just stabilize, but again, if the dollar does break out and it triggers or the nonfarm payroll number is a big number, then that’s going to spook the market and they’re probably going to come out of stocks even more.
S&P 500 Index
But if that payroll number is soft, then you can expect stocks to rally significantly, probably back up to the next verified high. That verified high up at that particular level there, we’re looking at about the 4465 mark. But first, we must clear the T cross long, that level 4406. But again, if we click on our F8 in the software, you can see using that blue line, the predicted moving average by itself, and using that as a pivot level to buy or sell from or to straddle that where we could say, “Okay, we’re expecting this to go higher,” so we would put limit orders just above that blue line.
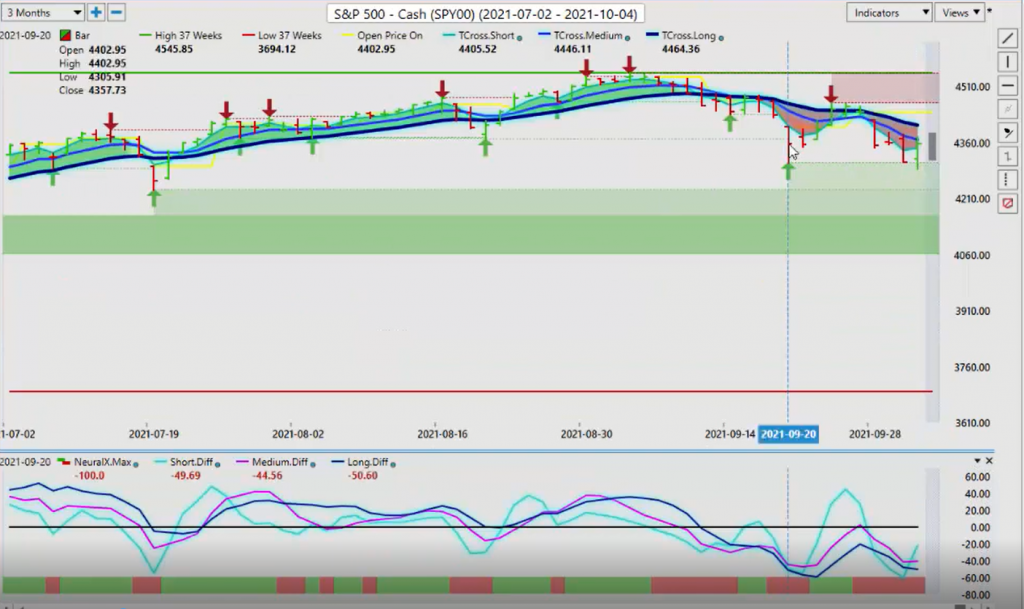
And if we can, we would utilize the predicted high and predicted low if they can match. Now, our predicted differences are starting to base out here. So that would tell me that we’re getting closer to the equities turning around. And again, September is a known seasonality with stocks, guys. I don’t think at this time it should be considered a new trend or stocks are just automatically going to go lower, because September, again, is a known seasonality.
It’s very important that we use these seasonalities to our advantage. If we look at this, you can see that last year at this time stocks did turn back around, and I don’t think I have to tell anybody what happened from there. Basically by the time we hit October the 30th, which, again, that seasonality in the US Dollar Index or the dollar itself selling off at the first week of November, that was your trigger for the S&P rally.
We’re probably a few weeks away from a substantial equity rally, but it’s still definitely in the cards here.
Crude Oil
Now with light sweet crude oil for next week, once again, oil making this fairly strong move up. Now, again, guys, remember that oil was down in this section back here, going back into the earlier part of September. Most of this rally that has happened here is largely because we’re on the border of an energy crisis here.
China being more or less the cause of this telling their people to go out buy up oil, buy up natural gas, oil, and buy energy right across the board. They’re stockpiling. They’re getting nervous. That’s what’s triggering this rally here. Again, we are moving up to the extreme highs here. Once again, we always want to make sure that we’re looking at these seasonalities. Because again, very often commodities, currencies, even some of the global indexes can be very repetitive at certain times of the year, much like what we just saw on the S&P 500.
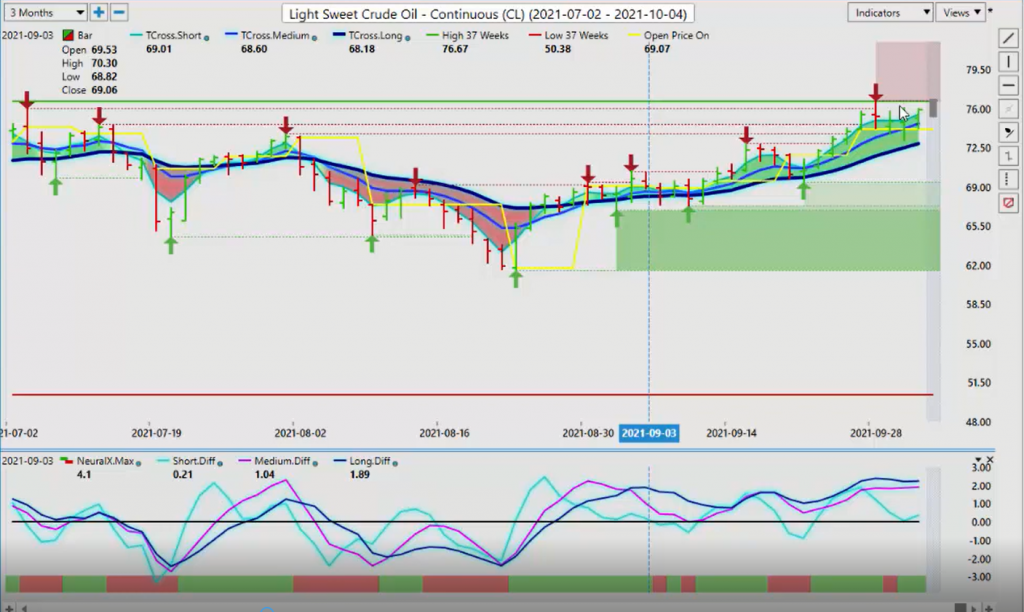
When we look at that on a year, over year basis, usually the oil does not take a bigger rally until probably November, but this one is a little conflicted, because remember that we were dealing with COVID issues. But at this particular time, and I want to dismiss that myth right now that oil up, dollar down, that has not been the case in 2021 here, guys. Oil and the dollar have been equally strong. They’ve been largely moving up and down together.
You can see that oil had a good week last week, and so did the US dollar. We don’t want to get into that old adage, that pre-COVID notion that just because the dollar is up, oil has to be down, or vice versa, because that’s actually not the case. Right now, if we’re looking at these types of seasonalities and if the dollar does sell off, then that doesn’t necessarily mean it’s going to trigger additional loans on oil.
Now, the major, I think, event risk that we’re going to be dealing with in oil this week is OPEC on Monday. OPEC is also responsible for about 75% of this upward move over the last month or so. And again, because they want oil prices higher, they don’t want to increase production. They want this. They want that. We’ll see what OPEC has to say tomorrow, but that’s going to cause further volatility, but be very, very cautious.
Bitcoin
Now with Bitcoin, once again, Bitcoin, one of the top trades again. Buying Bitcoin this past week off of these verified support zones down here in this lower 40,000 mark. Once again, a substantial move, up over 20% in just a matter of literally days. And again, these are the kind of moves that we want to look for. If we look at Bitcoin as to where we are right now, it’s quite interesting actually. If we look at it from a profit calculating basis now, I’m not necessarily going to go with five, showing those kind of numbers.
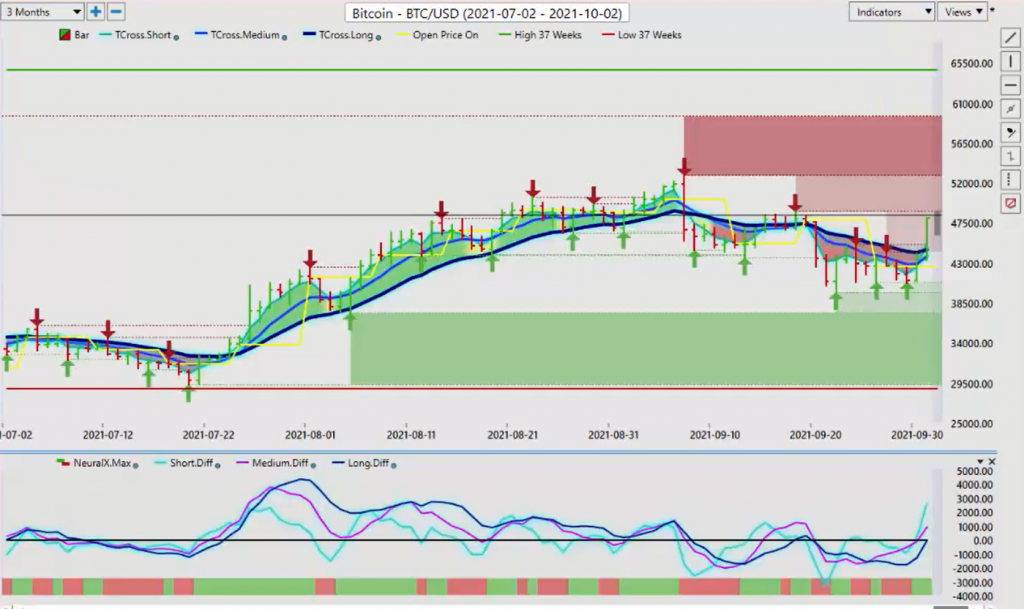
But even if we just go with one, that’s $7,420 buying off these verified support zones. But once again here, guys, thinking outside of the box, what we would look at is we would look at this and say, “Okay, I’ve got verified support here and it’s strong. Then I have an MA diff cross that’s taken place right at this point, which is telling me that the medium term trend is weakening against the longer term trend. That led to a substantial rally,” the trigger, again, being the MA diff cross.
Now, if we click on the F8, you can see, we have two days in a row that we’ve crossed this blue line. Now, bear in mind, this bar is actually from today, Bitcoin Coinbase’s trading, so it’s going to be a little choppy. What we need to do is clear this resistance high at 48,786, and that should take us back in towards the 52,000 mark. But at this particular time for 2022, it may be a little premature or early, but I always make my Bitcoin forecast.
I’m already putting Bitcoin between 60 and 80,000 next year. Bitcoin largely doubling almost every year for the last 10 years. It has been the number one investment, with an average of over 230% annualized returns. Again, be careful who you’re listening to with Bitcoin. We want to make sure we’re checking our charts, checking our inner market correlations. I’ll further submit that the dollar strength this past week had absolutely zero effect on Bitcoin.
You can see that by Wednesday Bitcoin bottomed out, and by Thursday we were already turning higher, but this is a very small move considering the amount of dollar strength that we actually had. I could argue to some degree that up until this month, there’s largely been a positive correlation between Bitcoin and the US dollar. But to start the week, the long predicted 4409 is the area we want to watch.
Euro versus U.S. Dollar
Now with our main currency groups, looking at the Euro-US for next week. Once again, we are on our yearly lows here.
Right now you can see that I’ve got this set at a 37 week look back. We recently set a slightly new… Like 4,100ths of a penny lower than the yearly low. But once again here, guys, we always want to make sure that we look at the structure of the market and what it really looks like. We have a lot of support sitting here at this low end, which is about 1.1615. We’re just lingering around this particular area. Now, if go gold can recover, that will help the Euro, believe it or not.
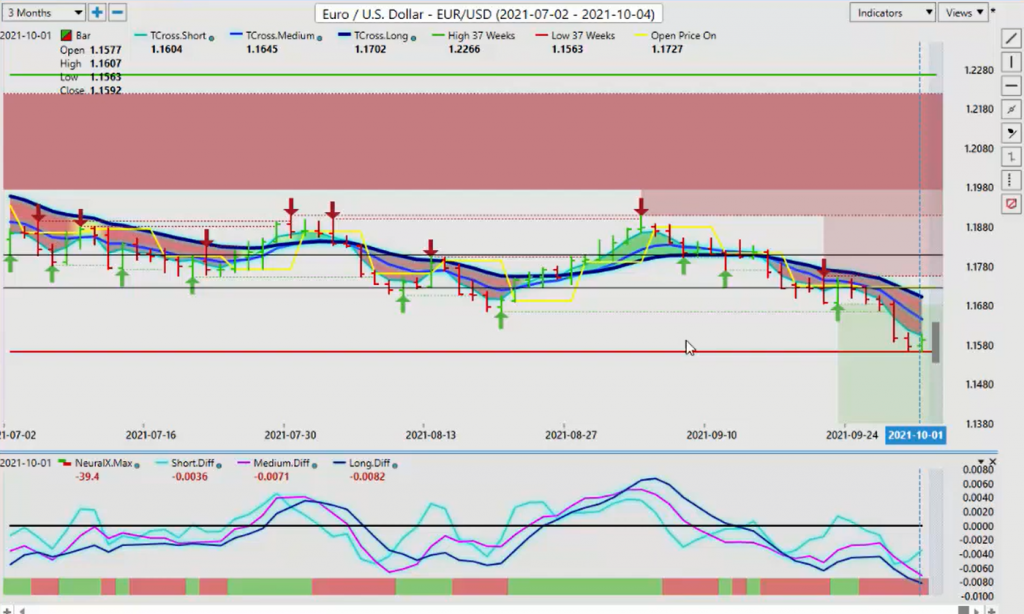
What I’ve seen is a very high positive correlation between gold and the Euro. But for now, we’re starting to get a little bit overdone here, but the main key level, our T cross long, 1.1702. The further we move away from this particular number, guys, the more likely it is we’re going to retrace to it. The same applies to the long predicted. When we look at that level, we’re 1.1628. Here’s an easy way that you can use your VantagePoint Software is you can straddle this blue line.
And what I mean by straddling is you can put your sell limit order, stay with the primary trend, if you so wish. Then what you’ll do is sell this as close to 1.1628, as you possibly can. Then we utilize the predicted high. The predicted high is 1.1636. We match the tip of the blue line at, again, 1.1628 on the long predicted, and then our predicted high is 1.1636. In this particular case, we would have a buy limit order, right?
We would sell staying with the primary trend and then have a buy limit order sitting just above 1.1636. Or the alternative is you could try and sell 1.1636 and then have about a 50 PIP stop or put your stop above the T cross long. That’s a very reasonable play also. Now, again, the Euro under substantial pressure, the shipping lines inflation prices, shortages on just about everything. All of this is affecting the Euro zone and it’s affecting the British pound. They’re also going into…
I believe they have the army guards out there at the gas stations and everything else. Again, this is all playing into those light sweet crude oil prices, the energy stocks. Be very cautious with those because as soon as this is cleaned up, those are all likely to reverse. So be very, very cautious. But understand right now that the British pound has a very high correlation to light sweet crude oil, just like the Canadian dollar does.
British Pound versus U.S. Dollar
When we look at this right now with the pound, once again, we’re hitting down. We’ve made a new low at 1.3412, but there’s just no more sellers down here. It looks like we’re going to retrace back up here to the T cross long. That’s coming in at 1.3651. Now, the yearly opening price is sitting there also. To begin the week, what you can also do is, again, use your weekly opening price to gauge the strength in the market. That price is going to come in at about 1.3543.
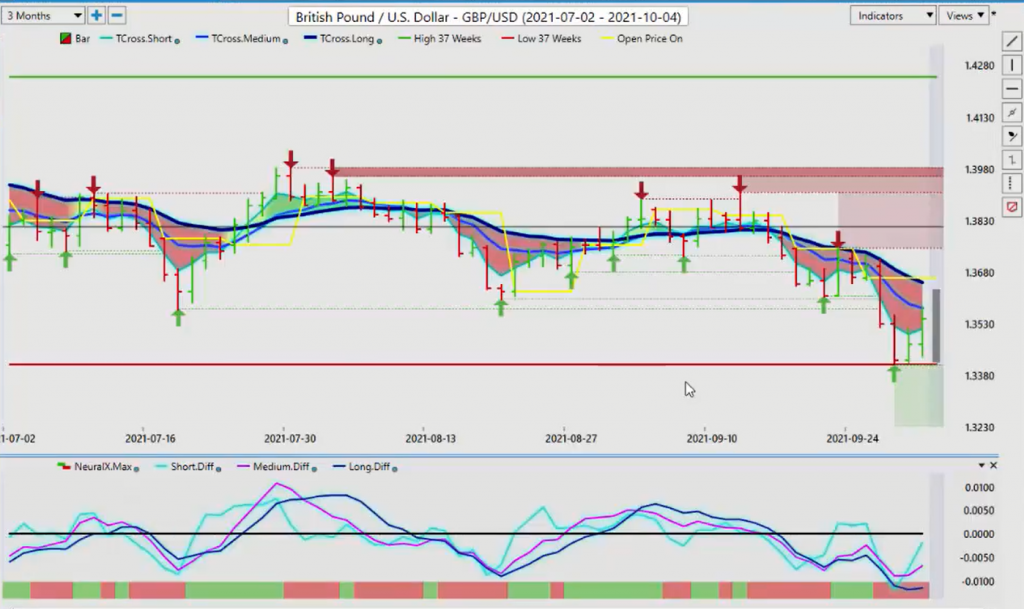
If the pound can hold above 1.3543, then it has a chance to recover here, but things are not looking that great in the UK. Now, looking at the long predicted, you can see 1.3546. We’re basically stalling exactly on that level, so another opportunity for a straddle play. If we believe this is going higher, then, again, you have two options. You can put a buy limit order just above the long predicted at 1.3546 or, again, you can sell, stay with the primary trend, sell the predicted high at 1.3627.
But I feel that’s a little higher risk. But you also have the opportunity to buy because the predicted high and predicted low for Monday, the predicted low coming in at 1.3419 and that’s rate on our new yearly low price. Could be an opportunity there is the medium term and long term predicted difference are starting to rise. Now, another way of gauging true US dollar strength would be the dollar-yen would continue to climb.
Now, what I’ve discussed in the VantagePoint Live Training Room and with my own direct clients is that we have a problem up here.
U.S. Dollar versus Japanese Yen
The dollar-yen, again, is an excellent way to gauge dollar strength and what the outcome of that nonfarm payroll is going to be. What I see here is basically a bunch rats leaving a sinking ship. When we got up to this level, made a new high, they immediately bailed out of this thing. The medium term is crossing the long term predicted difference. Now, again, this indicator has absolutely zero lag.
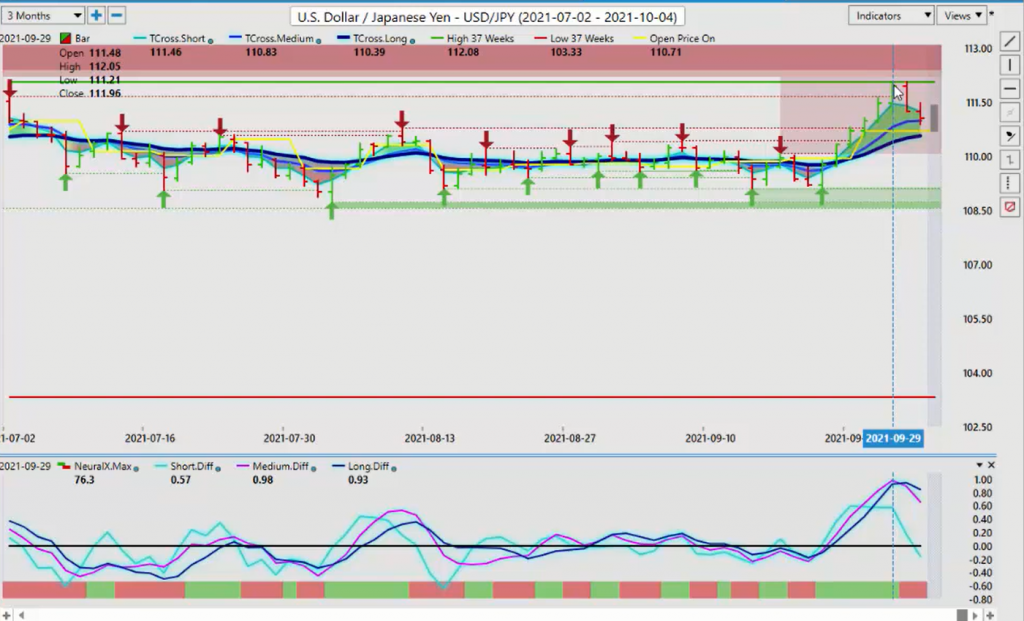
If we click on the F7, you can see the blue line crossing the black line back here is good, but there’s a very wide gap here between them. Now, if we click on the F8 and use the lone predicted moving average by itself, this removes a lot of lag. It allows us to get quicker entry points. It allows us to focus more on how the market is reacting to a key level, combining it with a top that’s now in place. For the dollar to strengthen further, we would look to dollar-yen for of that, and we’re not getting it.
One of the other ways that I always like to show this is if we go into the actual details of the market, we can see the top 10 correlated markets to dollar-yen, which are likely to fall also if the dollar-yen continues to fall. That’s a Commercial Metals, Inner Pipeline. You’ve got Shaw Communication, Chesapeake Energy. That’s another warning for oil. You’ve got a number of different markets in here. When we look at the inner markets themselves, you can see that this is what the dollar-yen looks at for a trade.
It looks at gold, light sweet, crude oil, the Dollar Index, the 10 year and five year notes, the yen futures, Euro futures. This is what the Japanese yen looks at or the VantagePoint software internally using the neural networks looks at to determine that. The fact that the neural networks accurately predicted that the dollar-yen would not advance on this apparent dollar strength is highly suspect for the dollar rally to continue.
It doesn’t mean that it won’t, but this gives us an idea that it may not, while at the same time pointing us to other trades, gold, oil, the Dollar Index, the Euro, natural gas, the S&P 500, the Dow Jones, Industrial, S&P 500 minis, power shares queues. These are all the things we look for to guide us as to whether the dollar-yen. But the fact that the dollar-yen failed, that could be a tell. If we were playing poker here, guys, I would look at that as a possible tell that my opponent is bluffing, right?
Again, this whole presentation is for educational purposes and to provide alternative strategies for you to apply or to find that needle on the haystack or that little nugget of information that you might be missing, right?
U.S. Dollar versus Canadian Dollar
Again, keep a very close eye on dollar-yen. Now, if this energy crisis continues, then that is likely to be positive for the Canadian dollar, not the US dollar. Now, the CAD is very, very susceptible to any kind of strength or weakness in the commodity sector, oil, gold, some of these things.
Right now we have closed below the triple EMA cross. This is one of the best ways to use the VantagePoint predicted high and predicted low. The predicted high is coming at 1.2661. We’ve got our T cross long coming in at 1.2677. If we click on our F8, then our long predicted is 1.2674. That is all consistent and very, very close to the VantagePoint predicted high of the day. When it rallies up to that level, good, bad or indifferent, right or wrong, that’s used as a trade setup. As an entry point.
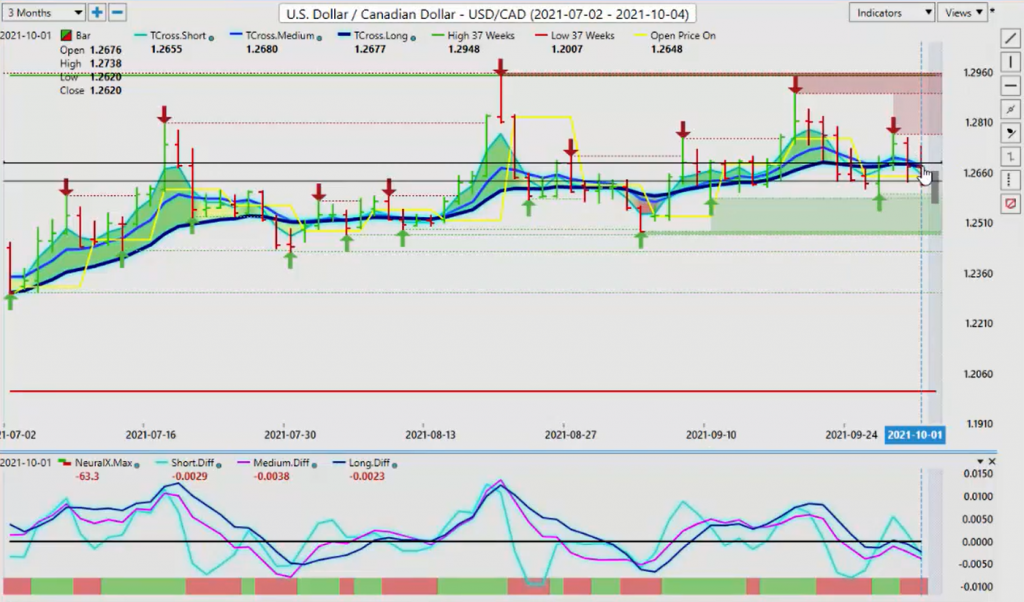
All we’re doing… And remember, this presentation is on Saturday. The markets are closed. All we’re doing is waiting for the market to come up to the level that we want in order to short this thing. Our predicted differences are below the zero line. Our neural index is down. Everything here is pointing down on the US-CAD. But the US-CAD needs again… if we’re shorting US-CAD, what else would we be doing? We would be buying the S&P 500. We would anticipate that oil is going to go higher.
It’s not just about the dollar and the Dollar Index. The CAD will respond accordingly to the commodity sector and, more specifically, the S&P 500. This is warning me that we are getting dangerously close to a reversal on stocks here, guys, now that we’ve got through September.
Australian Dollar versus U.S. Dollar
Now, briefly looking at one other currency here, I don’t want to go too long in the presentation, but we also have the Aussie currency and it’s showing signs of life also.
Now, almost as soon as some of the analysts had said that the Aussie is going down to the 70 level this week, before you know it, it’s all the way back up and closing the week at .7246. But once again, something is wrong down here. We’ve got the MA diff crossing here, that’s back on this support low that’s coming n at .7220. We’ve gone, again, slightly below that by 5,100ths of a penny, which is literally nothing, guys. And now it’s starting to recover again.
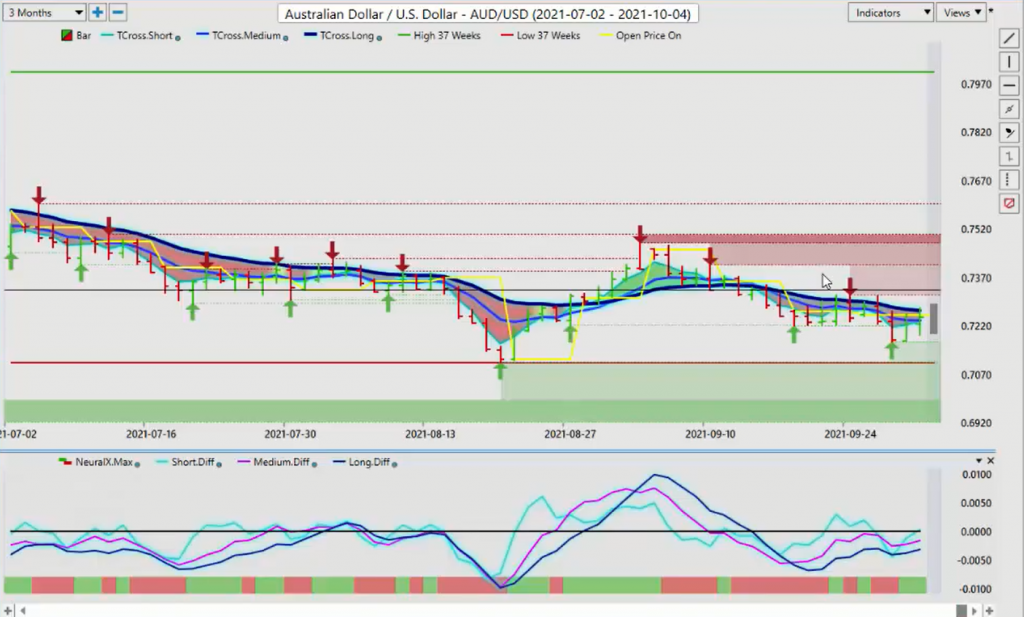
What you want to be very cautious of next week, bear traps, bull traps all around this payroll number, because very often the market gets ahead of itself when it comes to this fed. They buy the rumor. They sell the fact. Now, again, if that payroll number is very, very strong, then you are going to see the dollar extend its rally. But if it doesn’t, then the market is going to be grossly disappointed.
The dollar sells off, stocks go through the roof, gold recovers, and basically a number of these different Forex pairs that we’ve looked at here today recover from this short bout of dollar strength. With that said, this is the VantagePoint AI Market Outlook for the week of October the 4th…


