


VIDEO TRANSCRIPT
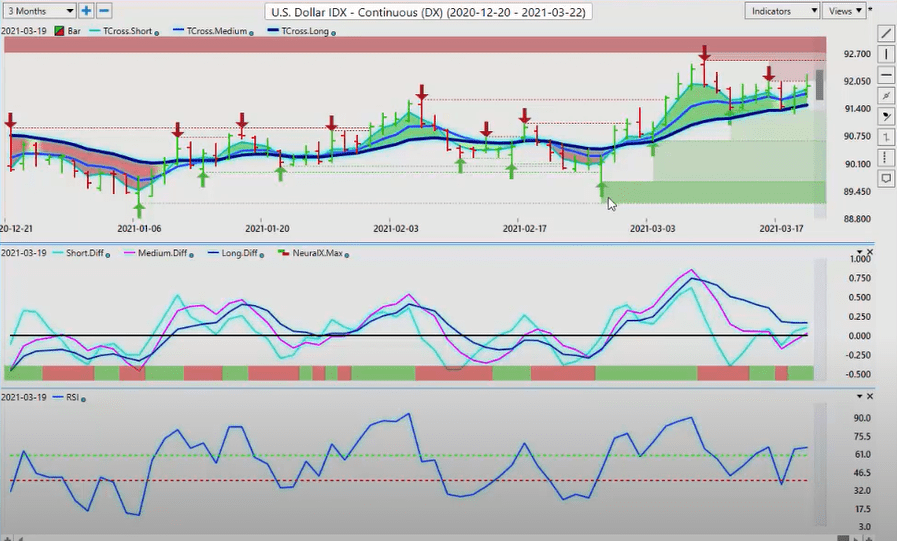
U.S. Dollar Index
Hello everyone and welcome back. My name is Greg Firman, and this is the VantagePoint AI Market Outlook for the week of March, the 22nd, 2021. Now to get started this week, we’re going to begin where we always do, with that very important U.S. Dollar Index.
Now, I’ll do things a little bit differently here this week. I love all the comments and the feedback, and it is good for me to address some of them when need be. So this particular comment was an unusual one, but I think we’ll work on this comment to assist because the purpose of this website is to empower traders, help them understand new technologies. So the question here, or statement, I’m not sure what it is, “You don’t even use volume compared to price action, only indicators such as MACD and RSI. VSA has a clear advantage to see true buying and selling.” Okay, so let’s discuss that for a minute.
First of all, the indicators being used on the chart in last week’s presentation, the MACD wasn’t actually even mentioned in the presentation. The RSI was briefly discussed, but the actual indicators that were being used we’ll discuss that this week and look at the predictions. Because much like last week, the same as last week, this presentation is not a daily trading video. It’s a weekly forecast. It’s an outlook, so of course, I’m not using a VSA type of indicator.
Now, a VSA is a volume spread analysis. This is from the 1930s that’s had limited success over the years and basically, pretty much went away altogether right around the time when the PC market, the home PC market took off, because all of a sudden we all started to have that same type of transparency. But the main difference between volume spread analysis and inter-advanced inner market technical analysis is that intermarket analysis uses a number of different markets and it forecasts and has a certain degree of predictability where VSA actually, for the most part, doesn’t. It’s also the internal structure in VSA, struggles with modern technology, algorithmic trading programs, quantitative trading programs that move at the speed of light. They don’t care how high it is, they buy again. They don’t care how low it is, they sell if the conditions are met. But to understand what actual indicators were being used in last week’s presentation and this week is these predicted moving averages that are based around the correlation of 31 other markets.
Now, when we look closer at that and the Dollar Index, what I had stated last week, is I gave a predicted level that the market would come to, and I suggested it would hold. We can see that that is exactly what happened before the market was even open, rendering, again, VSA type indicators somewhat useless to some degree.
Now, the other thing we want to take into consideration is the Forex market is a decentralized exchange. There’s no accurate way of measuring volume in the Forex market, and the volume in the futures market is limited to strictly the futures. Now, in the stock market, volume indicators become far more useful, but even those have extreme limitations when trying to use a system like that as a standalone. Can intermarket analysis be used as a standalone? I believe it can with several additional indicators, which we’ll discuss. But to be clear, the indicators on this particular screen are using predicted moving average. I’m using the predicted difference measuring two different timeframe trends at the same time. You can see there’s virtually zero lag in a setup like this when the medium-term crosses the long-term predicted difference that told us we are not buyers up here. We are actually sellers. The same signal is starting to turn around.
So the indicators on this screen are based largely around supply and demand, using predicted moving averages as pivot levels and actual failure points in the market with these verified support and resistance zones. When we cross-reference those, that actually gives us an even clearer window into the actual institutional buying-selling when VSA does not, for the most part, under current market conditions.
So when we look at these correlated market, we want to understand what’s truly driving these markets. So if we look at, for example, the U.S. dollar index, we can see that internally, in the VantagePoint software, it’s looking at 31 other markets that have an extremely high correlation. Institutional money is not just trading the dollar. They’re trading the 10-year note, the British pound, natural gas, the E-mini, the Euro, the Swiss Franc, gold. All of these are tied together in some way, along with a number of other individual stocks, ETFs and futures. So when we look at it even closer, we can say, “Okay, these particular markets have a 93% correlation.” So not only does it allow us to do analysis on the Dollar Index, but it also allows us to do analysis on multiple other components of the Dollar Index that are driving it.
So in last week’s presentation, again, using these tools, the predicted moving averages, the verified support and resistance zone, the correlation to 31 other markets that are the underlying driving factor of the target market, that suggested, as I did, that the dollar index was going to move lower but it would be corrective in nature.
What I also stated here, and I’ve stated in here many times, a true way to see actual real volume is using repetitive patterns in the market. Seasonalities are very, very crucial to our trading. I have clearly identified in here multiple times that the dollar rallies at the end of the month, up to about eight or nine days into the new month, every single month. Other than usually in summer trading, this happens 85% of the time. In last week’s presentation, I stated that 85% of the time, no matter how good that non-farm payroll number is, the dollar weakens right after it. That is exactly what happened again because it’s a repetitive pattern.
I don’t need to stare into a single bar and try and figure out where institutional money is or isn’t within that bar. In most cases, what’s happening is the trader is given a false sense of security that he can actually see into institutional buying and selling, when the majority of the time that’s simply not true. This is institutional money, buying real money, buying of U.S. dollars around the beginning of the month. That is likely going to happen again this month. You can see that back in January, 2020, the dollar rallied, you can see right here it did it again in February, it did it again in March, and April, and May and June.
And then when we look at this, into this calendar year and we look closer and say, “Well, that’s what happened a year ago. Is the same thing happening right now?” Well, there’s the dollar rallying on January the 6th, there’s the dollar rallying on February the 1st, there’s the dollar rallying again at March the 1st, the very end of April. This is a repetitive pattern, guys. If you want to measure true volume and repetitive patterns with real money demand, this is a very, very useful way of doing it.
We also bring in the yearly opening price to gauge whether something is truly bullish or bearish. Once again, the predictions are not being made on a MACD or an RSI. As I said, the MACD happened to be on my screen in last week’s presentation but it was not even verbally mentioned through the entire video. But critical levels of supply and demand were listed, starting with the Dollar Index.
So as we move into this week’s trading, our key pivot level is 91.47, the same thing I went through last week. Our predicted differences are rising. This RSI has been modified to a 60-40 split. Even if we look at something like VSA, volume spread analysis, it looks at overbought and oversold. I’m not looking at that. I’m looking at using the RSI as a momentum-based indicator because this is a momentum-based market that we’re dealing with here.
So as the RSI is above 50, it’s bearish, but if it breaks 60 it’s bullish. So we look at the break of 60, like I talked about in last week’s Weekly Outlook, and we use the verified support zone here with the Vantage Point T cross long, the predicted moving average, that, once again, takes the correlation, the 31 other markets when it forecasts the target markets, these are those 31 markets. I’ve highlighted the top 10 positively correlated and the top 10 inversely correlated. This is what is by definition in our market analysis, VSA single-market analysis. VSA can absolutely be used with intermarket analysis, but it should never be used as a standalone, in my respectful opinion. I’ve studied it. To be honest, I haven’t even heard the terminology in probably 10 years now. If you look at the old forums, most of them aren’t even around anymore because, again, this technology was developed in the 1930s. Tom Williams brought it forward.
Now, I’m not saying you can’t use it. I’m not saying it’s not effective at times. I’m showing the difference between intermarket analysis and that technology. So once again, when we look at the dollar, the dollar is still pointing towards further gains coming up next week.
However, we have the Fed on Monday and Tuesday, we just came out of the non-farm payroll number, how the dollar did not sell off through that. But real money is looking closer at what the Fed has stated and they’re not in agreement that rates are going to stay low until 2023. The Fed’s own dot chart did not support that. We’ve got growth, we’ve got a projected unemployment to 3.2%, you’ve got inflation, all of these equal a rate hike. So I think the Fed is going to have to backtrack, but for now we’re looking at these key levels.
Again, this was forecasted four days ahead of the time before it came down to these levels. That’s exactly in last week’s Outlook that was not mentioned with the MACD or an RSI. I’m not even sure this person even watched the video, to be perfectly honest, because all of these levels were outlined before the market even opened, just like I’m doing here today. So right now we’ve got our predicted difference turning, our neural index is up, the event risk that we have is going to be the Fed that may push the dollar down.
Now in last week’s presentation, I also advised with regards to gold and that gold is only along if it can get above this critical level, which in last week’s presentation was 17.51. We came up to 17.51 three days in a row and failed every single day. You can see now that we have a clear signal here, the medium-term crossing the long-term predicted difference. The neural index, again, takes the correlation of 31 other markets. So we have a very mixed signal here, but we have a critical level of supply and demand. In this particular case, it’s supply. Supply is being filled around the 17.50 mark, just like I said in last week’s presentation. But again, the viewer was seemed to be focused on the RSI and the MACD, and that’s, again, not what the predictions were made by. They were discussed, but that is not what the predictions were made by.
So if we look at gold and we look at those properties, or those correlated markets, then we can see what’s really truly driving gold here, the intermarkets. VSA and a lot of other systems out there are single market analysis, they need the addition of intermarket analysis if they have any shot at actually working. So true buying and selling, this is where it is, guys. True buying and selling, this is where it is, on monthly cycles where there’s real, real known demand for U.S. dollars.
So right now the dollar is still soft and probably for another week or so because as we get towards the end of the month, the pension funds, the different governments are going to need to buy dollars to settle trade balances. This is science-based trading. This is not staring into a single bar, hoping to figure out where the institutional buying and selling is, or the illusion that somebody is suggesting that they know where that is. I can honestly say, I don’t know for sure. But what I do know is that there’s certain Forex pairs that run off weakness and gold. The Japanese yen will weaken, the Swiss Franc will weaken, and the Euro, of course, will weaken. The Euro has a very high correlation to gold contracts and, as I stated in last week’s Weekly Outlook, that I don’t think that the Euro… The Euro is going to go higher but is likely going to fail up at that key VantagePoint level because gold cannot get past this critical level based around real institutional money that are correlated to gold contracts.
Gold
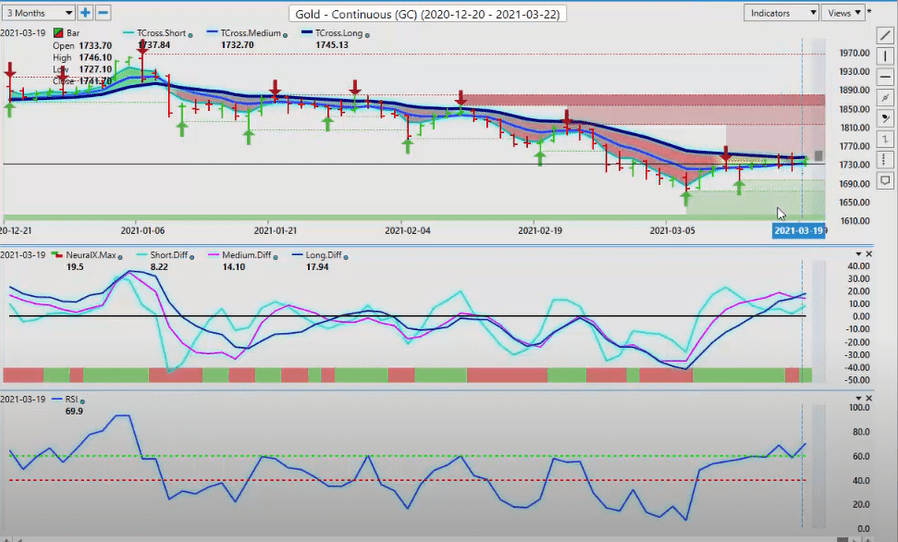
Now, the problem with gold here, which is the argument that I’ve been making for probably two years now, is that gold has a nemesis, and it’s not just the U.S. dollar, it’s Bitcoin. Bitcoin, again, continues to advance. When we look at the correlations, what is driving Bitcoin? This is what’s driving Bitcoin, Litecoin, Ripple, Dash, NEO, Ethereum, all these other digital currencies. But in the other mixture here, we can see we have stocks that are also correlated to Bitcoin. This is very similar to how they forecast the weather. If you have certain types of single market analysis technologies, they look out the window and say, “Oh, there’s a cloud out in the sky there. I think it might rain.” But when you’re using intermarket analysis, we look at multiple factors that drive weather conditions, barometric pressure, we’ve got the temperature of the Pacific ocean, all of these different seasonal factors. What does it normally do at this time of year, a year ago, five years ago? We measure it the same way where you saw that repetitive pattern in the Dollar Index chart. We know exactly when the dollar is going to strengthen based around those real institutional flows.
Bitcoin
Bitcoin is very similar. So if Bitcoin is going to weaken, it’s likely going to be at the end of this month, into the first week of March, when the dollar strengthens. But these are other driving factors that we can see that are going to cause that. So right now, Bitcoin, our key level, pre-identified, not with a MACD, not with an RSI, guys, with the predicted moving average. Same as last week’s presentation. 54,906. That’s our key level.
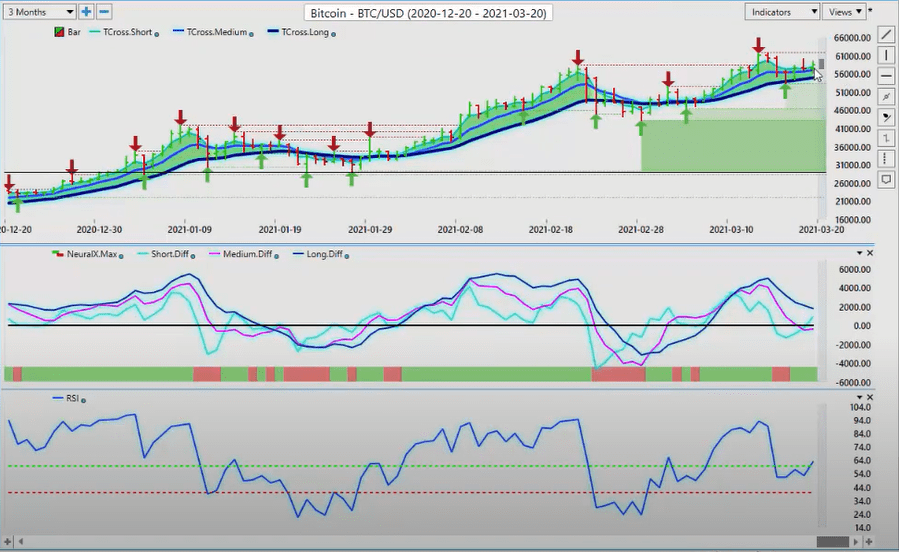
Our indicators are starting to show some life again. We better corrective move on the RSI. We’re now pushing it back up above 60. And once again, using the RSI in an unconventional method with a 50 and a 60-40 split. You can see that as we break above that 60 level, that is a trigger in the market. But then we’ve also got the medium-term crossing the long-term predicted difference, forcing that down. So again, the predictive indicators are just that, predictive. They’re telling us days out when something is going to happen. That’s how I was able to forecast these moves from last Saturday and the previous week.
So if you actually go back and watch that video and look at the outcome, it’s a very interesting conclusion. But using the correlation to these markets is the driving factor as to how I came to those conclusions, not by studying a single bar with volumes and spread analysis because that’s a single-market analysis based around overbought, oversold, some supply and demand, some accumulation distribution. But it’s still single-market analysis at the end of the day. Those other markets are driving the key target market.
S&P 500 Index
Same as the S&P 500 here, guys, the S&P 500 coming under a little bit of selling pressure because I don’t think the market, like myself, is buying into what the Fed is trying to sell me. I believe that they are going to have to hike rates. So once again, when we look at this, our medium-term crossing our long-term predicted difference with absolutely zero lag tells us that we do not want to buy up here. We actually probably want to sell. But at the same time, we’ve got a predicted moving average at 38.93 that we must close below.
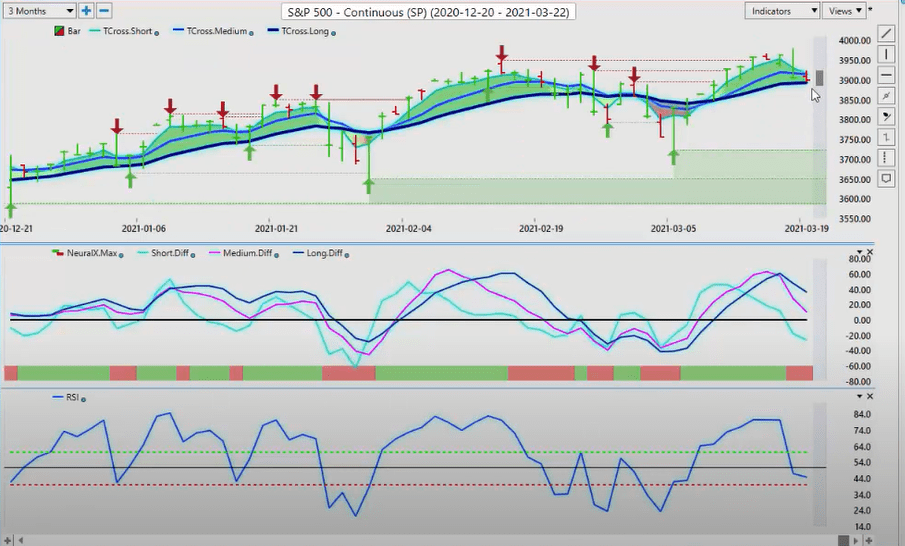
During the Fed announcement, which was somewhat comical, on Wednesday, when we look at the Dollar Index, this actually hit a brick wall. There is no Fibonacci here. There’s no wave here. There’s none of that stuff is here. Just the VP level came down, smashed right into it and hit a brick wall only to rally off it the very next day. We had a failure point. Again, an unconventional RSI, but the RSI is simply being discussed as a visual indicator. The actual driving factor of why the dollar went back up is answered right here. Once again, these other markets. Gold could not advance past its critical level, the Euro currency could not advance past the level that I discussed in last week’s Forex Weekly Outlook. This is, again, by definition, intermarket technical analysis that forecasts multiple markets all at once. So when I look at this going forward, this is telling me that the S&P could come under additional pressure, but we must break down below 38.93 for that to occur.
Now, when we do a comparative analysis, back to that, we also look at the equities, engage the equity markets, not just off the dollar and gold, but also on oil. So oil, once again, got its signal right over here that we’ve got no more buyers up here, the medium-term crossing the long-term predicted difference, the pink line and the blue line start to fall down, and that led to a bigger move. When we use the predicted moving average by itself, we can see that we’re unable to hold above the median price. That led to a retracement and then ultimately, a bigger sellout. We could very easily see the S&P 500 follow oil lower, but we’ve still got growth. I think the S&P 500 and the dollar can rally together.
Euro Versus U.S. Dollar
Now with the Euro, once again here, guys, as I had discussed, there’s our medium-term crossing our long-term predicted difference. The RSI was not used with analysis, and I’ve removed the MACD. Sorry I left it on my chart by accident from the live training room. But, once again, just to point out, I do volume price analysis in the VantagePoint, I teach it in the Vantage Point live training room on Monday and Wednesday mornings. But again, this is a weekly outlook so, again, we’re not using that here.
Once again, the medium-term crossing the long-term predicted difference. Our long-term trend is below the zero line. It’s saying we’re still weak. The Euro failed both days exactly on the key VantagePoint level that I outlined last week. So starting this week, our key level one 11,974. We’re short while below that level. Our indicators are rolling over.
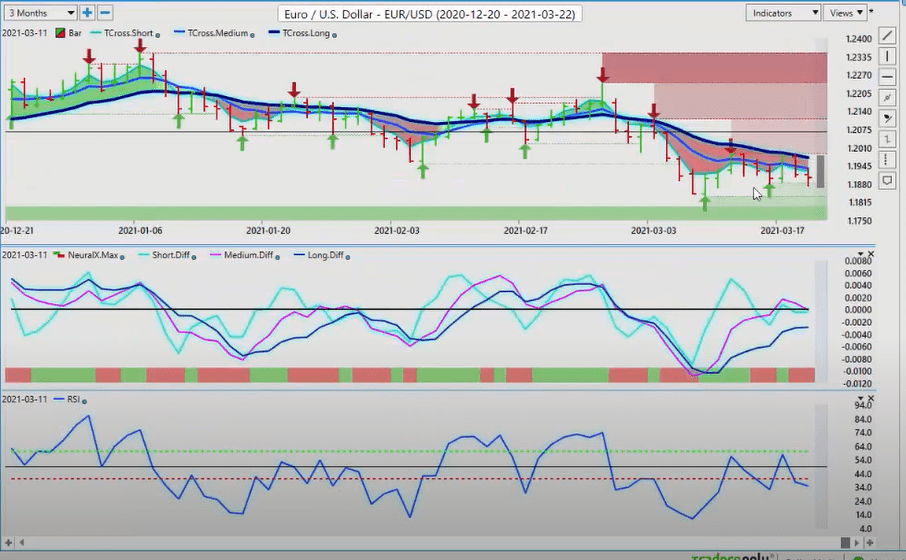
The correlation with the Euro. Once again, when we look at the correlation and the driving factor, why the Euro could not go any higher above that key VantagePoint level is because of these highlighted markets. In my view, it’s these ones, gold, the Canadian dollar, the Euro, oil, the Dollar Index was a killer for the Euro also, again, and same as the New Zealand and some of the other currencies here. But this graph shows us what the real institutional money is doing and where they’re moving their money into. If real money, institutional money is really buying the Euro currency, then that means they’re buying gold too, because they’re 100% correlated. This is the technology, the new technology that we want to understand.
So 11,974 is our key level. Our indicators remain bearish, the Euro-U.S. currency pair has failed. It’s been below its yearly opening price at 12,230 virtually the entire calendar year. We had a retracement with this loan bar rate here, and that loan bar actually is sitting rate on the yearly opening price. There’s no Fibonacci here. There’s no waves. Institutions are sitting at the yearly opening price waiting to get a better price, and they used the yearly opening price on this currency pair to get it. I advised my clients of this. In the VantagePoint live training room, we did this live that day, and I said, “Okay, it’s got to get above that level or right now it’s a premium short at 12,238,” which is strictly based on the yearly opening price.
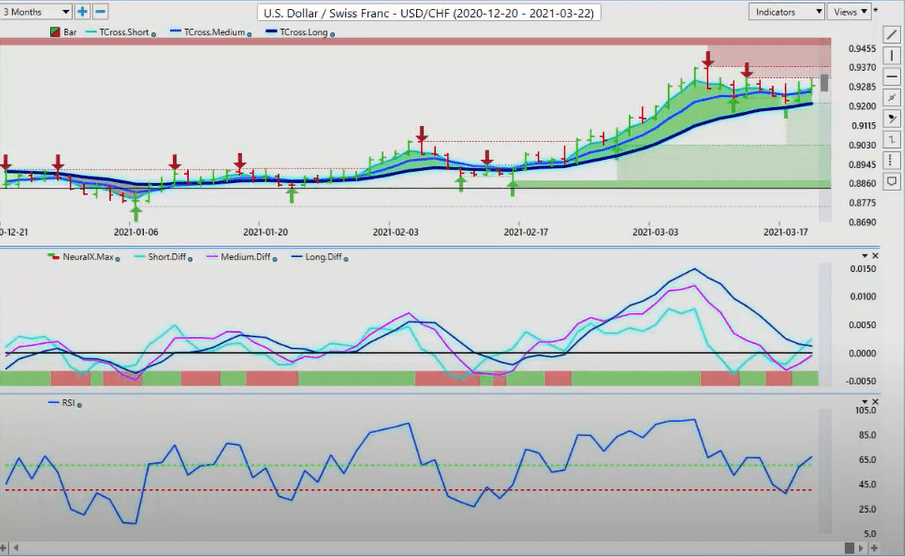
Now, when we go forward and we look at some of our other payers here, there are very specific pairs that you want to buy dollars against and ones you don’t necessarily. So pairs that we look to buy dollars against is U.S.-Swiss Franc, U.S.-Japan, and short, Euro-U.S. So that’s because those three currencies have a very, very high correlation to gold. So if gold can’t break out and get moving here, then those currencies are going to come under further pressure. We can see we’ve had another retracement on U.S.-Swiss Franc, we’ve got down near our VantagePoint T cross long, and it’s moved back up again. Our neural index has gone from red to green. That’s taking the correlation again of 31 other markets when it’s forecasting the target market. We’re reversing and starting to move back up. Once again, only for a visual presentation here, because it’s a weekly outlook, not a daily outlook, that the RSI is showing the pair has some upward momentum building.
Verified resistance is clearly identified in the VantagePoint software at 93.25, an additional verified resistance at this high of 93.75. So if we can clear through these levels, then this pair will continue to advance. I would suspect that that is the likely outcome as we start to move towards the month end, utilizing these repetitive seasonal patterns and monthly patterns in the U.S. dollar, under real-world institutional demand, strengthens at the beginning of the month.
British Pound Versus U.S. Dollar
Now, the pound dollar continues to move sideways between supply and demand. That is the basis of this outlook here, guys, supply and demand and intermarket correlations, not the MACD and the RSI. Again, I’m not sure if that person actually even watched the video. So when we look at this right now, it’s still showing bears. The Bank of England didn’t do much to help the pound at all. But we’re still trapped within this area here, so we’ve got a potential bear trap down here and a potential bull trap up here. But for now, the indicators in VantagePoint are pointing towards further weakness. The medium-term crossing the long-term predicted difference, breaking the zero line, the neural index, same 31 correlated markets are saying it’s bearish, the RSI breaking below 40. Again, there’s momentum building to the downside. Does it have enough momentum to break through this channel? As long as you understand where the channel is, guys, you’re ahead of most.
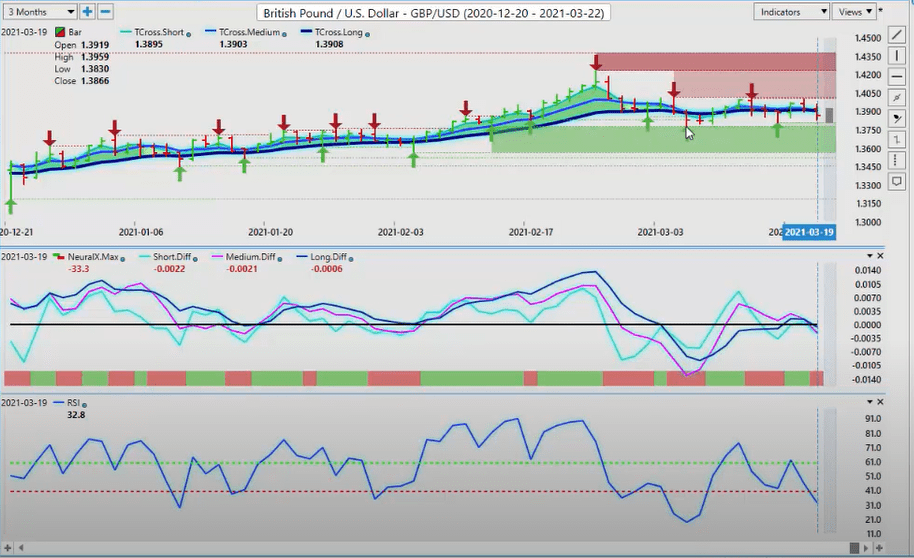
So again, if we base this on the pound and we look at this and say, “Okay, if I’m trading the pound, then I should probably be keeping an eye on if I don’t have the VantagePoint software,” not everybody does. This is primarily a Vantage Point channel. But if you don’t, then you want to be looking at these additional correlated markets here, because these correlated markets are driving factors, Euro British pound, British pound, Japanese yen, British pound, Canadian dollar, light, sweet crude oil. we’ve got Japanese yen, TransAlta renewables, power shares [inaudible 00:25:13]. These are all driving factors of whether the British pound will go up or down.
Again, those correlations can be put to an exact number. The British pound, futures, 99%. ProShares UltraShort, 96.7. These are 91% inversely correlated. You can see the VIX short-terms futures, Dollar Index, VIX, U.S.-Singapore. So again, there’s a real science behind doing the analysis this way instead of using single-market analysis tools. That’s the whole premise of intermarket analysis. So for now, the pound goes in to start the week on a bearish note but, again, we’ve got the Fed that is an absolute wild card, guys.
U.S. Dollar Versus Swiss Franc
U.S. Dollar Versus Japanese Yen
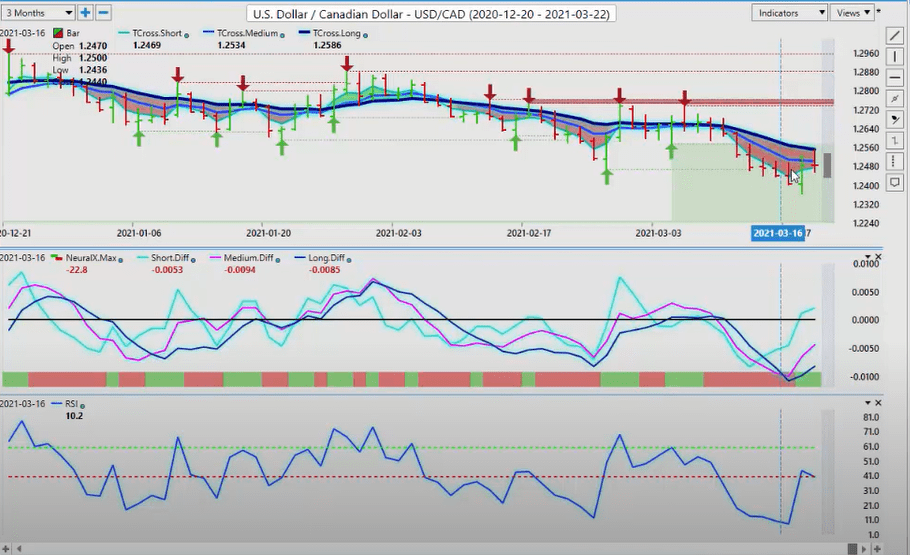
U.S. Dollar Versus Canadian Dollar
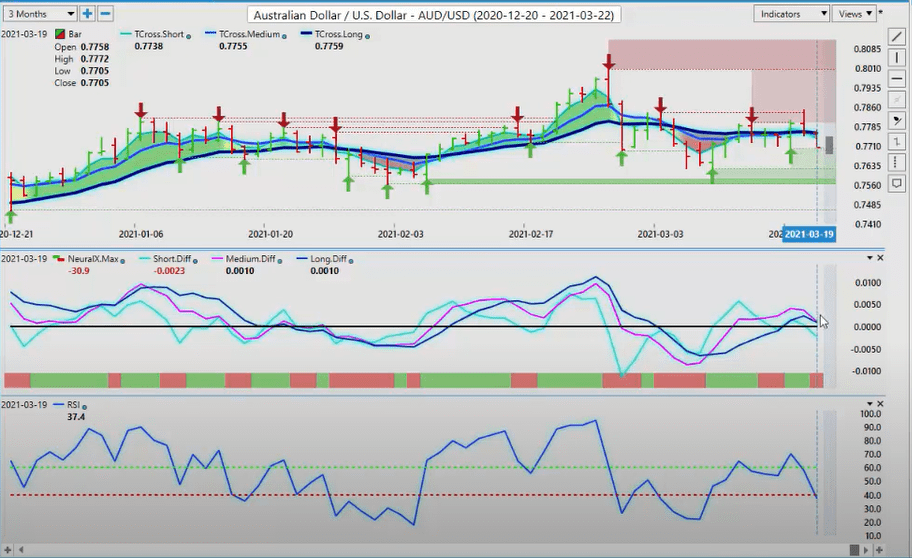
Australian Dollar Versus Canadian Dollar
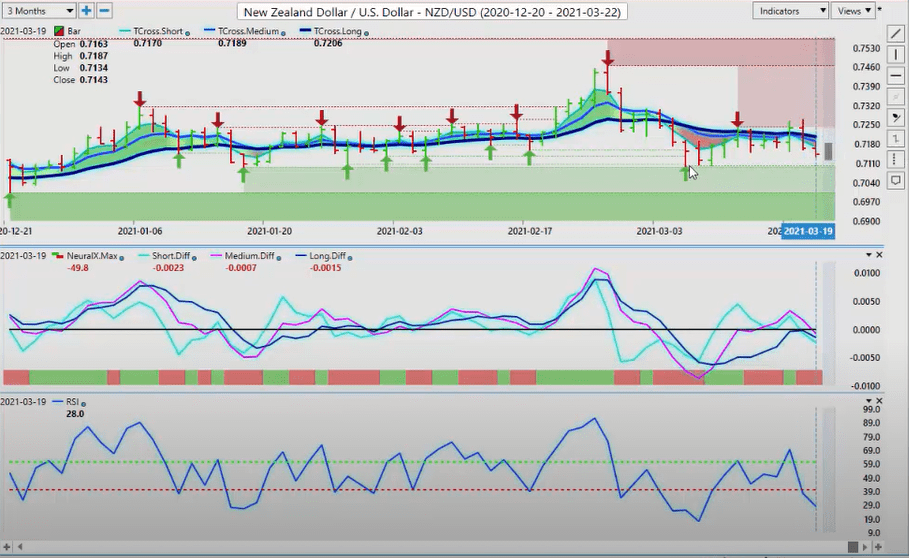
New Zealand Versus U.S. Dollar
Are you using A.I. yet?