Welcome to the Artificial Intelligence Outlook for Forex trading.
VIDEO TRANSCRIPT
Hello, everyone and welcome back. My name is Greg Firman, and this is the VantagePoint AI Market Outlook for the week of June 28th, 2021.
U.S. Dollar Index
Now, to get started this week, we’re going to begin where we always do with that very important US Dollar Index, a driving factor in the currency markets, commodity markets, and equity markets alike. Now, what I discussed in last week’s weekly outlook, excuse me, is the Fed comments, the fed statement. We have had absolutely zero follow through on the dollar.
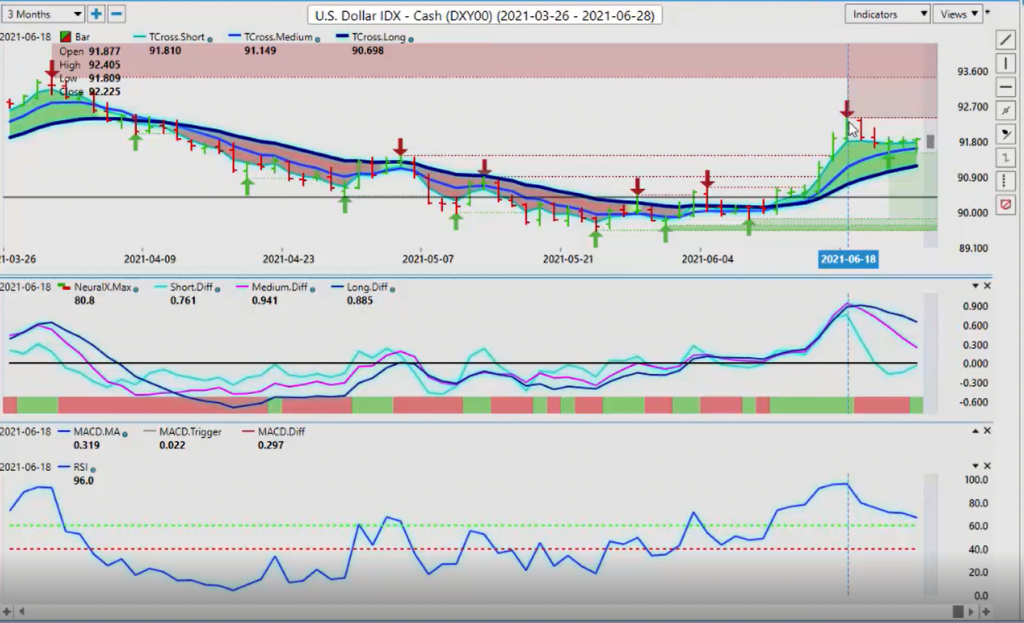
The dollars had two or three good days of a rally, and then fallen right off the board again. But we are still holding above that very important T cross long at 91.17. Now, in this past week in the VantagePoint live training room and with my own direct clients, I discussed this medium term crossing the long-term predicted difference and how effective it is in calling a trend reversal, or it will confirm to us whether or not this actually is a trend.
When we look at the medium term crossing the long-term predicted difference, this represents the medium term trend against the longer term trend. On Monday night’s software, on the update, we can see that we did not make any new highs on the dollar past this particular level. A newly formed verified resistance is now there at 92.40. But as you can see on the very next day or on that, the end of the day on Monday, that medium term crossing the long-term predicted difference completed. We then saw the dollar fall the entire week, not making any gains whatsoever.
The Fed testimony, well, he backtracked again. The main takeaway what I heard was the debt that the US is taking on is unsustainable. That immediately soured any kind of dollar buying. Now, that doesn’t mean the dollar can’t go higher here. They’re still pretty optimistic on the labor markets and things like that. But looking at the VP software, going into this week’s trading, we can assess that we’re still holding above 91.17. If we click on our F8, this predicted moving average used by itself will be very, very important to us this coming week.
We want to see if the dollar can hold above 91.72,. if it can’t and the predicted differences continue to push lower, then we will see the dollar likely retest that yearly opening price down around the 89.80 mark. That is right now a high probability. Now, you’ve often heard me talk about the dollar cycles. The dollar cycle of strength is there’s a little bit there in July, but not July and August or summer trading months. And in most cases, that institutional buying is not really there for very long, maybe a day or two.
We’ll continue to assess this, but the levels you want to watch right now are that 91.72. Now, again, going back to last week’s weekly outlook, I also suggested it’s very likely we’re going to test this channel and we need to stay above this particular channel. The bottom end of that channel is 91.43. If we slip back inside that level and close below that level of 91.43, then the dollar is likely moving lower. That gets everybody prepped. Now, remember, if that dollar index is moving lower, Euro-US is moving higher.
US-Swiss Franc is moving lower. Pound-dollar is moving higher. US-Cad, lower. Aussie-US, New Zealand-US, they’ll be going higher. So again, very important that we’re looking at these things. Now, when we cross-reference this to gold, we can see the exact same scenario. After the Fed on the Friday, there’s Monday trading on the gold contracts, and we can assess here that medium term crossing the long-term predicted difference. Zero lag here, guys.
Gold
It told us if nothing else, do not sell gold down here. Even if it’s wrong, at least it gives us a warning to say, “Look, something is not quite right here.” My view was that the market totally overreacted to what the Fed had stated in the press conference, but that’s neither here nor there now. It’s over. Again, this is an outlook, not a recap of something that already happened. But it is important to show that VantagePoint very accurately predicted this turning point. Now, gold is by no means out of the woods yet.
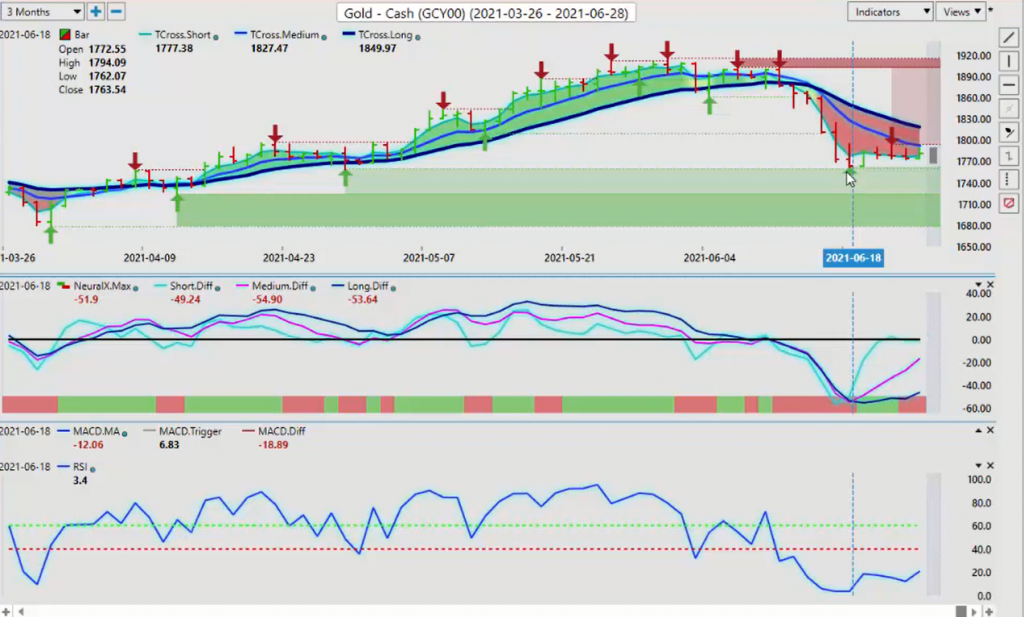
Gold is having the worst year, the worst half of the year that I can remember probably going back to 2015, 2014. It’s been below the yearly opening price at 1904. We got all tangled up in it up here, and we just can’t seem to get going. Now, I do anticipate towards the end of the month that the volatility in gold is going to tick up as they start eliminating some of these paper contracts through Europe, et cetera. I’m watching that very closely. But for now, gold is not… There are very few sellers here. The way we would look at this is identify the low point, 1762.
If we break down below 1762, then gold could be getting ready to make another run to the downside. But the longer this level holds, the more likely we’re going to retrace at a very minimum back to the 1818 area. That is the scenario that I’m currently looking at. Because again, those budget deficits are not getting smaller. They’re ballooning up with COVID, with the current US administration. I think they’re fighting over a couple of different spending bills right now. I don’t know if they’re going to pass or not. I’m Canadian, so I have no horse in that particular race.
But again, it doesn’t look like it’s going any further. Now, the predicted RSI has been in oversold territory for a considerable period of time. That’s why we don’t use overbought and oversold signals. We’re looking for momentum in the market. There is very little momentum at the current time for dollar buying or for gold selling. That’s what we want to make sure we’re looking at. If we use that same predicted moving average, that blue line by itself at 1781, in my respectful opinion, if we can hold above 1781, then we should easily be able to target the 1818 mark.
S&P 500 Index
That’s what I would look for right now, but we must clear that very specific pivot level. Now, as we look at the equity markets, again, screaming higher. Unbelievable that the S&P is almost at the 4300 mark, but it is. And again, the further back we go on this, you can see that these equity markets just are relentless. Going back to the original buy signal from VantagePoint a year ago, seems like a lifetime ago, doesn’t it? At the 3,200 mark, now we’re all the way up where we are now.
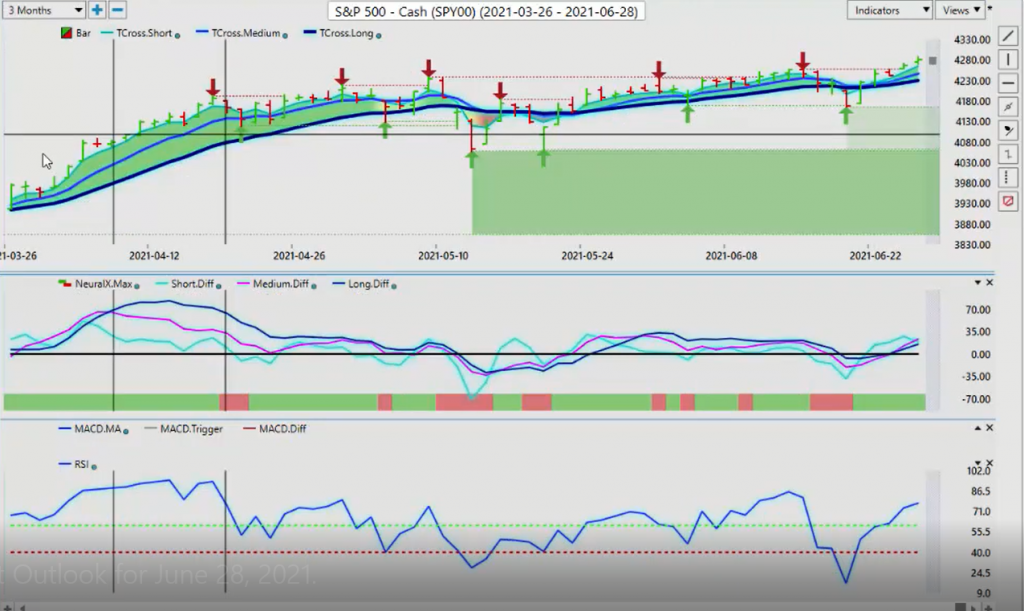
This is another classic case that every time we try and sell this thing, it goes horribly wrong, or at least it has for me. What I think is an easy sell trade is the exact opposite. It instantly goes against me. When I look at this right now in the equity markets, we have a medium term crossing the long-term predicted difference. I’m a little shocked by this, but it is, and I’m not going to trade against it. The easiest way for me to do this here is, again, if we look at this lone bar here on the S&P 500 4164, that will be our support low.
We’ll call it our Fed low after the Fed did his damage. That’s the furthest down they pushed it at the 4164. And then you can see we’ve got the next five days we recovered and moved higher. Once again, I’ll be watching this very closely, but as long as we’re holding above 4229. And what I will say is I am anticipating next week at some point a retest of that 4229 level. At that point, we would be looking to buy. But as you can see, using the RSI, we’ve got momentum when we’re holding about 50.
But when we break above 60, that is showing momentum building on these stocks. We’ve taken out this high. But as you can see by these verified zones, in most cases, once we take out a high, we often have a significant pullback. I am anticipating a pullback, but I cannot endorse a short, or if you are looking to short this, just be very, very cautious with it.
Bitcoin
Now, as we look at going into Bitcoin, another wild week in Bitcoin, but again, I was doing this one again live in the VantagePoint room.
And to be perfectly blunt here, guys, I could care less what China has to say about anything, and I have growingly have less interest in anything Elon Musk has to say with regard to Bitcoin. China is all in on Bitcoin, or excuse me, they’re all in on crypto. They’re just not all in on Bitcoin. They want their own digital currency, not Bitcoin. I don’t believe they’re going to win this battle as long as we keep pushing back against them.
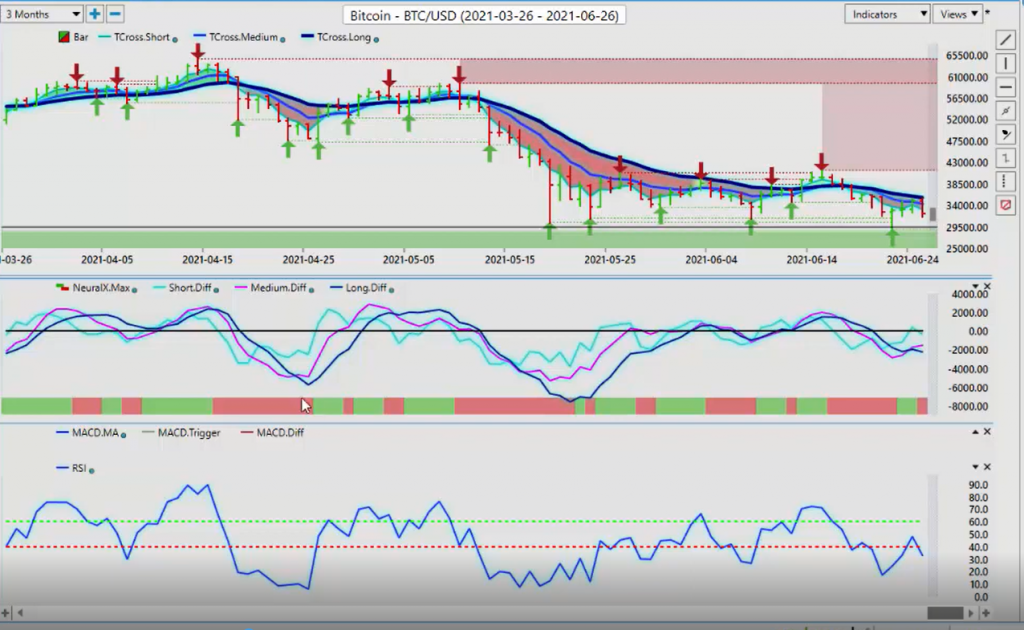
What I’m looking for is, again, what I had stated in last week’s weekly outlook, there’s two yearly opening prices, one at 33,500, but the important one, the Coinbase yearly opening price is sitting at 28,880. That’s the one to watch. We did that live. We got a $5,000 bounce off of that level on Tuesday and Wednesday. But again, it’s all about blocking out the noise. They’re telling us that Bitcoin is a scam. They’ve been telling us this for years, guys. The annualized returns on Bitcoin, 230% per year. I know it’s volatile.
I get it, but I’m not going to ignore a trade that has that kind of track record. When I look at it right now, Bitcoin challenging that VP level at 35,682. We’re looking for a break above that level in order to get this thing moving again. I believe that it has a good shot at that, but the key level you want to watch is the 28,880. If we close below that two days in a row, at that point in time, Bitcoin is in big trouble to be perfectly honest. Now, when we look at oil next week, once again, oil following the equity markets up, the levels that you want to watch here.
Crude Oil
Once again, the Fed hammered the oil contracts down, and it’s done absolutely nothing since on the downside. It actually it’s fully recovered as has the stock market. But always remember the high correlation between oil and the S&P 500, one goes down, the other one goes down with it in most cases. But usually oil would be the odd man out, even if stocks continue to advance. But for now, our key VP level is holding that level is 71.09. We’re long well above that level.
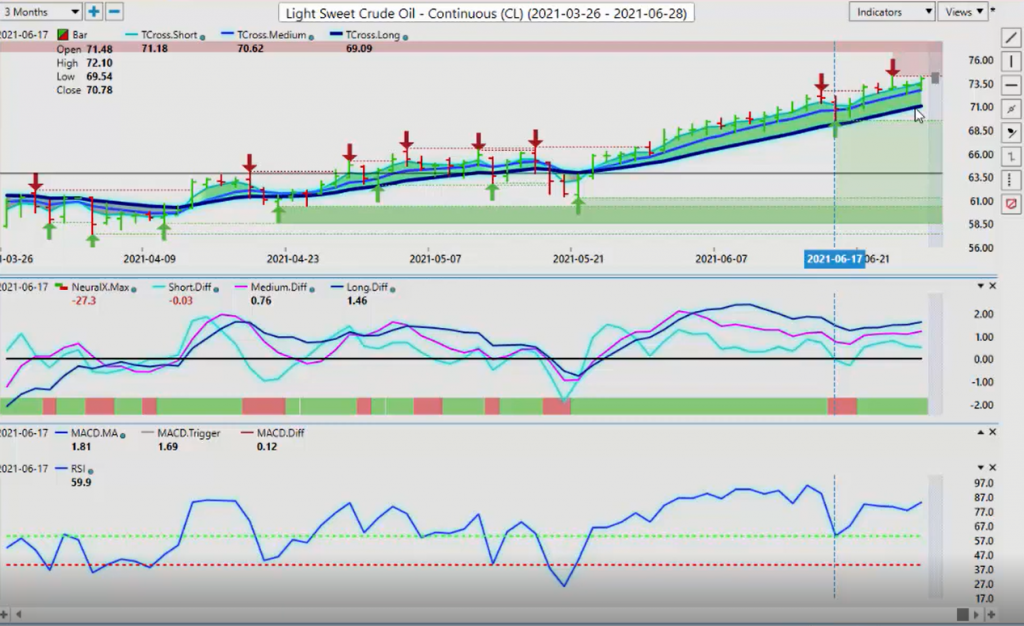
If we click on our F8, you can see how the market is hugging this predicted moving average almost on a daily basis. I actually used this predicted moving average for intraday trading, the lone predicted moving average, and I always make sure that I’ve got my stops above the T cross long, depending which way I’m trading it. But again, oil’s still looking like it has further upside potential.
Euro versus U.S. Dollar
Now, as we look at the Euro pair, once again, it’s very important. The verified zone has immediately identified a bottom here on the Euro.
That gives us our support. I could argue indirectly long while above 1.1847, but we must get above this T cross long at 1.2021. The Euro currency, its highest correlation is to gold. If gold starts to recover, you can take it to the bank. The Euro is going to follow back up with it. But if gold crashes, the Euro will go down also with gold. We’re watching gold very closely. But once again, we can see how VP called what happened from last week after the Fed. Once we were done with the event risk, this is a classic buy the rumor, sell the fact.
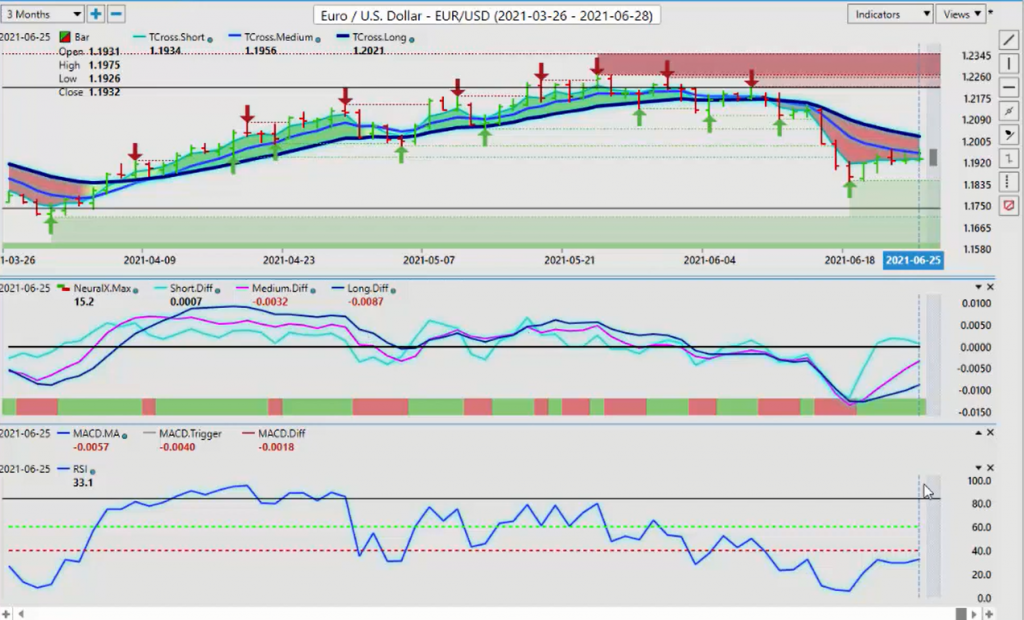
By Monday, the medium term crossing the long-term predicted difference has told us, if nothing else, do not sell the Euro down here at 1.1845 or even below 1.19 is very shaky. The predicted differences are rising. The neural index has been a backup support for the predicted differences the entire week buying on a dip. But now, again, our upside target is 1.2021. We would have to clear that for any further upside. Now, the obstacle that’s currently in the way of that is the long predicted, 1.1944. We must get above this.
If we have any shot of getting back up above the 1.20 level. Right now, the indicators are very mixed. The predicted RSI is showing almost nothing for momentum here, but the predicted differences are strong. They’re pointing up and there’s good separation between the pink and the blue line. So again, watch that level of 1.1944. If we get above it and we close above it, then we’re likely going to move at least back to the 1.2021 area.
U.S. Dollar versus Swiss Franc
The counter trade to the Euro-US long would be US-Swiss Franc short. You can see the exact same signal once the Fed had his fun with us.
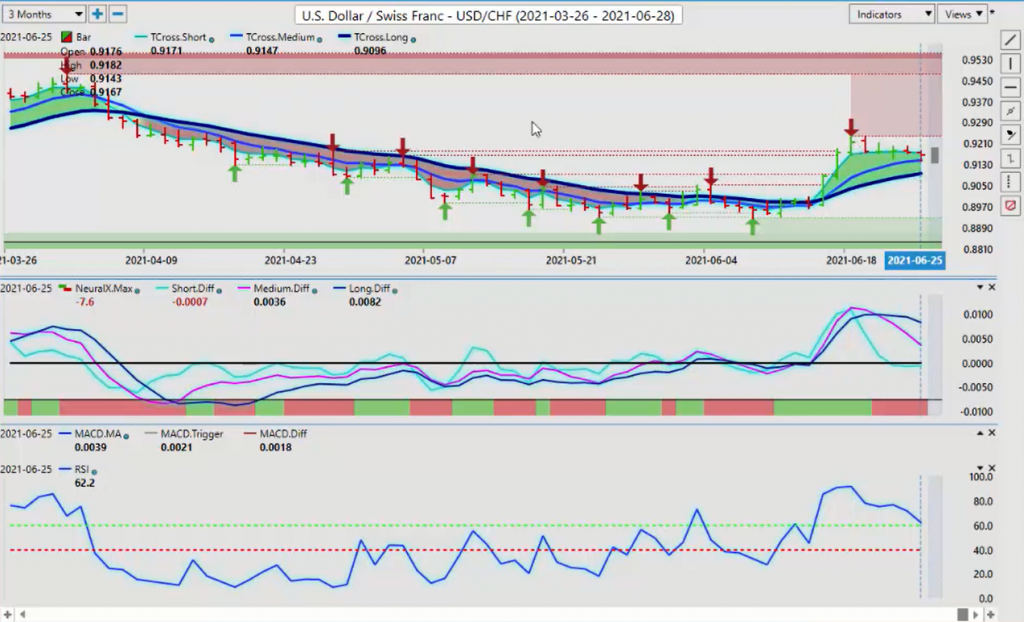
There’s your three-day Fed rally. And then at the end of the day on Friday, nothing. And then on Monday, we hit that same level. So again, our resistance line on US-Swiss Franc breaking it down so it’s very digestible is .9238. We have to clear that level if there’s going to be any further gains. I anticipate that likely this pair is going to trade between that verified resistance high and the T cross long at .9096. We must break down below that. But again, getting closer to price action using that blue line by itself, .9159.
If we can close below that, then we should see this pair pickup to the downside, but also keep a very close eye on stocks.
British Pound versus U.S. Dollar
Now, with the pound-dollar, the Bank of England is selling this one pretty much all over the place. But again, when we look at that Friday bar after the Fed here, we’ve done nothing since. The low point again, if we look at that Fed low, we’ll call this a Fed bar, the low is 1.3789. That represents our support level. If the pound-dollar is going to bounce, that’s where it’s going to be. We remain firmly above the yearly opening price at around the 1.3660.
I forget the exact number, but it’s 1.3668, I think, long while above that particular level. But once again, immediately after the Fed, the VantagePoint software responded with the medium term crossing the long-term predicted difference. That signal continued to develop the entire week. Again, when you look on these different websites and all these different wild and wacky theories, which is fine, but they’re saying how bullish the dollar was last week and there’s simply nothing factual in that statement.
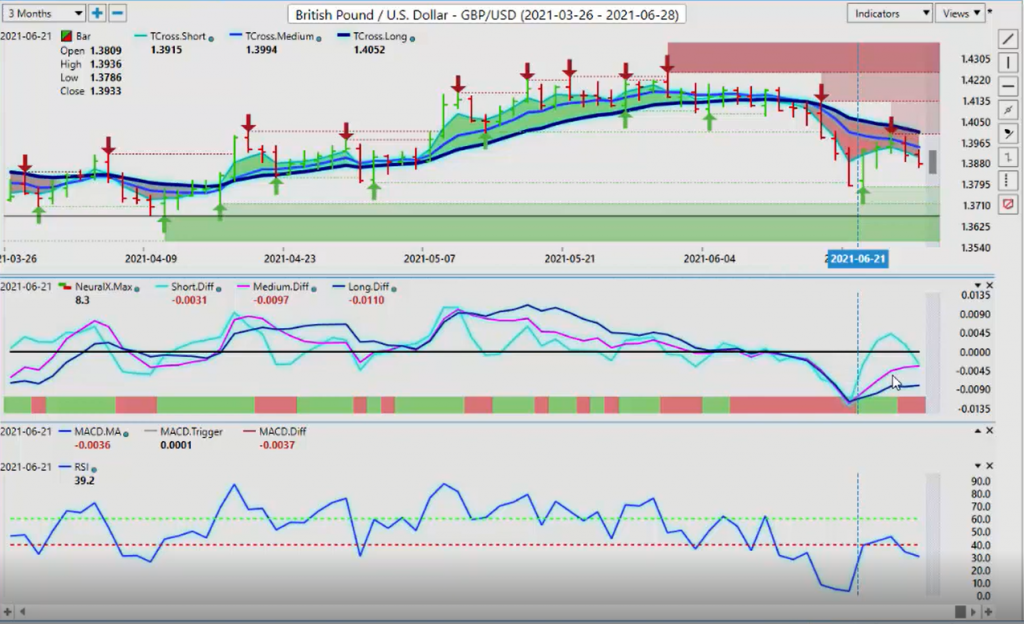
The dollar did not make gains against any of the currency pairs the entire week. It went the exact opposite direction as you saw also with the dollar index. So right now for the pound, I anticipate that they could be gearing up to start buying this thing again. Again, we know exactly where that low point is, 1.3786. I anticipate we will come down and test that level early in the week only to potentially see it reverse higher towards the end of the week. Now, again, we always have to remember there is going to be some dollar buying at the beginning of the month.
The question is how much because of the month of July. But again, watch that level very closely or any change in the direction or slope of the predicted differences. Now, the predicted RSI, absolutely that is concerning to me because we were not able to get above the 50 level, but I’m going to chalk that up to noise around the Bank of England. I think the market will soon forget about anything that they’ve said, and they will go back and look for places of value to actually sell US dollars.
U.S. Dollar versus Japanese Yen
Now, as we look at the dollar-yen, once again, significant resistance with these VantagePoint verified resistance zones. 110.96, we poke up above it, but we’re just not able to close above it. This needs to get going. Now, the medium term crossing the long-term predicted difference to the downside with a very mixed signal, the neural index, but the neural index has turned red again, suggesting that there is very little upward momentum here. What I would suggest that you watch very closely are two things, the S&P 500 and gold.
If gold continues to just go sideways and the equities continue to climb, dollar-yen is going to follow that. Again, if gold spikes, that’s a positive for three currencies, the Swiss Franc, the yen, and, of course, our good friend, the Euro. So watch that very, very closely, but we must get through this 111 area and break free and clear of it. If not, the longer we linger up here, the more attractive and actual short becomes. That key support is 110.19. If we click on our F8, get closer to the flame, so to speak, that pivot area is 110.67.
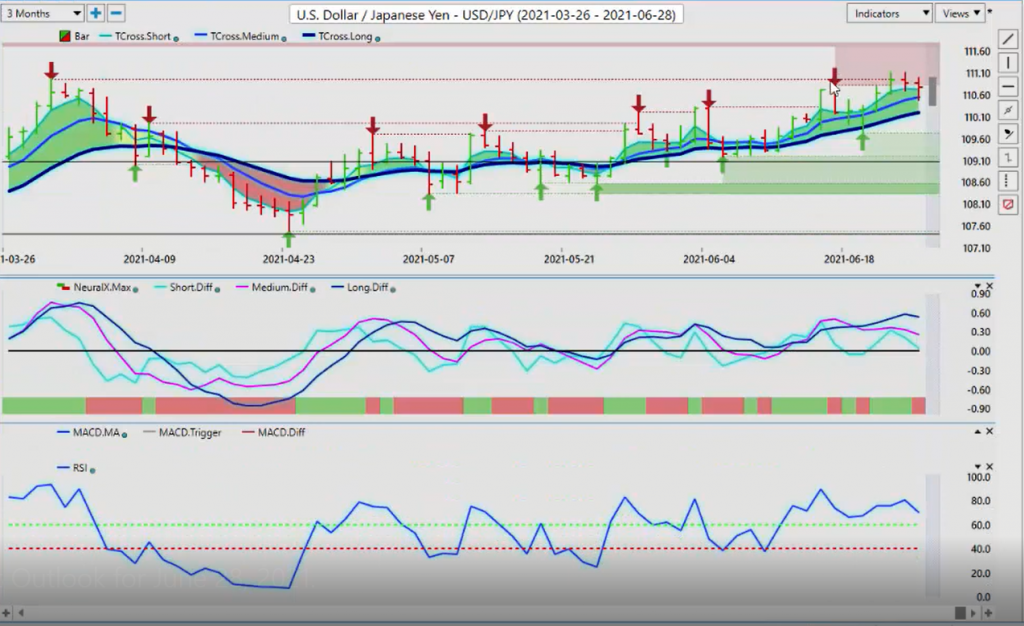
A break of 110.60, we’ll see likely a fairly sharp move back down to the 110.19 Area. And that in my respectful opinion is the likely play, but not on Monday. Probably on Tuesday. Now, as we look at our three main equity-based currencies/commodity currencies, it depends what you want to call these ones, guys. My view, they’re more of an equity-based currency. Because every time that S&P 500 goes higher, so does the Canadian-dollar, the Aussie-dollar, the New Zealand-dollar. As we can, again, assess here, it’s important.
You can use, by the way, if your own trading platform Thinkorswim, just put it on a weekly bar with all of the markets that I’ve covered here today and use the Fed weekly bar from not last week, the week before, and just use the high and low of that to gauge where you should be buying and selling to assist with that, and of course, the VP predicted high and predicted low. But in this particular case, we see, again, the culprit, the medium term crossing the long-term predicted difference told us, do not buy a Fed bar.
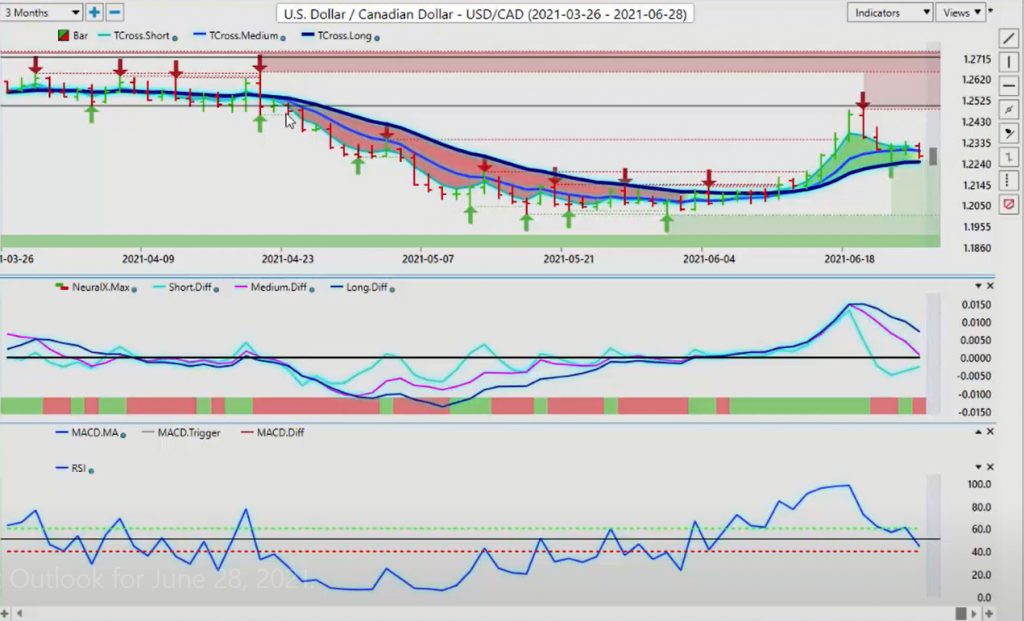
Do not buy a fed statement. Wait until we start the next week. The start of the next week, which was last Monday, the medium term crossing the long-term predicted difference. But the neural index has been very conflicted this entire week and the position of the RSI, you can see it’s 45.1. Now, if we can breach this T cross long at 1.2246, then you’re going to see another push to the downside. Here’s what we need for that, guys. We need oil prices to continue to advance, and we need the S&P 500 to continue to advance.
U.S. Dollar versus Canadian Dollar
Gold is not a big player with the Canadian-dollar. It’s all oil and stocks. If those continue to advance, then you’re going to see US-Canada take out this 1.2246 level very early in the week. At that point in time, we potentially have to, again, target the 1.20 level. I think that that’s not an unreasonable target as we move towards the fourth quarter. Now, the Aussie and the New Zealand, same trade here, guys.
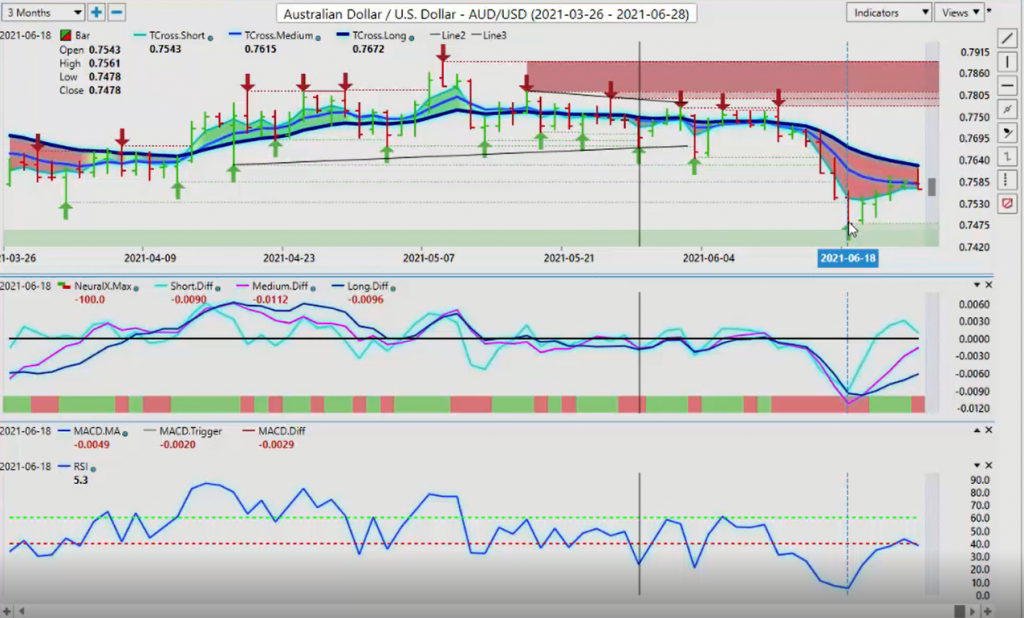
But once again, we can see the bottom end of that Fed from a week ago, Friday, it’s done nothing but go up since, the medium term crossing the long-term predicted difference. But this is why we combine indicators. The predicted RSI is, again, it’s failing around this 50 level. The very minimum requirement we need is for the RSI to get above 50, but we know where our support is. The support low on the Aussie now comes in at .7478. We need to hold that level for the entire week here, guys. Now, another way you can do this if is…
Australian Dollar versus U.S. Dollar
I’m not going to say no to a short up here, it’s possible, but I don’t like shorting the Aussie or the New Zealand-US or buying US-Canada when stocks are this strong. So again, we watch this key level, .7626, and look for any kind of a strange movement on the predicted RSI. But we’ve got to break above that. If we click on our F8, you can see we’re even struggling here with the long predicted at .7571. That’s the immediate level we need to hold above if we have any shot at taking out that T cross long. And of course, the same thing applies to New Zealand.
New Zealand Dollar versus U.S. Dollar
Now, New Zealand’s a little more bullish than what the Aussie has been on the weak, surprisingly. But again, that medium term crossing the long-term predicted difference with the neural index, that reverse check mark that I’ve seen in the predicted RSI so many times though is a warning sign here. So again, these pair, the Aussie and the Cad, they need to get moving here or else they’re going to slip back into that range.
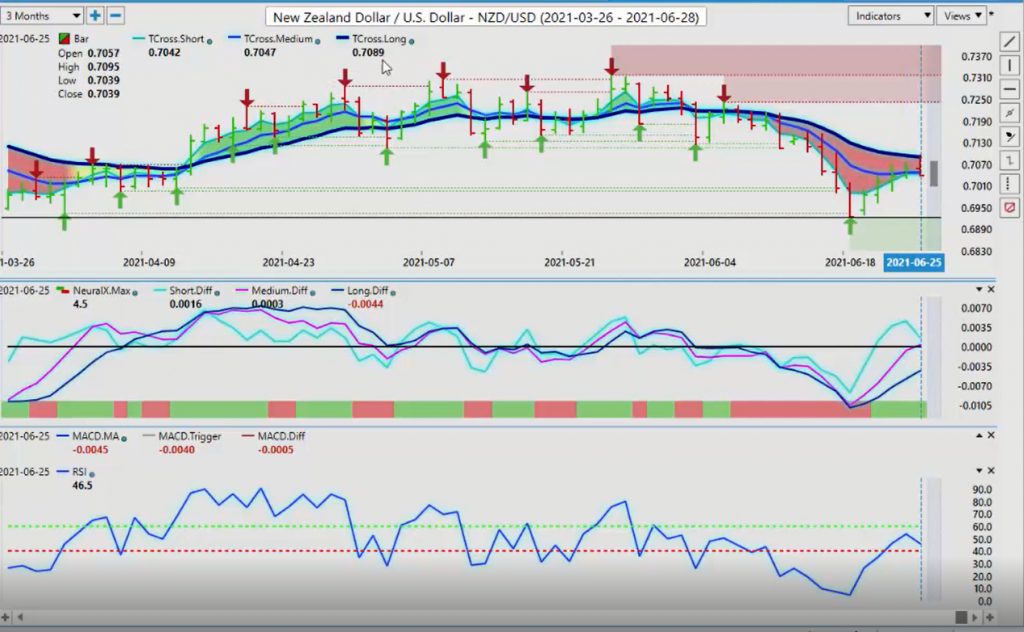
Because again, without taking out this T cross long on the New Zealand-US pair at .7089, then that is the resistance area that is stopping it from breaking above. And trust me guys, I’ve been doing this well over 20 years. This is not a coincidence that it stopped exactly on the VantagePoint T cross long. I couldn’t even tell you how many times I’ve seen this across so many different markets. We will have, again, a very choppy week. It is the end of the month, and we are getting ready to go into summer trading. So you should expect some volatility.
With that said, this is the VantagePoint AI Market Outlook for the week of June the 28th, 2021