Welcome to the Artificial Intelligence Outlook for Forex trading.
VIDEO TRANSCRIPT
Bitcoin Versus Gold Correlation
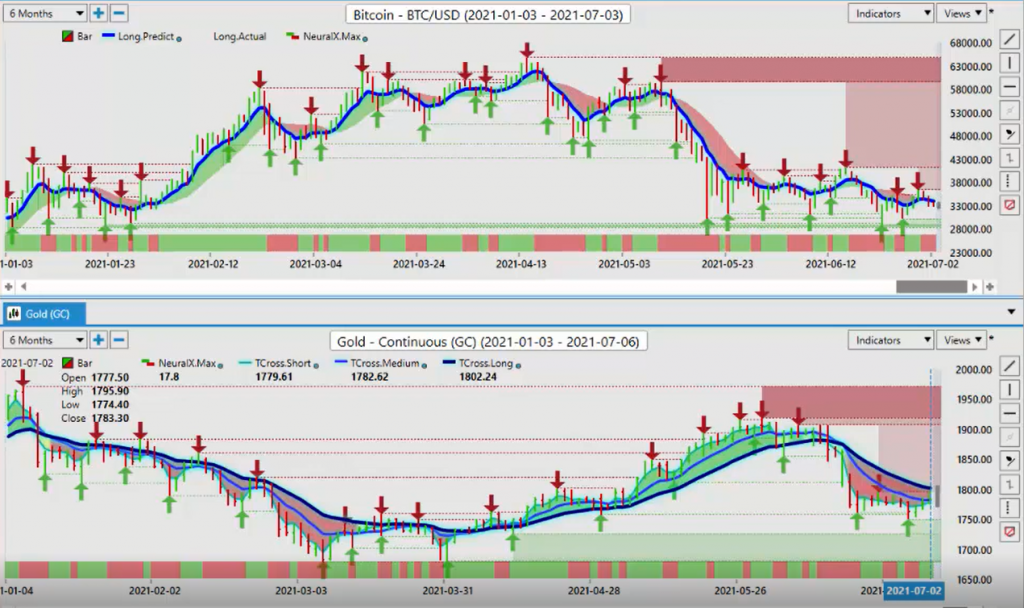
Hello everyone and welcome back. My name is Greg Firman and this is the VantagePoint AI Market Outlook for the week of July the 5th, 2021. Now to get started this week, we’re going to begin a little bit differently than where we normally do. We’re coming off the US non-farm payroll number, a very solid number in the unemployment. But yet, the dollar sold off right after that. Now what we want to do is look at some of these intermarket correlations more directly in preparation for next week’s trading. Now, what I’ve done here is I’ve taken the VantagePoint software and split the screen so we can see what the effect of rising gold prices may have. Now, gold is coming up to the VantagePoint T-Cross long at 1,802. This is a major hurdle for gold. Now let’s assume that gold is going to break above that for whatever reason. In our VantagePoint software, if we click on our F8, we get our long predicted.
You can see that a move is starting here. Now, over a six-month period, what we want to understand is sometimes we get a little bit heavy on the indicators here. If we look at the predicted moving average by itself with the neural index, split the screen and bring in some of the major global markets like Bitcoin, we can see that the rise of Bitcoin has led to the fall of gold, gold have having its worst half of the year for at least the last five or six years that I can remember. It’s having just a terrible year, holding below that yearly opening price, the entire calendar year, selling off again just a couple of weeks ago in the early part of June. But I’m not convinced that gold is down and out just yet here. Now we can see that we’ve closed above 1,777, that key VantagePoint long-predicted, closing the week out here at 1,783.
Now that could be just because of the holiday long weekend on the July 4th in the US. But when we look at this, we can see the intermarket correlation. If gold is to recover, then that could put downward pressure on Bitcoin. We can see the intermarket correlation. As Bitcoin goes higher, gold has gone lower. So basically gold has had a pretty easy run here when it comes to competition. Its main competition has been the US dollar. The dollar goes up, gold goes down. Well, that’s still there guys, but the thing we have to look at more closely is again, these direct correlations. As gold plummeted, we can see that the dollar immediately took advantage of that. So the intermarket correlation is extremely powerful.
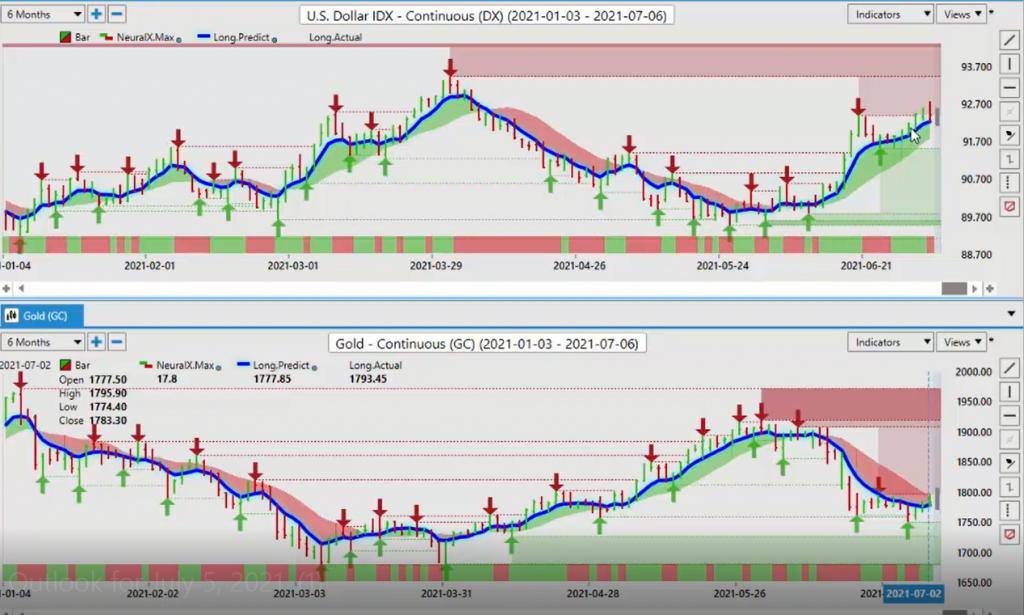
Dollar versus Gold Correlation
Now, even when we look at some of the other metals, the one that I’ve got my eye on currently is palladium. Now palladium, we can see has cleared the VantagePoint T-Cross long at 2,718. When we click on the F8, we can also assess here that the main trigger for this move is when the market closed above the long predicted, sending gold up or sending palladium up, excuse me, and gold is very slowly following it higher. So assuming that gold is going to follow, then this would suggest that gold has a chance to break above this key verified resistance again at that 1,795 mark.
But the key thing we want to understand is the intermarket correlations.
Silver versus Gold Intermarket Correlation
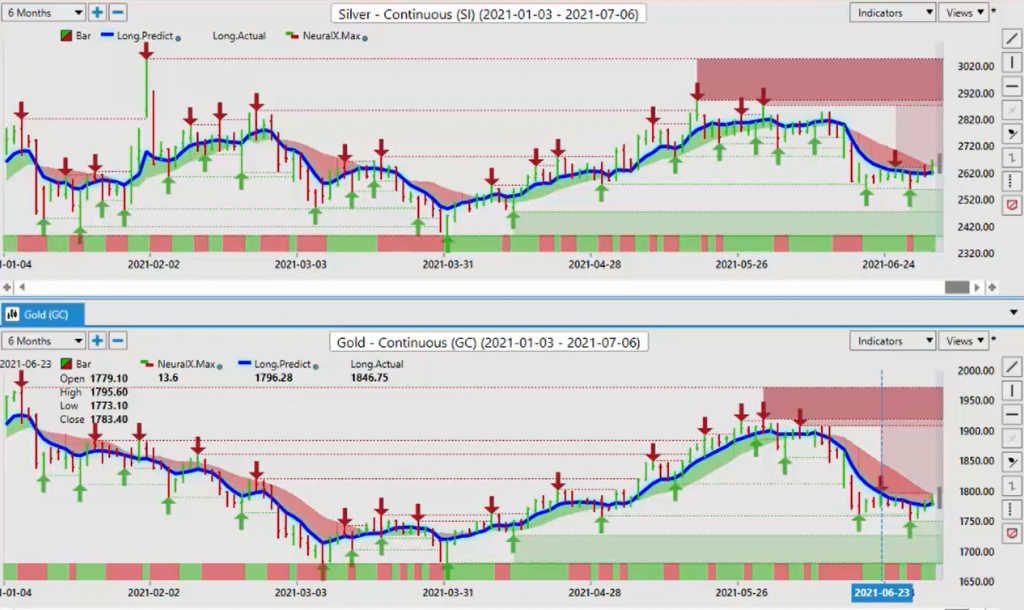
Silver and gold, there literally I would say is about a 98% correlation between these two metals. Now, as we look at the S&P 500, we can see that that correlation’s broken down a bit. As gold started to sell off, not only was Bitcoin putting pressure on gold, but so was the S&P 500.
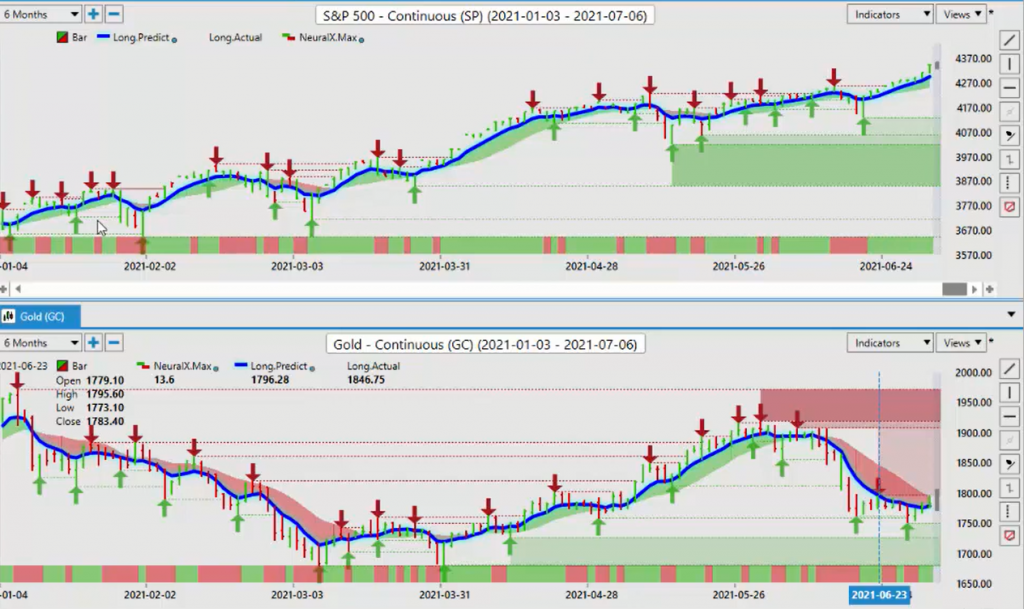
So if gold is to turn around, then that would suggest the S&P could be getting ready to move lower. Bitcoin moving and correcting a little bit lower, not necessarily a trend reversal, but just a shift in sentiment.
If we look at copper versus gold, again, very, very high correlation, but copper tends to stand on its own merit. So when we break this down into our currency trading, which is very, very important, we run through these currencies and we can see right now that as gold started to move lower, it pulled the Aussie US down with it. Now stocks were still moving higher, but the Aussie responded to gold selling off and that increase in dollar demand. My view is again that we have an institutional dollar cycle of buying at the beginning of the month. And 90% of the time, 85% of the time, that dollar buying dries up the Tuesday or Wednesday after the non-farm payroll.
Aussie versus Gold Correlation
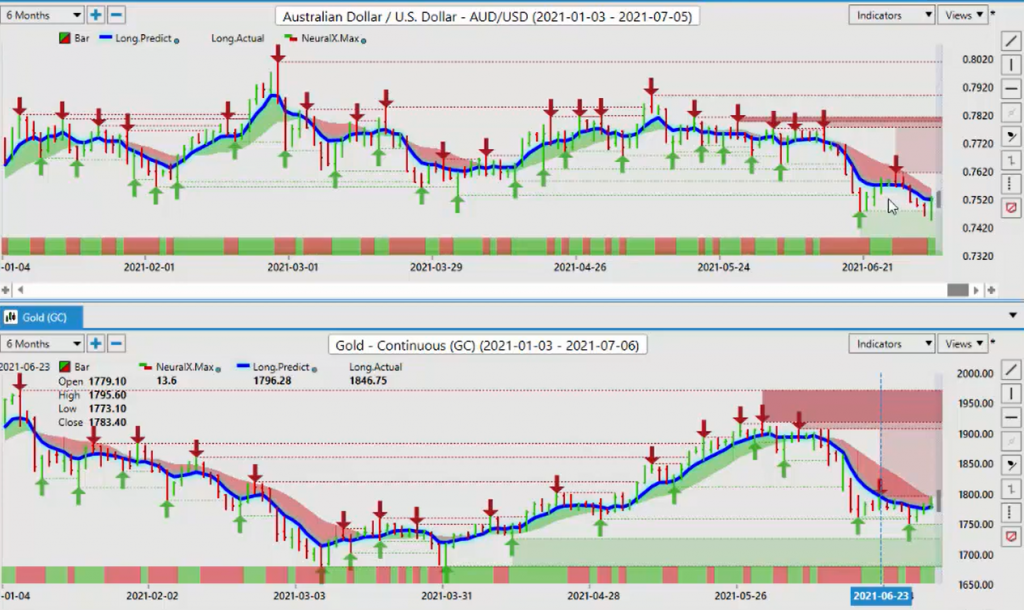
But the first thing we want to understand here is that if gold can start to turn around and recover, then that means the Aussie will recover also.
British Pound versus Gold Correlation
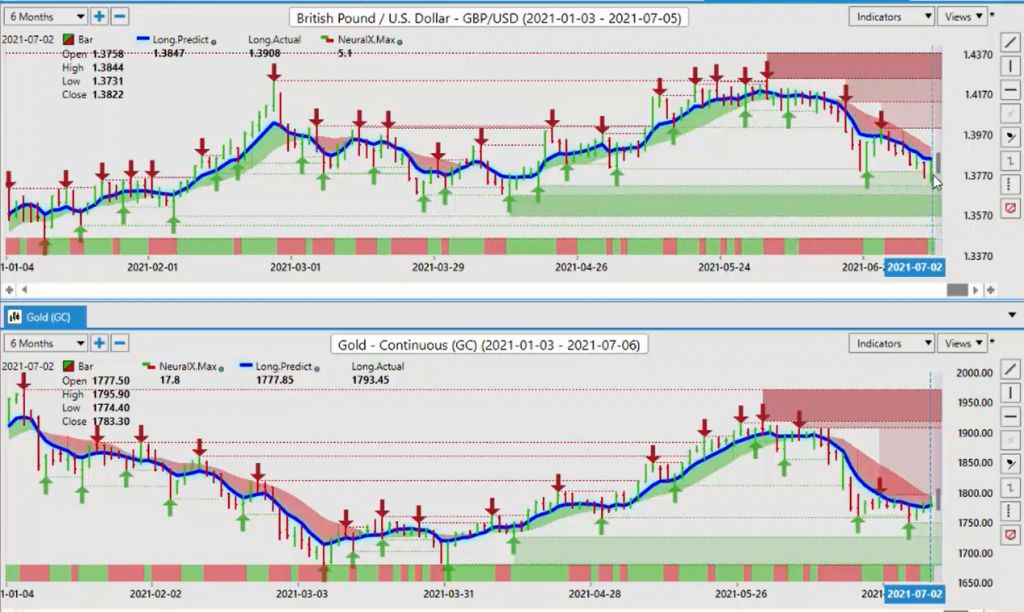
If we apply that same methodology to the British Pound, we can see that again, gold pushing lower, it’s bringing the British pound down with it. So again, if gold recovers, then Cable is likely to recover.
Euro versus Gold Correlation
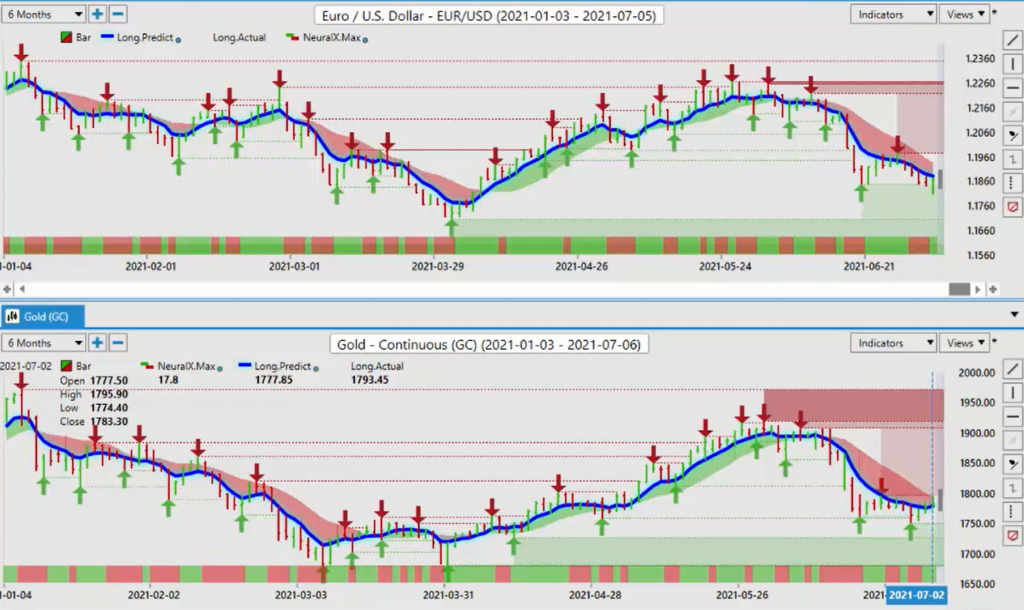
The Euro has the highest correlation to gold that I’ve seen. If you look at these charts in a split formation, you can see that it’s almost these two charts are virtually identical.
So again, before I start the main presentation, if we look at these Intermarket correlations and we apply something like gold, a lot of people believe that there’s a long-term seasonality, 20-plus year seasonality that gold strengthens in the month of July. I would argue against that to some degree that yes, there is over the 24 years. But if we look at it on an exponential basis, the last five or six years, that has not been a strong seasonality. So there is one there, but it’s a question of what kind of year we’re going to have or what kind of month we’re going to have in July. But the main thing is to understand that as people pile into Euro US shorts, is it possible that gold is moving higher?
Now the one thing I will point out that I’ve talked about in the VP live training room and with my own direct client base is that gold started to move higher on a positive ADP report. Now, we saw this a couple of months ago in reverse. We got a really good ADP report, but gold… Or excuse me. We saw the same thing a couple of months ago when we had, I think 1 million jobs is what they were forecasting two months ago, should have sent gold into a death spiral. And the exact opposite happened. Gold actually strengthened and that led to increasing dollar weakness.
New Zealand Dollar versus Gold Correlation
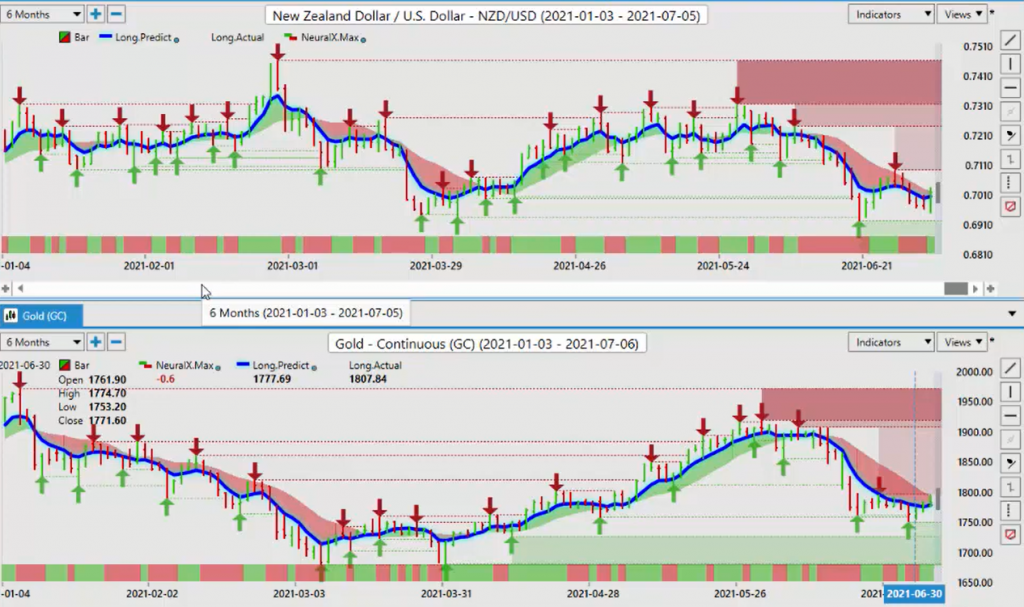
So again, if we’re applying that theory and we look at New Zealand, we see a very similar situation here. These charts mirror. They’re all following gold. So if gold does recover, pushing the dollar down, a number of these different Forex pairs will go with it. But we want that foundation in our trading to understand that going forward, that before we start piling in, bringing all our weapons, so to speak, to the table, our Fibonacci, or waves, our Ganns, or this indicator, the CCI, MACD, stochastics, piling them all in, we need this foundation first to understand that there is a trigger here and it’s going to come from an intermarket. That’s the basis of the software. Now, even with the US Brazilian Real, when we look at that and we compare it to gold, the correlation is not as high there.
Canadian Dollar versus Gold
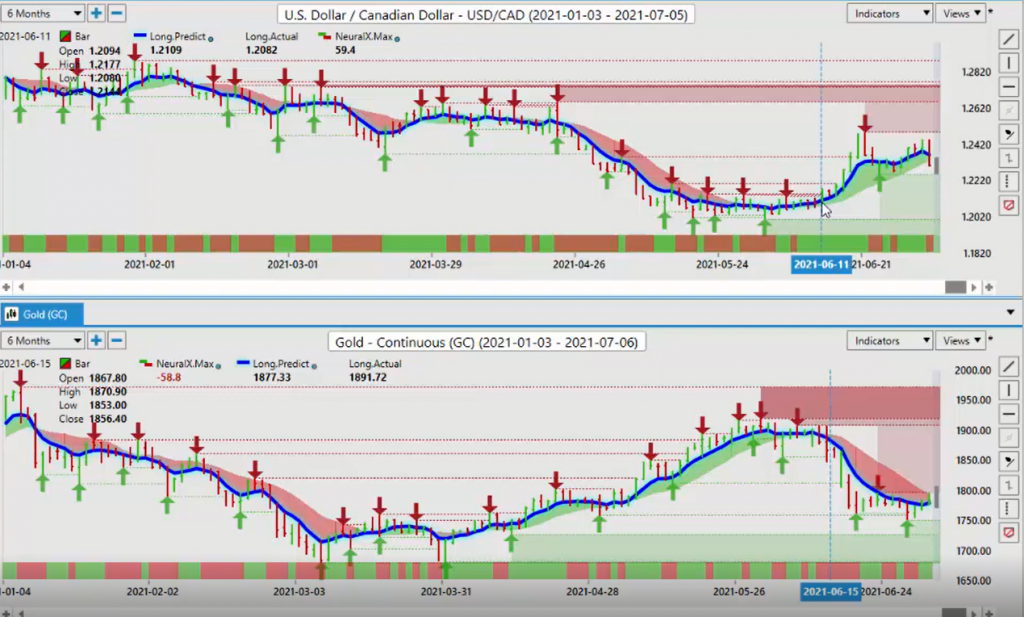
But the US Canadian pair, we can see that whenever gold goes down, then again, the US Canadian pair, we see somewhat of an inverse correlation there.
So in this recent spike lower, that is in gold, that is what pushed the US Canadian pair here, because remember, the Canadian dollar is not the base currency. It’s the currency on the right, not the left. It’s the quote currency, right? So again, understanding that. Dollar Yen, all of a sudden, mysteriously, Dollar Yen started dropping after that very, very strong payroll number. And again, in my respectful opinion, the trigger was money very sneaky and very quietly moving out of US dollars and moving over here into gold. Now, maybe this is just an anomaly and it’s just a one-off, but I highly question that because again, the US Swiss Franc, I saw the same thing happening. If we look at this, there’s a 100% inverse correlation. If gold is going down, US Swiss Franc is going up.
So these intermarkets are things that we want to look at. So once we have that main foundation, going into trading next week can be somewhat, I would argue, a little bit easier if we look at it from that and we put down some of our are many indicators. So from there, we can come back to the main portfolio and we can move through it a little bit quicker because we have that knowledge or that power understanding these intermarket correlations. So if I move into this and I look at the dollar, that was again, shocking a lot of traders on Friday. I’m sure were stopped out after the dollar. Again, a very strong payroll number that should have boosted the dollar. My view is, again, that there is institutional flows that come in at the beginning of the month that people that need to buy US dollars. When that dollar buying dries up, the dollar mysteriously sells off and it’s left to the mercy of the market. And the retail traders appear to love to sell US dollars.
U.S. Dollar Index
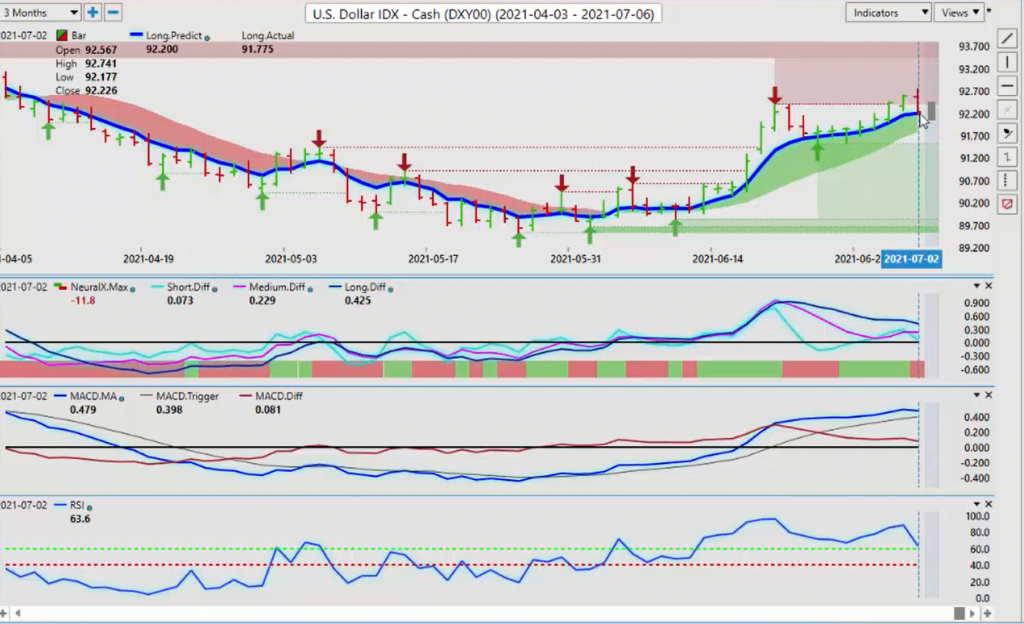
So right now the dollar is holding its ground while above 91 63. But again, if we bring in our F8, the predicted moving average by itself and do that comparative number to gold, then we have a trigger point here, right? We can straddle things. So going into trading next week, 92 20, that’s just that we’ve closed just below that verified resistance high that I’ve been talking so much about the last few weeks are at 92 40, that we need to break above this. Now we did break through that channel and the bottom end of that channel held. That was coming in at about the 91 50 area. That level is held. So there’s the bottom end of our channel and there’s the top end of our channel. We need a sustained break of either 92 40 on the upside or a sustained break of 91 53. That will trigger a broad dollar rally or broad dollar sell-off.
So now you’re armed with, again, knowledge. If you know your levels… this is a key point that I always make… know your levels. The breakout point will come from that. Next week, it’s going to be choppy because of that holiday. But when we know these levels, we can trade them. Our predicted differences are coming down near the zero line. If these predicted differences break that zero line right here… the neural index is already red… there could be a problem. Now we’re losing momentum on the predicted RSI. But if it’s holding above 50 and it’s holding above 40, again, the dollar is not selling off yet. But if we lose the lower end of that channel at 91 51, we are likely to move back towards the 89 80 mark.
S&P 500 Index
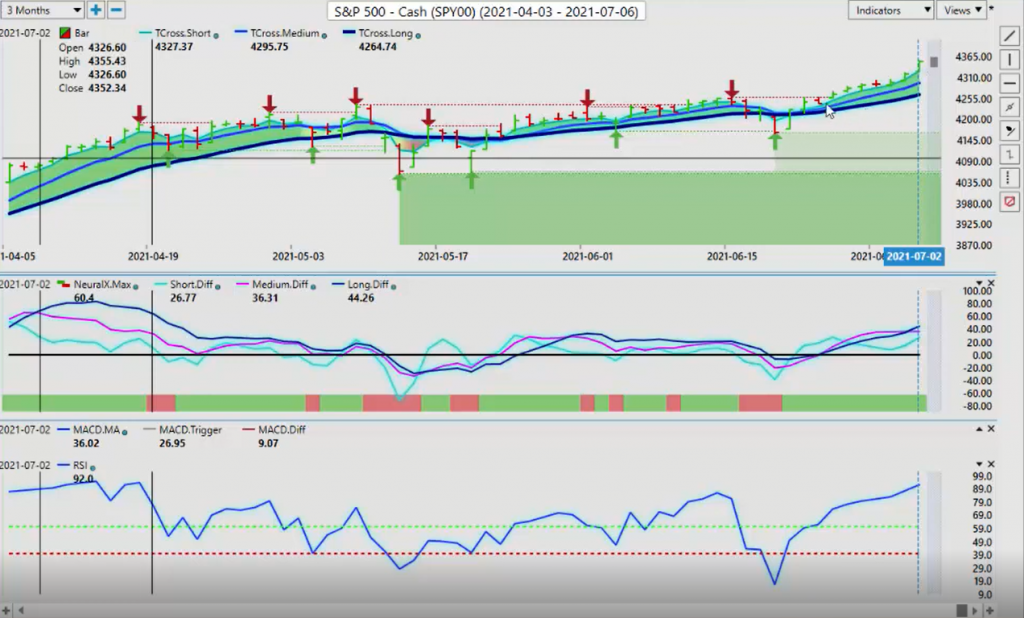
Now, when we look at momentum in the market, one doesn’t have to look much further here than the S&P 500. This is all momentum-based. My view here is again that I like trades or trends that move in a nice, steady step formation. Step up, step down. Step up, step down. I don’t like steep angles in the market because then you have what I’ll call more of an elevator type trade. Elevators go up and down very fast, where that step formation is very gradual. You have your natural pullbacks. Then we go higher than a nice little pullback. Then we go higher. But again, we’re getting a little overextended here. And again, I’m not going to recommend shorts on this because shorts simply haven’t worked with this S&P and this particular or any of the Fed chairs for that matter. They want stocks going higher, and they’re going to keep doing that.
But we do have the medium term crossing the longterm predicted difference. So if we go back to the start of the presentation and we do the comparative analysis between gold and the S&P 500, is that a warning sign that gold is getting ready to move up and stocks are getting ready to move down? The fact that we know this and we’re aware of it will allow us to trade off that. So when we click on our F8, once again, on that F8, we’ve got a pivot area, 43 06. If we lose 43 06, that could be the start of a deeper corrective move on stocks and a higher corrective move on gold above 1,800. So that is what we want to watch.
Now, again, when we know our levels and we know our intermarket correlations, we know that oil is going to fall, ultimately follow the S&P 500.
Crude Oil
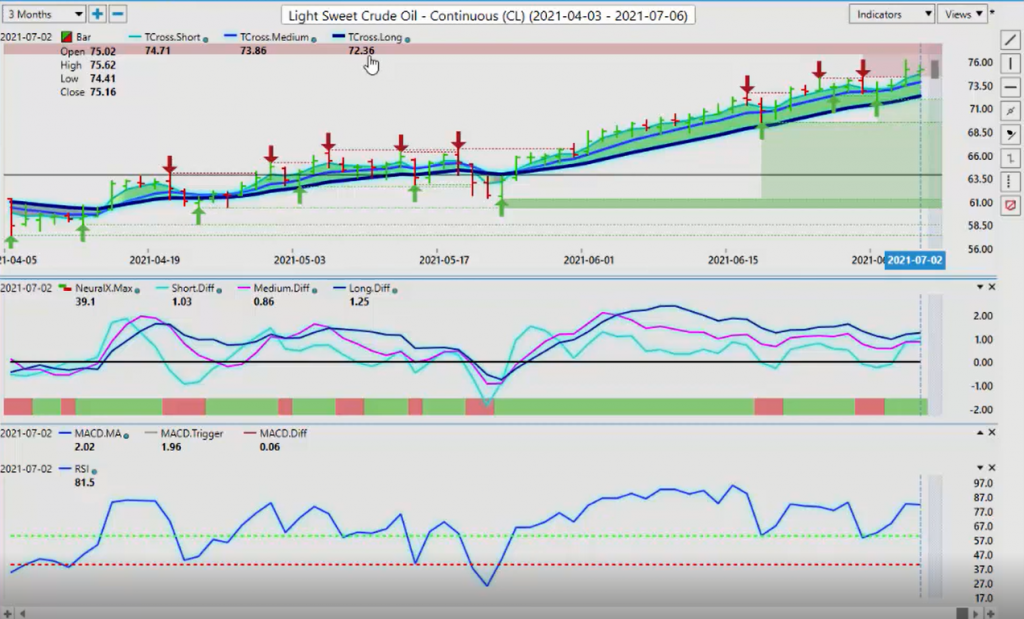
As long as it’s strong, oil is going to be strong. So where we want to watch there, our turnover point is 72 36. If we break down below 72 36, then the S&P 500 is obviously moving lower and oil is following it. So a close trigger point to that, we’ll be using that predicted moving average, 74 10. That’s the level we want to watch. Our main indicators are basically running sideways or flat. They’re not bearish and they’re not bullish. But right now, we’re holding above 74 10 and that T-Cross long. So oil still has that bullish… It’s somewhat bullish, but again, my optimism on extended gains remains heavily guarded.
Gold
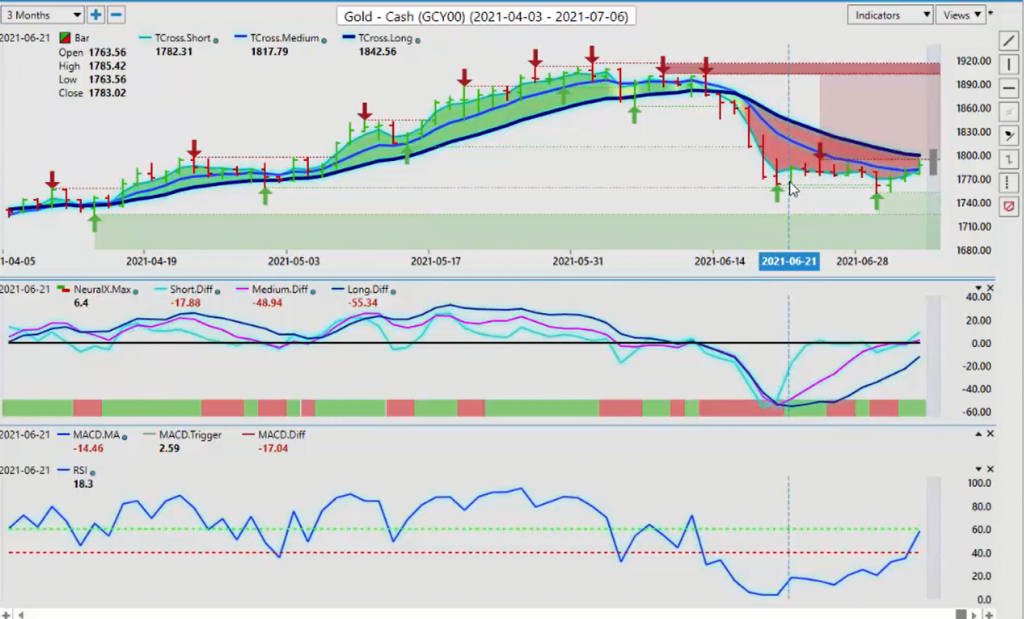
Now with gold, again, very briefly, when we can see the medium term crossing the longterm predicted difference back here on June the 18th, that’s when this trigger came from VantagePoint warning me that okay, if I’m a firm believer that gold is going lower, that’s fine, but it’s telling me not to sell at this point, that we are going to have a corrective move higher, which we did. The question is now, can we get above 1,799 and stay above that level? In my respectful opinion? There are a number of factors that suggest, yes, we can. So I’m going to be watching this level very closely. Remember that the US markets are closed on Monday, guys. Tuesday and Wednesday are going to be very, very volatile.
Plus I believe we have the Fed minutes, so we need to break above 1,799 and stay above it. Right now, the predicted differences, at least the medium term and the short term predicted difference, this blue line and this pink line, they have moved above the zero line, warning us that there’s a bullish signal for me here. We want this darker colored blue line to also overtake that zero line. The RSI is starting. Momentum is building. We’ve cleared 50. If we can clear 60 on the predicted RSI again, guys, I am not interested in overbought and oversold signals, no interest whatsoever. This is a momentum-based market. The S&P 500 is the best example I can give of real momentum trading. They just don’t care. They keep buying that thing. So if gold can get a bit of a bid here, we could see the same thing happening.
Bitcoin
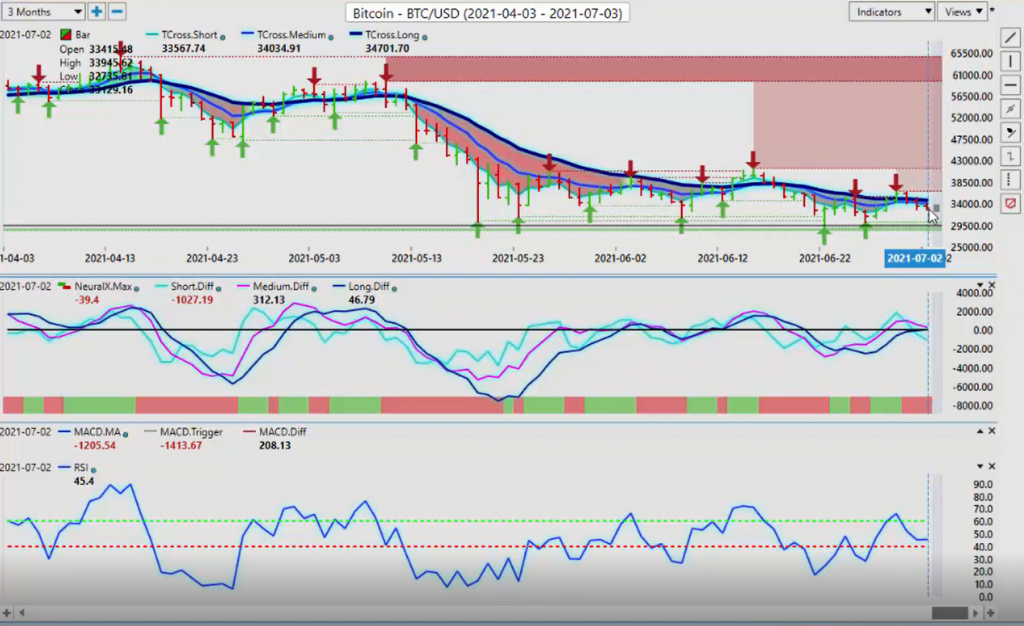
The million-dollar question here now is where is that going to leave Bitcoin? So my view on Bitcoin is that it is a buy on a dip while it’s above 29,000. That’s the yearly opening price. But again, we’re struggling. So during this period… And I’ve seen a high correlation between Bitcoin and believe it or not, the US dollar. I’ve talked about it over the last several months. Two camps, Bitcoin and the US dollar in one camp, Euro and gold and the other. So could this be the trigger that sends Bitcoin lower again? I believe it could be, but we won’t know that, guys, until Wednesday. So be patient with this one. Right now, we need to clear 37,701. So 34,701.
But the first trigger point is going to be that long predicted. And that’s coming in at 33,982. If we can get above that, then Bitcoin will probably have further upside, but I think Bitcoin and the US dollar are going to be a little bit soft during the summer months because that’s usually what they do. Real trading will ramp up again, or high volume trading will ramp up again in September. But again, July is not necessarily… August is a horrible month, but July is not terrible. So I think we’re still going to see a bigger move. But again, watch those predicted difference, the medium term crossing the longterm predicted difference. If that signal completes, the RSI breaks down below 40, then shorting Bitcoin down to the 28,500 mark is a reasonable play.
Euro versus U.S. Dollar
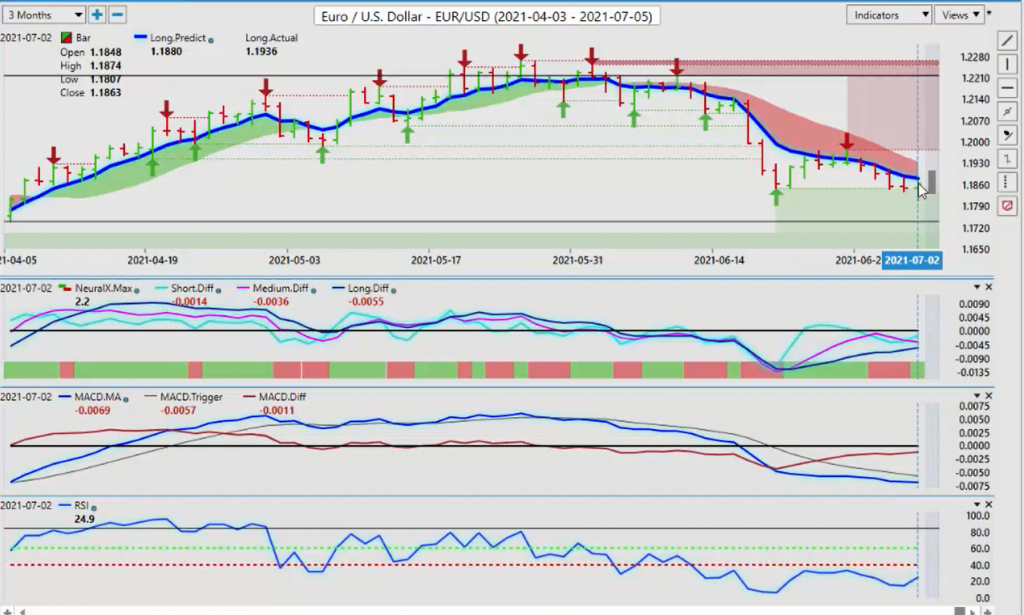
Now, as we look at our main currency pairs, again, the Euro is going to follow gold here. There’s a lot of negatives on the Euro, fundamental negatives with the Euro. I would not disagree with anybody who would state that. But again, we are holding along this level. And be very cautious, guys, of a bear trap down here because gold prices are telling us something else. Those charts are speaking to us saying, “Look,” and most people are not looking at those gold contracts and what happened pre non-farm payroll. The ADP report was good. The actual number was good. And gold moved higher on both. That is a big warning sign that the Euro could be getting ready to correct higher back towards the 1,958 mark. The level you want to watch to begin the week… And I’ve often talked about this, is you can straddle this thing.
If you disagree with everything I just said, all the more power to you, and you want to stay with the primary downtrend, you’re not going to get an argument for me. What I will say is 118 80 is the area where you would look at. But I think that we are going to try and make a move towards that one 120 area next week. It’s highly possible, particularly if gold breaks above that aforementioned level. So if you’re trading the Euro, keep a very, very close eye on those gold contracts. And setting a buy limit order above 118 80, even at about 118 90 is not unreasonable, but it’s also not unreasonable to set a sell order rate at about 118 75. You can put a stop at about 119 50, or have a long ready to go at 119 55. And I think that trade will work also. The predicted differences, we want to keep a very close eye to see if that crosses back to the downside and creates yet another sell signal. That is the signal that I will be watching for.
British Pound versus U.S. Dollar
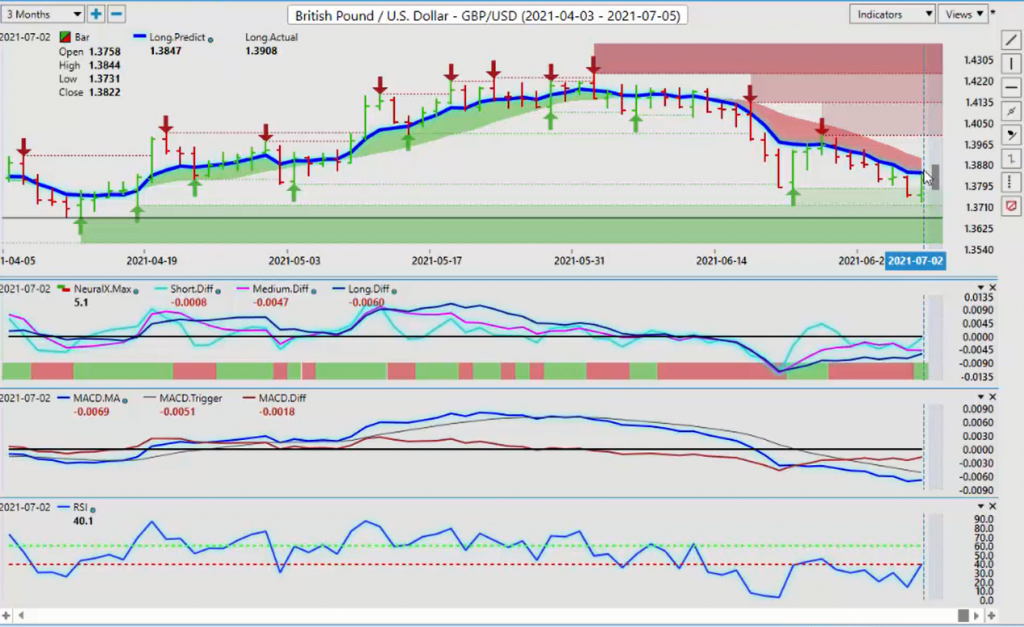
Now, as we look at the Pound Dollar for next week, once again, the Pound needs to get moving here. We’ve got our yearly opening price down both the 136 50 area. I’m not too worried about longs unless we break below that area. I think ultimately the Pound Dollar is going to go higher. We just need to get moving here. We’re starting to recover, and the predicted RSI, our neural index is turning green despite a number of different factors. Now, again, if we click on our F8, we get very close to price here, that pivot area, 138 47. So putting limit orders, just… buy limit orders just above that area is a very reasonable play, guys.
But this is just the thing. We always want to try and get our trades from the medium price, not buy high and sell low if we can avoid it. Sometimes we have to do that. I don’t disagree. But right now we just need to push above that particular level. And if we do, that will confirm dollar weakness.
U.S. Dollar versus Japanese Yen
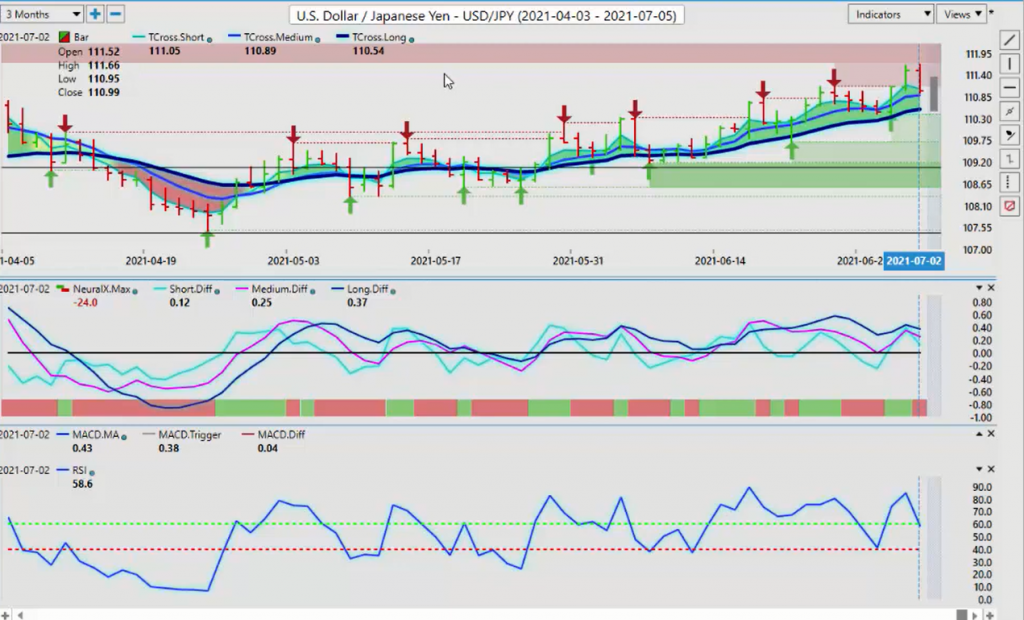
And again, the same thing, same methodology will apply to the Dollar Yen. If we look at the Dollar Yen and we say, “Okay, we’ve already identified that the Yen is highly correlated to gold.” So if gold spikes then so will the Yen, potentially. Again, the domino effect of that could be the S&P 500, it turns around and tanks lower. That would pull Dollar Yen potentially down. So again, still long while above the T-Cross long, 110 54. But a break below that will signal a trend change.
So if you believe that will happen, or if we see that happening with rising gold prices, then we put our limit order just below, again, 110 54. You can put it at 110 49 for that matter, or… big or coming… you can put it right below that level and get the trade a little quicker. So we’re closing the week on the long predicted. We need to hold above that level, guys, if this is going to continue to advance. But if we slip below 111, chances are we’re going to run down into the lower 110 area very, very quickly. The indicators from VantagePoint are confirming that to some degree. But again, everything seems to be distorted because of COVID, because of the Fed, because of the non-farm payroll number, the revisions. Just a lot of distortion in the market. So be careful.
But if you know your levels, then again, you can respond to that. You can trade this, right? So in a perfect world, we would like to see the Dollar Yen go up to about 111 35 and then think about shorting it at that level on, then have a secondary order just down below the 111 area. So again, there’s a lot of different ways to skin a cat here, guys, but using these predicted moving averages and straddling the areas can be very, very profitable once you know the core foundation. What I started this presentation with was understanding those correlations to gold and how it alone, without any indicators at all, will affect this particular pair.
U.S. Dollar versus Canadian Dollar
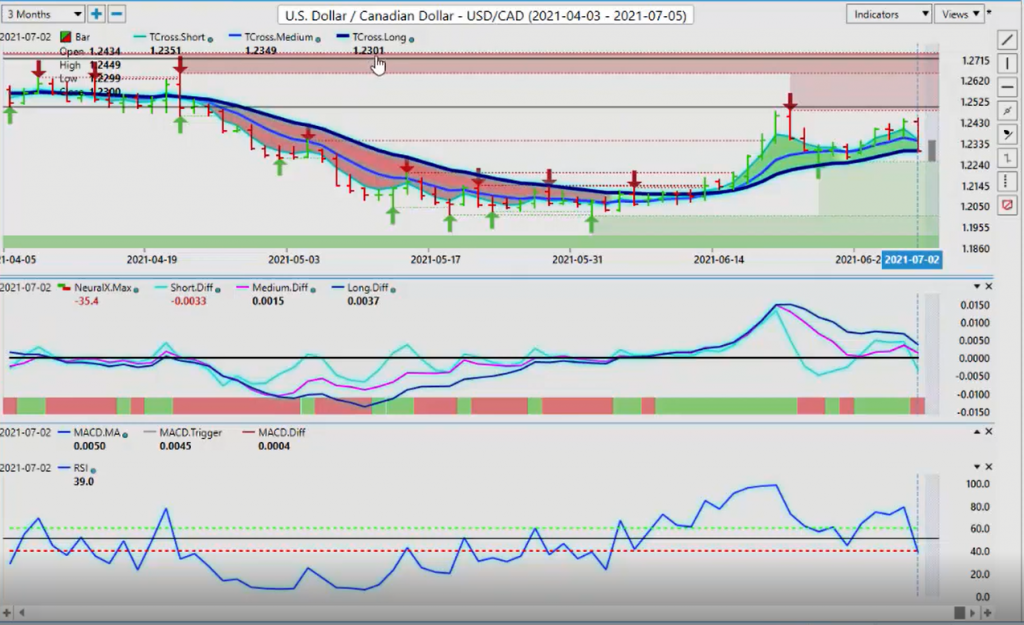
Now with the US Canadian, it’s going to need stocks going higher guys, and it’s going to need oil going higher if it’s going to break down below this T-Cross long. We’ve closed the week at 123, right on the T-Cross long. This is the difference between bullish and bearish on this particular pair. We’re below the yearly opening price. But if it is any upside potential at all, then stocks have to sell off and oil’s got to move a little bit lower. That is what will send this pair higher. And we would like to see these verified support zones down sitting at this lower 122 52. So you could try longs down to that particular level, but watch equities, the S&P, and oil very, very closely. Right now, we have not broken down below the zero line on the predicted differences, but momentum to the downside here is starting to build. We’re at 39 in the predicted RSI. That is a momentum trigger point, guys, suggesting that it’s getting ready to move even lower. But it’s got to break through 123.
Australian Dollar versus U.S. Dollar
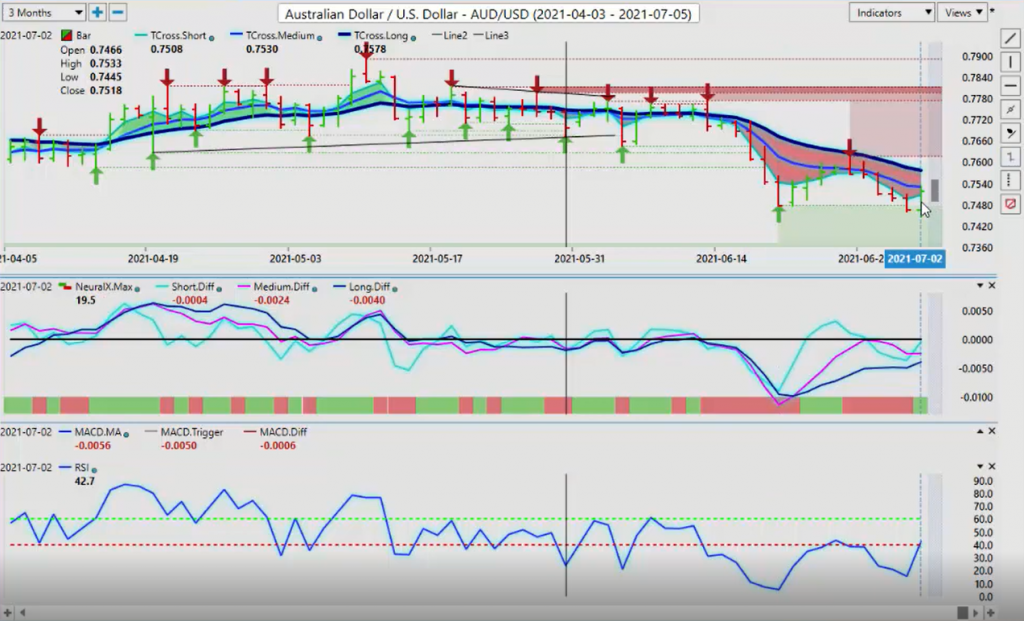
Aussie US and New Zealand US, again, they’re a combination between a gold trade and an S&P 500 trade. These are the correlations. We’re holding support on the Aussie, but the Aussie is the weaker of the two. Between the Aussie and the Kiwi, I like the New Zealand better. It’s been much stronger, a little more predictable. The Aussie has been very, very choppy with golden stocks, but right now we’re holding this level. So again, the upper limit on that is 75 78. If we click on our F8 in the VantagePoint software, we’re sitting right on that long predicted, 75 19. We have closed by the spread only. One could argue that there’s a long right off the bat here on Sunday night, but the US markets are closed. So again, give it some time for the markets to come in. I recommend with my own trading group that, okay, we don’t do any trades until Tuesday at 9:00 AM Eastern. That’s the very minimal time we have to let all markets come back in here, guys.
And remember, the cat’s away, meaning the US markets. So the mice are going to play on Monday. We don’t want to get caught up in that. So if we can hold above 75 19, I think we have a real shot of extending higher, and the same thing would apply to the Kiwi.
New Zealand Dollar versus U.S. Dollar
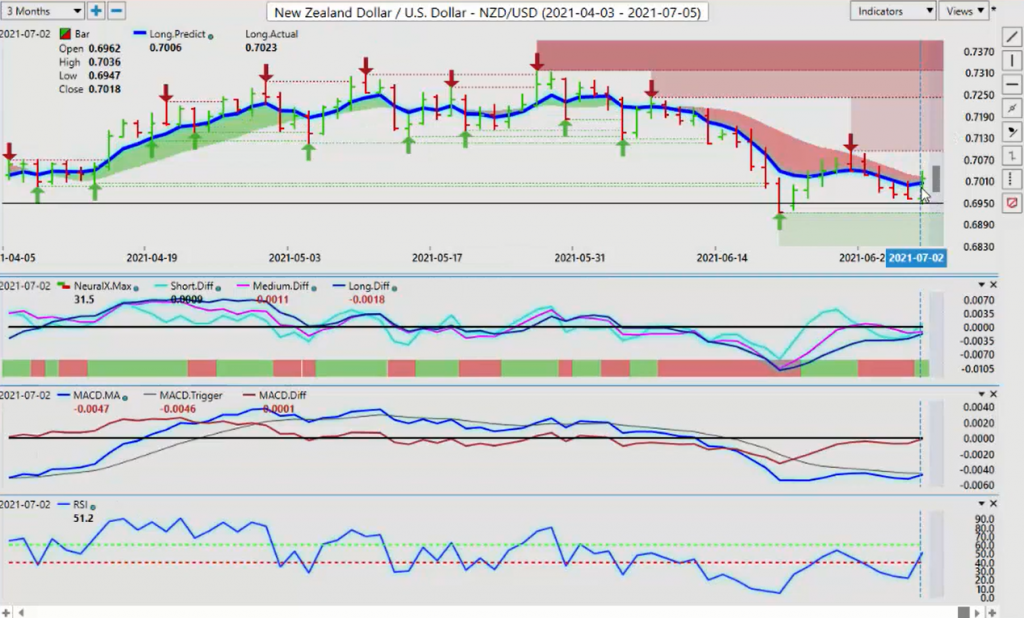
And again, the New Zealand US, you can see the New Zealand is stronger. We’re already up to the T-Cross long at 70 51. We’re closing at 70 18. Once again, our predicted differences are trying to get above the zero line. We’ve got a rising RSI at 51.2. That’s good, but we need the predicted RSI breaking 60.
One of the ways we will see that is if we can clear this level, which again, to illustrate my point, the New Zealand has been stronger than the Aussie. We did clear the long predicted, and we cleared it a little bit better, the long predicted at 70 06 or 70 18. So that’s not just by the spread. There’s a play there. So once again, if we can hold above that level, then again, once it points towards gold strength and dollar weakness, we are going to have a very choppy start to the week. So just be very, very cautious.
So with that said, this is the Vantagepoint AI Market Outlook for the week of July the 5th, 2021.