Welcome to the Artificial Intelligence Outlook for Forex trading.
VIDEO TRANSCRIPT
Hello, everyone, and welcome back. My name is Greg Firman, and this is the VantagePoint AI Market Outlook for the week of July, the 26, 2021. Now, to get started this week, we’re going to begin with a more advanced learning on inner market correlations and how to actually apply these inner markets in real time trading. Now, in this particular week session, we’re going to focus more on Bitcoin. Now, when we look at the top markets so far, over the last 10 years, we can see that the annualized returns on Bitcoin on a 10 year, and this is up until about March of this year.
Bitcoin versus Gold Intermarket Analysis
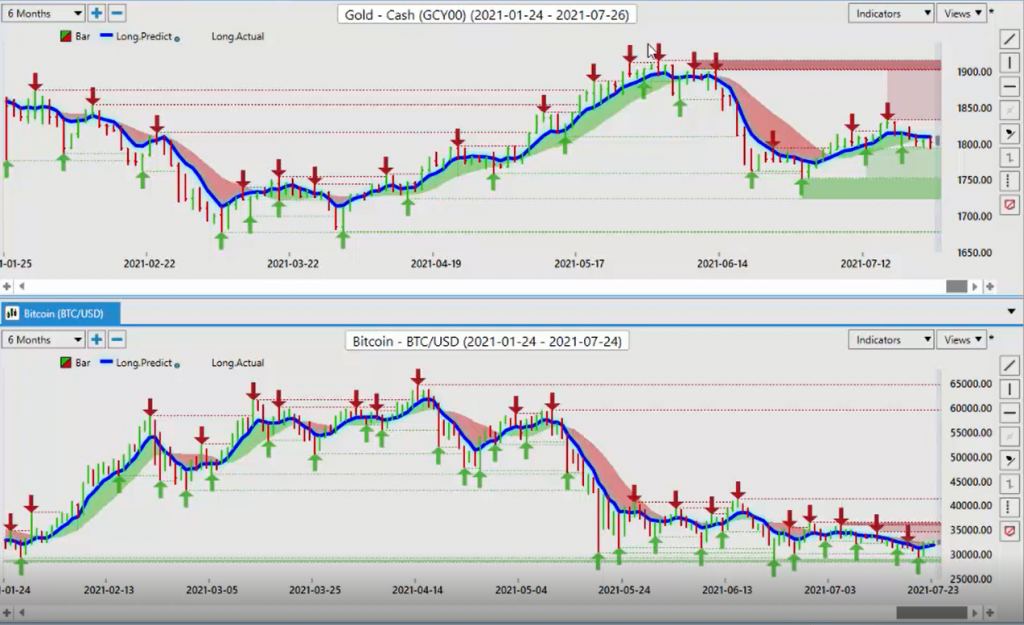
You’ve got a 10-year annualized return of 230%. This puts Bitcoin at the top of the all markets. That’s followed then by the NASDAQ, then we’ve got large caps, small caps stocks. But again, when we look at Bitcoin, we start to understand that Bitcoin is real. It’s a major player. Any market that is correlated to Bitcoin or inversely correlated to Bitcoin is of interest to us. Again, we’ve looked at oil correlations, dollar correlations, equity correlations, and how they affect currencies. But what about Bitcoin? When we look at Bitcoin in this previous week’s trading, we can see that gold is struggling here.
Now, gold has recovered somewhat. But in my respectful opinion, as Bitcoin recovers, that’s what’s pinning gold, not allowing it to move higher. Where Bitcoin goes from here, that is something we will have to assess. But the one thing we have to understand is that there is a strong inverse correlation between Bitcoin and gold. Now, when Bitcoin goes up, we can see that gold immediately goes down. As gold started advancing here, I would argue that this began on March the 31st, that that led to a significant decline in Bitcoin futures contracts. This is an indisputable inner market correlation that I think some of the market participants are either not aware of or they’re not wanting to get involved with Bitcoin because they heard it’s this, they heard it’s that.
None of that is really true here, guys. Bitcoin I believe is here to stay. When we look at this inner market correlation, this would suggest that if gold cannot advance, then it will be Bitcoin that advances. Now, over the last … After tracking Bitcoin for the last several years, I’ve noticed a very strong positive correlation between the US dollar index and Bitcoin. I’ve talked about it frequently on here and in the VantagePoint Live Training Room. Now, more recently as the fed gets a little bit more hawkish, or some of the data starts to turn around, things improve with COVID to some degree, the dollar starts to advance here, but Bitcoin is not advancing. It’s moving sideways along very heavy support along that yearly opening price of approximately 28,900.
U.S. Dollar versus Bitcoin Intermarket Analysis
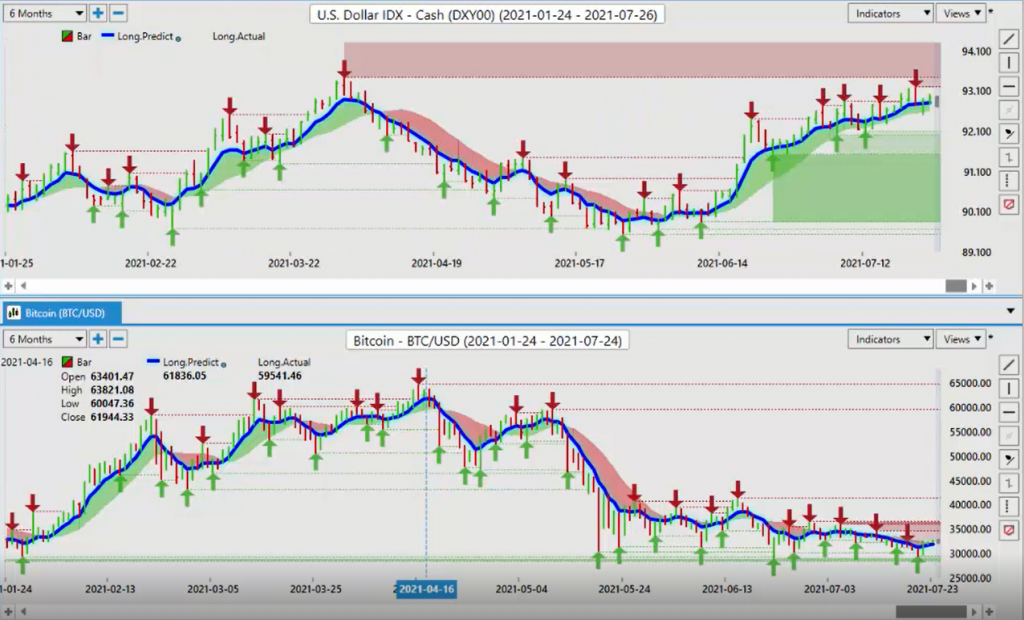
But the key thing that we want to watch is that the dollar has advanced and Bitcoin didn’t. If we look at this just over a six-month period, we can clearly assess that as Bitcoin went higher, so did the dollar index. When the dollar index went lower, Bitcoin went lower. That brings the Euro into play for these inner market correlations also. I’ve often discussed that, at least over the last six to 12 months, I’ve put these in two camps. The dollar and Bitcoin into one camp, the Euro and Bitcoin … or the Euro and gold, excuse me, into another camp. What I mean by that is essential that as the Bitcoin was rising in value, the Euro was dropping in value and vice versa.
Euro versus Bitcoin Intermarket Analysis

This most recent rise in the Euro down off this lower 117 level, you can see that Bitcoin immediately had a negative reaction to that Euro strength. Again, we want to watch that if we look at the NASDAQ. The NASDAQ and Bitcoin were actually moving pretty much in tandem with one another, and then something changed here and the NASDAQ advanced and Bitcoin did not. I firmly believe this is interference from China. You’ve got government’s talk trying to talk Bitcoin down. You’ve got Elon Musk making stuff up about saying that it’s not green enough forum, when none of that. What he originally said was actually factual green energy.
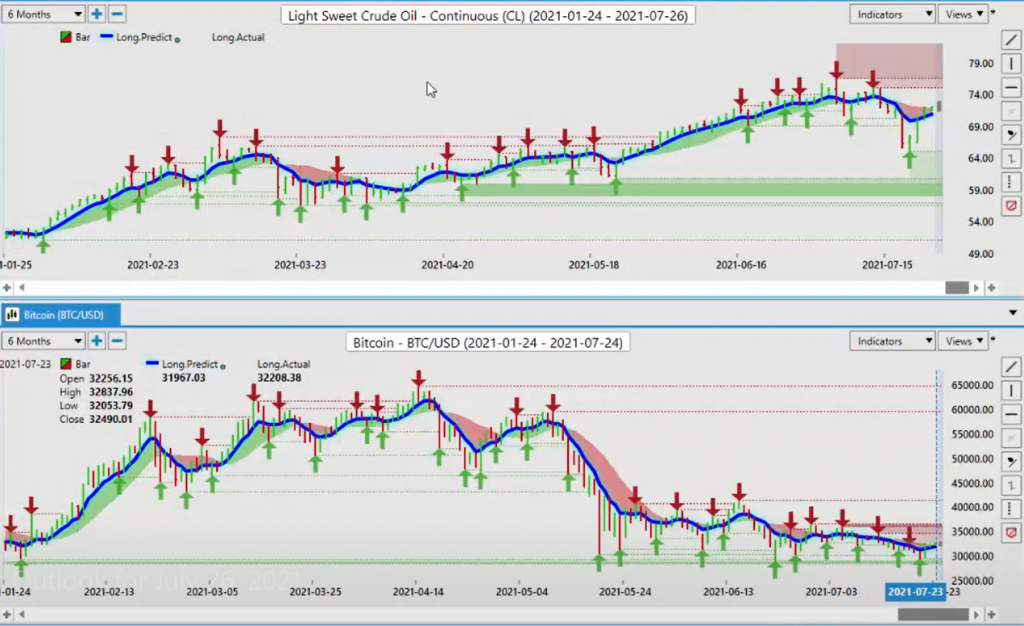
Bitcoin is 60% green now. That’s not true. Since then, he’s flip-flopped on that too. You’ve got a lot of people trying to interfere with the price of Bitcoin, and they haven’t been successful. Nothing goes straight up and nothing goes straight down, but we want to monitor these things. Now, when we look at the S&P 500, again, heavily manipulated by the fed, by the governments. They just keep pushing this thing higher. What about light sweet crude oil, like a commodity. We can see again, Bitcoin and oil, there’s a bit of a correlation here. But if we break this down more specifically and we look under the hood, we can understand things much different.

We can see things differently than most. The yearly correlation, the positive yearly correlations to Bitcoin, American Vanguard Corporation, 96% 0.81 correlated. We’ve got the BLOK stock, 96.99% positively correlated. Tripadvisor, Inc., you’ve got Loblaws company. You’ve got a number of different stocks here. Then you have inverse correlations. [inaudible 00:05:45] three to seven year treasury bonds, 88% inversely correlated. Meaning that if Bitcoin is going up, this is going down. Schwab, intermediate-term US treasury. The treasuries and bonds are being negatively affected by any positive move in Bitcoin. This answers multiple questions about inner market correlations.
But inverse correlations are just as important, because if the main market that we’re doing the analysis on, if it’s going higher, then this block of green will be going up, and this block of red will be going down. The next move on Bitcoin, if it is to the downside, then these lower 10 stock shares US treasury notes, they will, in theory, be going higher. These are the types of things we want to look at. Extremely important. If we look at Bitcoin under the hood of the AI system to see what exactly those inner market correlations are, these are critical in our trading. The one advantage, as I’ve stated many times, that inner market correlations have zero lag. They’re remediate.
As one goes up, the other one goes down. Or Bitcoin goes up, the positively correlated markets go up with it and the inversely go down. A brief look under the hood, inside the neural networks, to show us what those markets actually are. Now, this is a more advanced part of the VantagePoint software, but it’s extremely effective. We can also isolate this down to a month. If we look on the monthly and the quarterly, you can see that Monero moves to the top of the Bitcoin list on the monthly and the quarterly, but on the yearly, it’s not even listed. That is the kind of thing that we want to look for. We can actually add more inner markets by actually doing this.
That’s the key thing that we want to understand, is we’re looking for not … Right now we have 31 markets piled in here. I’ve taken the top 10 positively correlated and the top 10 inversely correlated. Again, this is being recorded. You can study this and say, “Oh, okay, next week, if Bitcoin makes a push-up,” and you’re a stock trader, or let’s say you’re a forex trader, Aussie/Swiss franc has a 95.72% positive correlation to Bitcoin versus the US dollar. That could be a very good pair to buy. If you’re a stock trader, maybe Interactive Brokers Group is a stock you want to look at, maybe PGT, Tripadvisor. You can also, again, like I had discussed in last week’s presentation, you can also do some options trading around this.
But there’s many different ways that these types of inner market correlations can be applied in our trading. It’s to some degree a form of naked trading. Now, when we understand that Bitcoin is still a major player in these markets, and again, I’ll bring this up again just so you can quickly see it, but this tells the tale of the tape for me. Yes, of course, Bitcoin is volatile like any new market. But again, over a 10-year period, a 230% annualized return is not something we want to actually take lightly here. Again, if it makes a big push, we could really see something happen. Once we’ve done that, we’ve had a look at these inner market correlations and we have, again, a foundation in our trading that the first thing we want to go to is inner market correlations, then we want to bring in the additional predictive indicators.
If I’m looking at Bitcoin right now, we are challenging that T-cross long at 32,510. You’ve often heard me talk about that there’s two yearly opening prices on Bitcoin. The Coinbase one is the one we want to keep an eye on. Not the futures side. The Coinbase is approximately 28,900. You want to watch that level very closely. We’ve had repeated tests down at that level, and it’s been an excellent buying opportunity, despite what the indicators tell us. The indicators, again, they try and calculate future prediction of price, but inner market correlations have zero lag. They’re immediate. We’re not required to count ABCs or waves or any of this stuff. We don’t need to do that, because again there is no lag.
If a certain market moves, this one will follow. Right now Bitcoin is actually trying to turn bullish here. We’ve got our predicted differences that have crossed to the upside, but they’re now challenging this zero line. This zero line represents the difference between bullish and bearish. But again, we still remain in a lengthy channel here, the top end of that channel about 41,300 and the bottom end of that channel is right around the Coinbase yearly opening price. As long as that holds, then Bitcoin remains positive or bullish on the overall year. Now, when we do a comparative analysis to this, as I’ve stated in the past, there has been a very, very high, positive correlation between the dollar index and Bitcoin.
If what I will be looking for in the not too distant future is for this correlation to break down, I believe it may be in that process right now. If the dollar fails at this resistance level that I’ve discussed all these many months up here at 9345 and Bitcoin continues to advance, we’re looking for that correlation to break down. I would personally like to see Bitcoin attach itself, and I believe there’s a strong possibility that it can correlate itself to gold. That both gold and Bitcoin will be what the market wants to buy versus the individual currencies as they continue to depreciate with the actions of these central banks.
U.S. Dollar Index versus Bitcoin

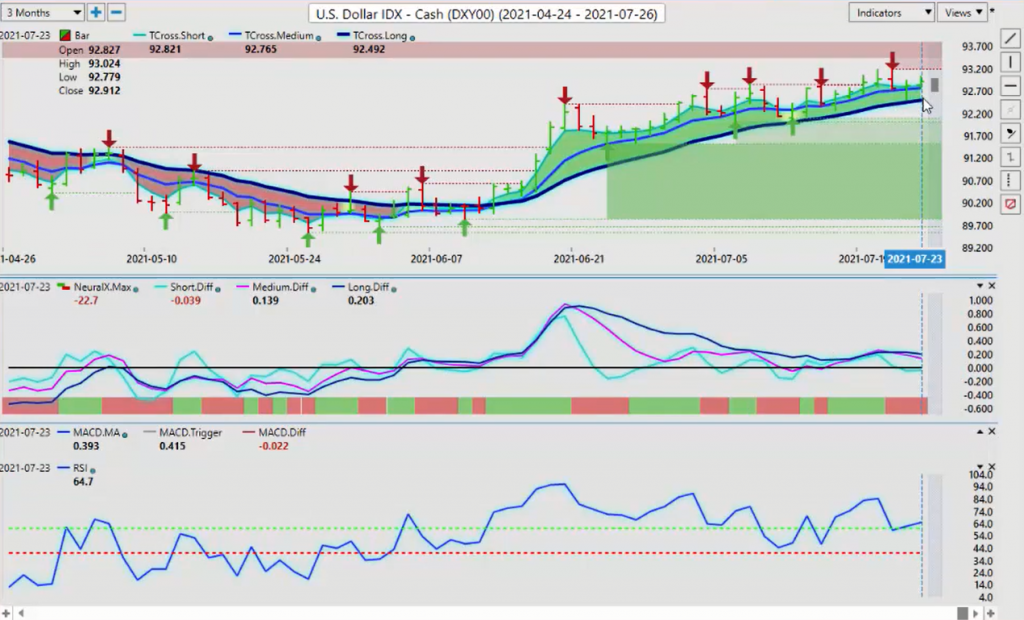
Right now we need this to get moving. The dollar index is either going to break out to the upside. We’ve got the fed coming up this week. The fed is yet to do anything to help the US dollar. In my respectful opinion, it’s a classic case, again, of buy the rumor, sell the fact. They are buying dollars up until the fed, and then probably Thursday of this week, they just start unloading them again. That is what we want to watch for. We have cleared or we’re trying to clear a significant hurdle at 9280, but we’re just not getting high enough. There isn’t enough momentum up here for this thing to keep going. We currently now have the medium-term crossing the longterm predicted difference with the neural index.
This is a classic dollar sell signal. The definition of that would be to buy Euro/US, buy Great Britain/US, sell US/Canada, sell US/Japan, sell US/Swiss franc. Remember guys, the primary basis of foreign exchange or currency trading is buying or selling US dollars. We are getting an early warning sign ahead of next week’s trading that the dollar is likely going to come under some kind of pressure, and the move that it’s made to this point is not likely sustainable. We will be watching these key levels. The fed could absolutely say something that would boost the dollar. But my optimism on that, respecting their current track record remains heavily, heavily guarded.
Now, what is that going to do with gold? Going into next week, we understand that … Again, my view is that gold is struggling here because Bitcoin is recovering again. In a perfect world, I would love to see gold and Bitcoin correlate 100% to each other, at least 85% to each other. Currently that is not the case. Gold is struggling at this T-cross long. We need to break free and clear of this 1,800 level, whether it be on the upside or the downside. Right now, the indicators are very neutral here. The long predicted difference is above the zero line, the medium is below. Neural index remains firm, but that reverse check mark off the 40 level on the predicted RSI suggests that there is still some kind of upward momentum.
The predicted RSI 53.3. We’re basically dead flat on this. I’m not expecting a big move to the upside on gold if the fed is coming up next week and they’re talking interest rates because a lot of market participants believe that the fed has got this dead wrong with this ultra easy policy. But the fed is holding its ground saying, “Okay, no, this is transitory. We’re not reacting to it.” It will be, again, a very interesting meeting, but I’m putting any … I don’t trust this particular fed to change any of its policies until next year. Again, that’s still breathes life into gold, and that’s what we have to remember.
NASDAQ versus Bitcoin Intermarket Analysis
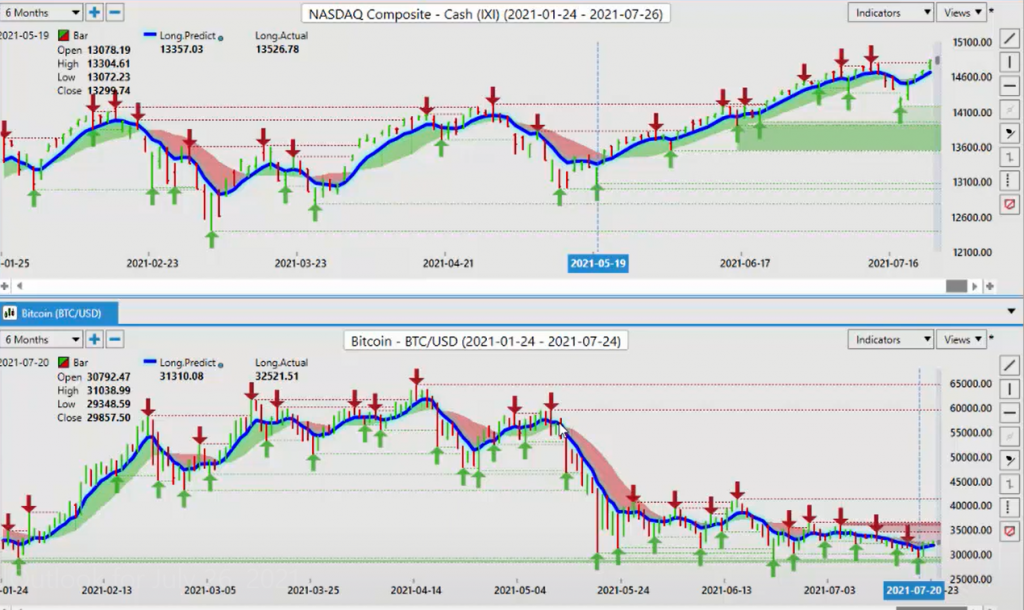
Now, if we look at that and we again do that comparative analysis to the equity markets, the S&P 500 relentless in its move up here yet again. I do like the cash price. I’m just going to switch over to that, if you guys don’t mind and bear with me here. The S&P 500, once again, unbelievable. This is just a relentless move up. Now, what I will say here, and I did say in the VantagePoint Live Training Room on Monday morning that this price is ridiculous because of OPEC, equities crashed, oil crashed. But at that time, I had stated very clearly that this … You always be careful in Monday trading. I tell my own direct clients that, “Look, no trading until 9:00, 9:15 AM Monday morning. Let all markets come back in. My friends, it will save you a lot of headaches. Just watch the fireworks, wait for it to die out and then jump in after the fact.”
Because again, these wild moves are just that, they’re wild. We’ve got the previous high here at 9393. We opened the week with a disastrous move only for a complete and utter reversal back to the upside. The market, in my respectful opinion, is not going to let oil prices go very low. They’re just flushing out stops here at full recovery, and as I had stated when I had showed everybody over the last couple of weeks, why these inner market correlations are so important, because again equities or oil, whichever side you want to take, they’re leading indicators for each other. Right? Once oil stalled right here, started to turn around, the equity markets followed. We had our medium-term crossing our longterm predicted difference.
That is a classic buy signal, contrarian buy signal in the VantagePoint software. It is particularly powerful when it happens with the neural index after a series of red bars. Now, little bit of a concern I have here is that the predicted RSI is at 60.7. I would like to see it continue to advance here. I do not use oscillators for overbought, oversold cumulation distribution. I don’t go down those roads. I’m looking to trade momentum here, guys. This is a momentum-based market. All of them, oil, gold, the dollar, the currencies, individual stocks, they’re all based on momentum, algorithmic programs. What we want to do is make sure that we’re using these pivot levels and these trending indicators and contrarian indicators.
Crude Oil versus Bitcoin Intermarket Analysis
Now, this one here, to end the week, oil has closed above 7137. It’s closed at 7207, a complete recovery from this nonsense on Monday. Don’t you find it funny that OPEC tends to make these announcements when the markets are closed or just after the markets open on Sunday night, and the volatility goes through the roof for 24 to 48 hours, only for it to completely and utterly reverse? Oil and equities remain on firm ground. The fed could shake that up a little bit, but right now, if we’re holding above 7137, everything looks pretty good here. Same with the S&P 500. Now, again, with these markets correlating to one another, we just want to make sure that we still use these VP levels. Again, we want to see gold advancing past 1808, staying above that particular level.
The stocks, yes, they are very lofty up at this level, but they appear to have plenty of room to move. I believe that if Bitcoin starts moving up, that will be another indicator that some of these commodities are likely to follow. Now, as we look at the Euro/US, the ECB ultra dovish this past week, but the Euro is still holding its ground. The medium-term and the longterm predicted difference are still below the zero line. But the pink line is above the black line. That is saying that this thing is not done yet. We have very, very heavy support on the Euro at the 117 level. Watch that very closely. Our T-cross long, 118, 30.
If we click on the F8 in our VantagePoint software, this key pivot level 11784. I would recommend that another way to play this that I’ve often talked about is straddling this blue line or putting limit orders above it or below it. Let’s say, for example, that you disagree with everything that I have said to this point. That is your right and I respect that. What you would do is you would put a limit order to sell just below 11784. When the market goes up to that level, hits it, it will trigger that short. However, I believe that the better play is to have a buy limit order just above that blue line, and as it breaks above that VantagePoint T-cross long … Or, excuse me, that long predicted at 11784, you’re sitting there waiting for it, right?
This has been a very effective strategy. Yes, the Euro is bearish, but a lot of times when these central bankers get ultra dovish like that, the market doesn’t like it, and they often take it the other way. Be cautious because I believe there could be a strong buy on the Euro/US pair, but that’s going to be dictated by the dollar index, Bitcoin and gold contracts, as I just showed you guys. Those inner market correlations, again, have absolutely zero lag. They’re absolutely leading indicators for any given market we’re trading, as long as you know what they are. Watch that level very closely. Now, if gold and the dollar sinks than US/Swiss franc, we may see some pretty decent selling opportunity on this one too.
But again, I believe whenever we get involved with the fed, it’s a buy the rumor, sell the fact. The market wants to believe that the fed is going to be ultra hawkish on the economy, on the currency, on the upcoming economic data, but I don’t believe he’s going to be. I believe he is going to kill the dollar again, because that’s what this guy does. Again, t’s very subjective what I’m saying, but it’s going to be subjective until we get past it. Could go either way. Right now we’ve got very stiff resistance at the 9232, and even heavier resistance up to 9274. Remember, cross-reference the inner market correlation to the dollar index.
U.S. Dollar Index
The dollar index still below 9343, guys. As long as it is, the US/Swiss franc is pinned and it still opens the door for further gains in gold. If gold contracts go up, this pair will go down. Another way of playing this is that if you believe that this is going lower, gold’s going higher, dollar index is coming down, you would put your limit orders, just sell limit orders just below 9177 and straddle that T-cross long. We’ve closed at 9193. Again, another potential opportunity to get short on any kind of rally or just play the … Again, you also have that opportunity of playing the breakdown below that particular area. Now, with the Great Britain/US again, last week, absolutely craziness that took place.
British Pound versus U.S. Dollar
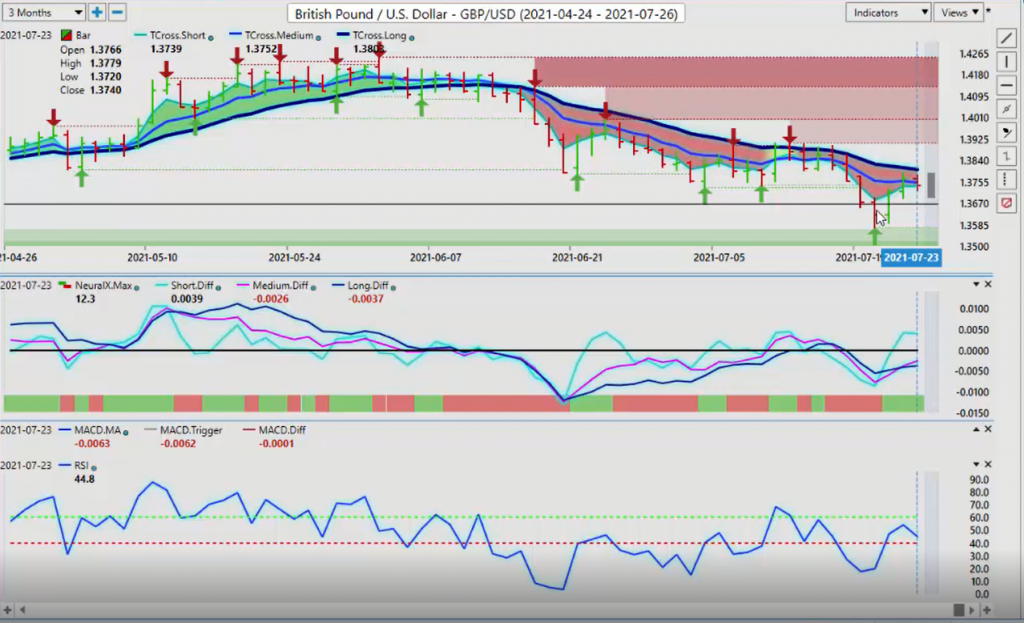
What I had talked about in last week’s presentation, showing you those inner market correlations with oil, that the British pound and the Canadian dollar are two currencies that have an unusually high correlation to light sweet crude oil or Brent or any of them. But what happened is that the US/Canada, which I’ll talk about it in a minute, it briefly broke above its yearly opening price at 12717, and that sent Great Britain/US down below its yearly opening price at 13650. The US/Canadian pair recovered very quickly on Tuesday with oil prices and the equity markets moving back up. Great Britain/US was a little slower, but an excellent buying opportunity. Right now, we’ve got our medium-term crossing our longterm predicted difference with our neural index.
However, we have a reverse check mark on the predicted RSI telling us that we don’t have a lot of upward momentum. We are also holding below that T-cross long at 13808. We need to break above that. But again, when we look at the key level using that blue line by itself, we can see 13746. Another great trading strategy guys is regardless of what you think or what I’ve said to this point, and you have your own opinion, good for you. I’m all for that. If you believe that this is going lower, then you would basically sell it right off the open because we’re right on this, we’ve closed rate on this blue line, and you wouldn’t necessarily be wrong. Okay?
However, if we believe that this medium-term crossing the longterm predicted difference with the neural index is a leading indicator that it’s telling us what’s about to happen, if this pair crashes on Monday and goes down by say 50, 80, 100 pips, the probability that it does a Tuesday reversal and goes screaming back higher like it did this previous week, like it does on many weeks, then you would have a buy limit orders sitting down here ready to go. This is where the VantagePoint predicted high and predicted low come into play. What I mean by that specifically, that predicted low is 13694. I believe that that’s a very good buying opportunity down there based around these particular indicators.
But again, this is how we put things together. In the VantagePoint software, there’s many different strategies, many different tools that can be used. It’s the foundation, the groundwork is what we need. Again, I believe that oil and equities are going to continue to advance, and if that’s the case, this pair will go higher, not lower. The same exact same thing will apply to US/Canada case in point. The yearly opening price, we got above it and closed above it for one day on Monday because of OPEC. The very next day on Tuesday, we slipped below the yearly opening price, then we fire at will on shorts, because again, something interfered with the market. Whenever OPEC interferes with the market, the fed interferes with the markets, central banks, governments, often it goes the other way.
U.S. Dollar versus Canadian Dollar
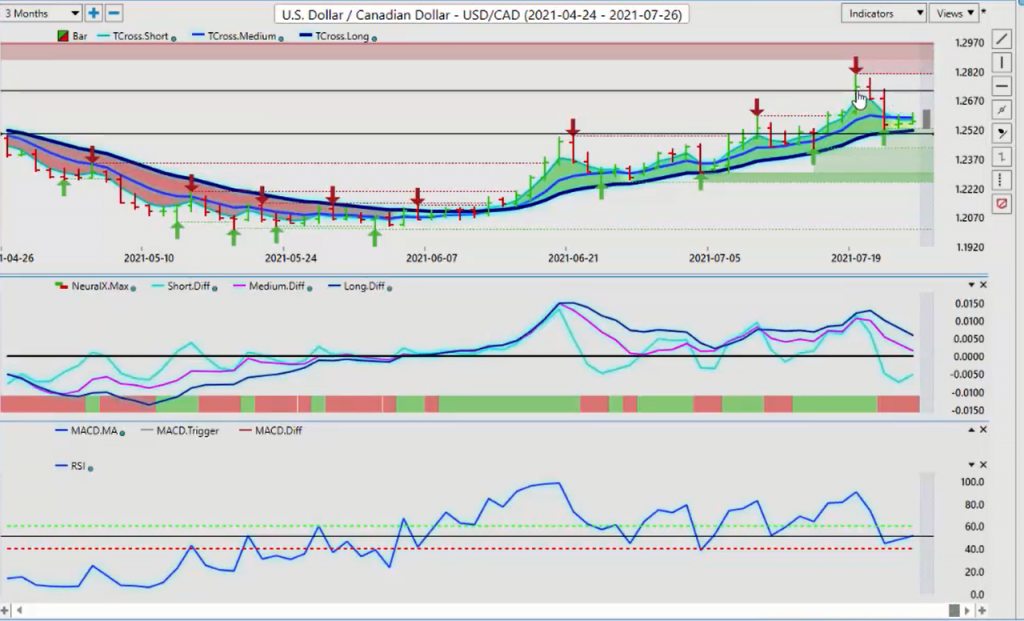
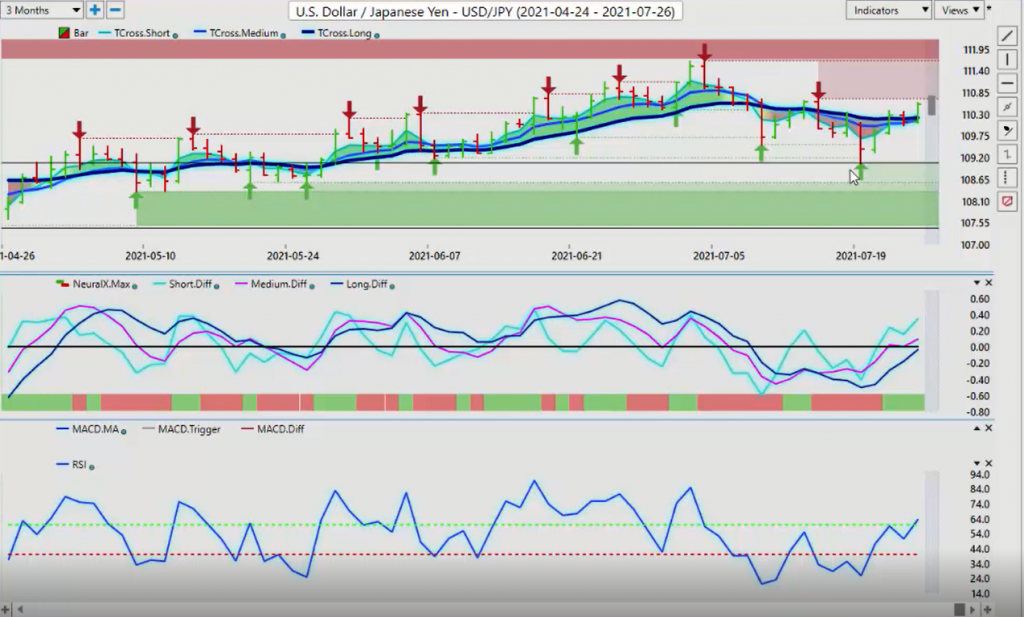
But again, with the US/Canadian pair, the one we’ve got to watch now is 12519. We want to break down below that. If we click on our F8, you can see that we’ve taken a big move down on Wednesday. Then on Thursday and Friday, we’ve come right back up to that blue line, that predicted moving average, and sold right into that blue line. The neural index fully supported the shorts on this particular move. However, we need to understand that we’ve got to get below 12519. Very, very important. Now, with the dollar/yen for next week again, this is a gold trade, guys. If gold can recover and start moving back up, you could have a very good selling opportunity here on Monday too.
That verified zone is intersecting with the VantagePoint predicted high at 11075. I believe it’s reasonable to short there, but I also believe that the stop loss should be above the 11166. If you were to do that, you would lower your position size and just wait out the fed. But this is a prime sell area. The only thing is we do have some upward momentum building with the predicted differences, and of course the predicted RSI is concerning because it’s penetrated through that 60 level. Keep an eye on this one, but again, gold and the dollar/yen. Gold goes up, dollar/yen goes lower. Gold goes down, dollar/yen goes higher. That is the one you want to watch 100%, okay?
Australian Dollar versus U.S. Dollar
Now, with the Aussie/US and New Zealand/US, basically the same trade here, but they are starting to recover. But there’s that reverse check mark yet again that’s warning us that there isn’t a lot of momentum here. The Aussie and the Kiwi and the CAD and sterling all need equities, and for the most part, oil going up. But you can see that when oil recovered here, that also affected the Aussie. It too started to move higher. We can assess the exact same thing took place with the New Zealand. Again, second oil started turning around stock, started gaining momentum, but we’ve got to clear the T-cross long on both Aussie/US and New Zealand/US. Now, neither one of these two pairs has a lot of momentum using the predicted RSI.
New Zealand Dollar versus U.S. Dollar
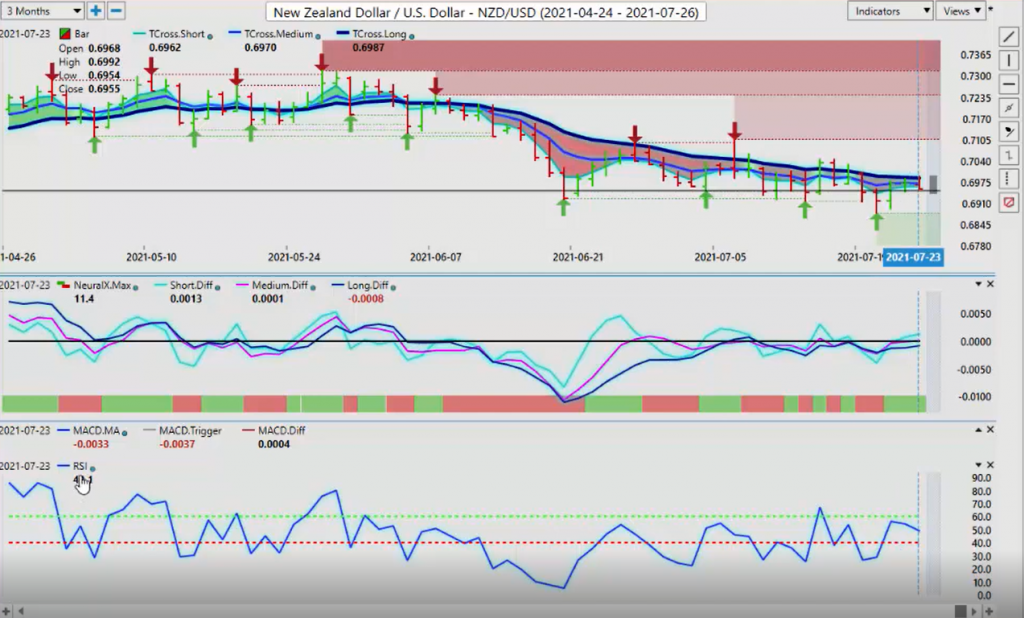
We want the predicted RSI at the very minimum above 50. We’re at 49.1. We’re not doing well there. The Aussie is actually a little bit worse because it’s not even holding above in between the 60-40 split. Now using the 60-40 split on the RSI is because we don’t want to get involved with trading overbought and oversold signals here, guys. That’s not the road we want to go down. We want to use the RSI what it’s originally intended for, to gauge … Its name says it all, doesn’t it? Relative strength index. We’re looking for it to show momentum in the market. When it gets to overbought or oversold, yes, that can be a concern. But there is a classic oversold signal right there, where the RSI is at 5.3.
It doesn’t get much lower than that. That just points to a corrective move, but ultimately this thing continue to move lower. You can see that if I just put a line in that predicted RSI and put a third line like this, we can’t get above that 50 line. Again, the Aussie is lacking momentum. The New Zealand is the stronger of the two. But guys, it’s virtually the same trade. We should expect another choppy volatile week coming up here. But again, we will be moving into summer trade in August and things are likely to slow down after we get through this last boat of volatility. With that said, this is the VantagePoint AI Market Outlook for the week of July, the 26, 2,000 and-