


Welcome to the Artificial Intelligence Outlook for Forex trading.
VIDEO TRANSCRIPT
Hello everyone, and welcome back. My name is Greg Frrman, and this is the VantagePoint AI Market Outlook for the week of August the 16th, 2021.
U.S. Dollar Index
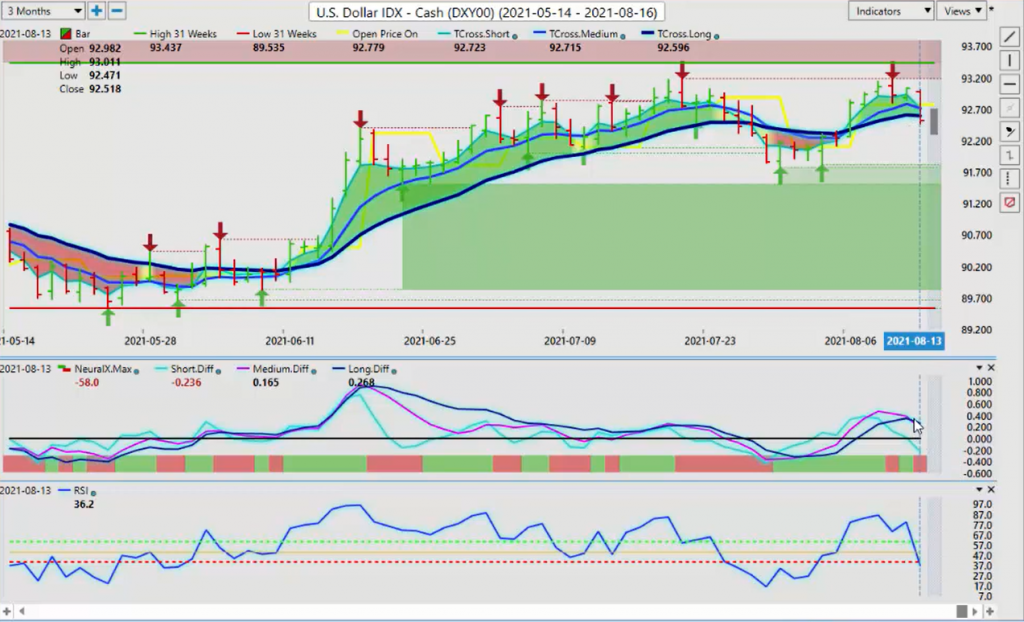
Now to get started this week, we’ll begin where we always do, with that very important US dollar index. Now, as I discussed in last week’s weekly outlook, a known cycle that I’ve seen in the dollar over the many years that I’ve been doing this is that the week after the non-farm payroll number, that real dollar demand dries up and the dollar is left to fend for itself. The dollar clearly did not do well. However, the event risk that we’re going to be dealing with this week is the FOMC minutes. Now those minutes could be still bullish for the dollar, but as we can see, the VantagePoint software with the medium-term crossing the long term predicted difference, with the neural index and a falling RSI, has led to a significant move lower on the dollar, on Wednesday, very much what was suggested in last week’s weekly outlook.
And again, this is a cycle in the dollar that most systems don’t pick up on, Waves, Fibonacci, this kind of thing, they don’t see this coming, it just all of a sudden turns. But the MA diff cross warned us that this was coming, the slope of the predicted difference on both, the main one, the medium-term predicted difference, this pink line as it starts to slope down and then crosses over the blue, that tells us the medium-term trend is weakening against the longer-term trend, making it somewhat easy on Euro longs, Great Britain US longs, US Canada shorts, et cetera.
But where we go from here now, this can also be, to some degree, profit-taking on Friday ahead of this coming event risk. So the level that we want to watch this week very, very closely is that T cross long, 9259, can we hold it below that or above that? That is the key thing.
Now if we click on our F8 in our software, we also have the long-predicted, another powerful pivot area, that’s coming in at 9275. Now assuming that the dollar will follow its normal cycles, we can look internally into some of these markets and say, okay, if the dollar does sell-off, what markets are likely going to follow with it? On a year-over-year basis, we can see that the ProShares ultra-short Euro, 98% correlation, US Singapore, US Israeli Shekel, and US-Swiss Franc, Metro Stock, US Mexican Peso. If the dollar goes down, the theory here is that these would follow.
Now again, the inverse correlated ones, you can also see that we’ve got Imperial Metals, Aussie US, Ausi Futures, New Zealand Dollar, New Zealand US Futures, the Euro, Euro US Dollar. So these currencies would all turn higher if the dollar moved lower, that’s the inverse correlation.
So when we look at this through the eyes of neural networks, we can get a better idea of what we can expect. And again, by clicking on the stock sector, I can click on the FOREX, I can go to ETFs, or to the futures markets. These are very, very powerful tools that in most cases trump conventional indicators, these inner market correlations can be very, very hard and very, very fast.
Now, we can also further assess that I continue to leave the 52 week look back on the screen, but I’ve modified it to 31 weeks. We’ve got the price on open, which is 9277, that’s the opening price for the week. So the dollar has actually closed down on the week, despite that very strong payroll number. But again, I did warn everybody of this cycle that I’ve seen when institutional funds dry up, they no longer are required to buy dollars, then the dollar must fend for itself.
Now there was a very, very well-written article in one of the VantagePoint blogs this week about the history of the US dollar, it’s decoupling from the gold standard, a very, very good read, and it just basically discusses fiat currencies. But, always remember with all of these fiat of currencies, we’re looking for the prettiest horse in the glue factory to some degree, and right now that doesn’t appear to be the US dollar.
Gold
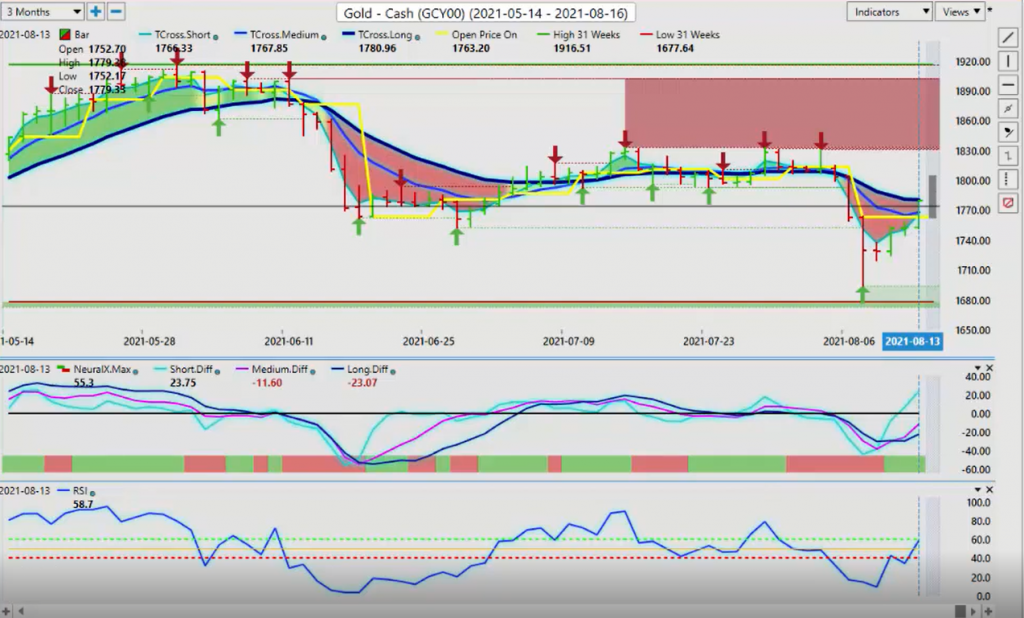
Now with the dollar moving lower, we can see that gold immediately responded to this. Now I will advise here that there were a number of discrepancies on the market open last week, and if you see anything funny with your broker around the price action between the market open, which would have been between six and seven o’clock last Sunday night. The market came all the way down to the level we anticipated, but it did it within the first bar, the one bar on your MetaTrader software.
Some of the European brokers, I noticed that they moved that price over into the second bar on the hourly bars. That actually didn’t happen, guys, it took place immediately in the one bar. As soon as the gold futures opened up around six, I believe on Sunday night, it immediately crashed lower, people running for the exit. But as you can see, that was very, very short-lived. Once again, the medium term crossing the long term predicted difference has taken us right back up, but much like that dollar index, we’re stalling here, right on the T cross long at 1780.
So it’s likely that gold is going to be waiting to get those FOMC minutes before it can overtake this level, but it certainly is a very, very strong recovery. And that also is consistent with the 31 week low, at 1677, that we discussed in last week’s weekly outlook. So a very good buying opportunity off here, but I prefer to wait for confirmation from the VantagePoint software with a powerful indicator, like the MA diff cross, but as you can see, the RSI is not overtaking the 60 level, so we’re losing momentum as we come up against a very, very strong resistance level at 1780.
Bitcoin
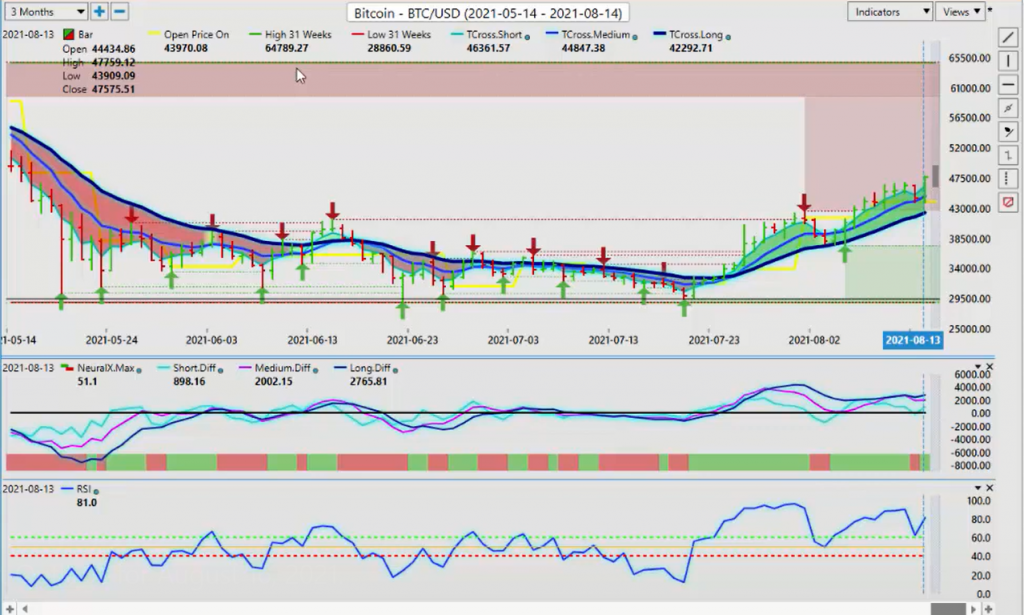
Now the star performer, yet again last week, and again, Bitcoin continues to outperform most other markets here. Now, despite the dollar strength, it was completely unfazed. Bitcoin continue to extend. We’ve had a nice move off that weekly opening price, that price on open, 43,970. Going into next week’s trading again, you can see, using the verified support zones, we don’t have a lot of resistance here, guys, between where the market currently is and the 31 week high. Now the 31 week high is 64,789. To be clear, I don’t think we’re going to get there next week, but it certainly does look promising that we can extend higher.
Now, again, as we back these charts out on Bitcoin, which I would strongly recommend you do, you can see the structure of this. So this resistance point right here is the one I’ve got my eye on, 59,558. If we continue to move towards that level and we fail just under that level, then you’re going to see, likely, a deeper corrective move on Bitcoin. But again, I would strongly advise everybody read that blog about the fee at currencies that was posted in the VantagePoint blog this past week, because that article does discuss Bitcoin at length, many of the things that I’ve discussed on here. The annualized return over the last 10 years, some 230% per year. It has been the top asset class, despite comments from Warren Buffet and some of the people that work for Warren Buffet. I truly believe that if you can read a chart, then you would be a Bitcoin buyer for at least the last three or four years.
So again, when we’re looking at this right now, that T cross long is at 40,292. If we click on our F8 in our software, we can get an additional pivot area, and that’s coming in at 45,499. But I will say that I still do see a very strong, positive correlation between Bitcoin and the US dollar. So this dollar weakness, if it does take a deeper corrective move, that could affect Bitcoin. So I would continue to watch that very closely, and these key vantage point levels.
S&P 500 Index
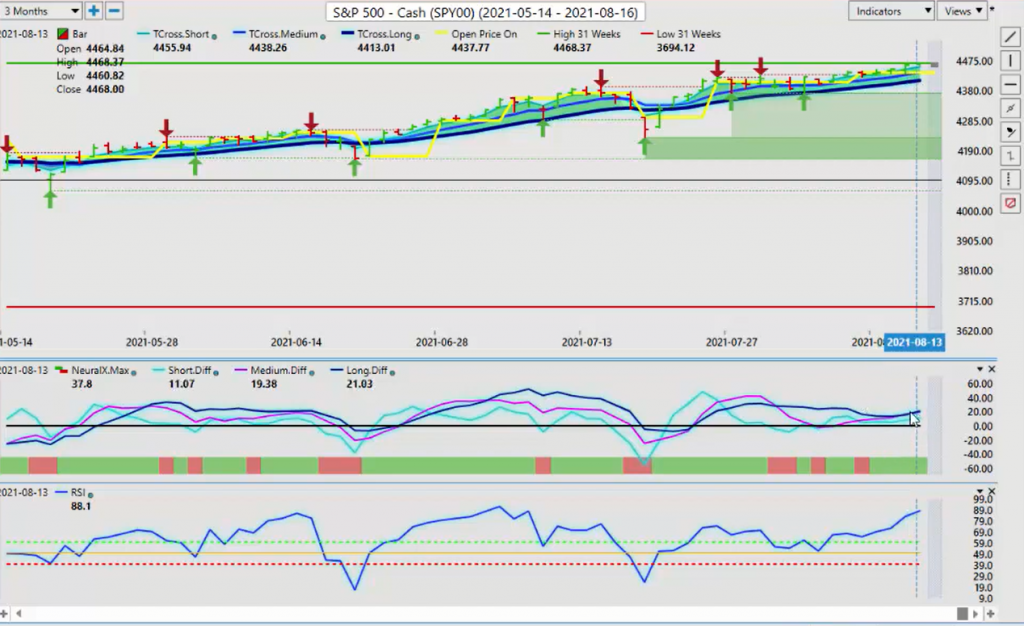
Now, when we look at stocks going into next week, more specifically, the S&P 500, there just doesn’t seem to be anything to stop this thing. It just keeps going back higher, we’re continuing to set new yearly tops, but again, it’s still continues to move higher. A little bit of concern here is the medium term and the predicted difference are basically piggybacking on each other. Neither one of them are budging. The RSI is at 88.1, but once again, guys, this is another example of why we stay away from overbought and oversold type of indicators. Because again, you’re trying to tell the market to stop going higher and go lower. We can see that when we hit an overbought condition like this, or we reach accumulation distribution, it was, again, the market just completely disregarded it and continued to advance.
So, longs clearly still the better play, but my concern is that at some point we are going to have a much deeper correction. Now that could come as early as Wednesday, if those FOMC minutes have a different rhetoric to them, that they are looking at raising rates sooner, the economy is doing better than what they thought. But that’s still, we’ve already had that guys, and the stocks continue to push higher.
So right now, the T cross long, 4413, is our major support level between bullish and bearish. When we click on again, our F8, we can see how the market is just basically bouncing off this blue line, almost on a daily basis. Each one of these represents a daily long trade here, and then going back to cash. That is a very effective way to use the software. We can further assess that the weekly opening price at 4437 easily closed above that also. So we’ll continue to monitor this, but for now, longs clearly are the better play, until such time as the Fed changes his tone.
Crude Oil
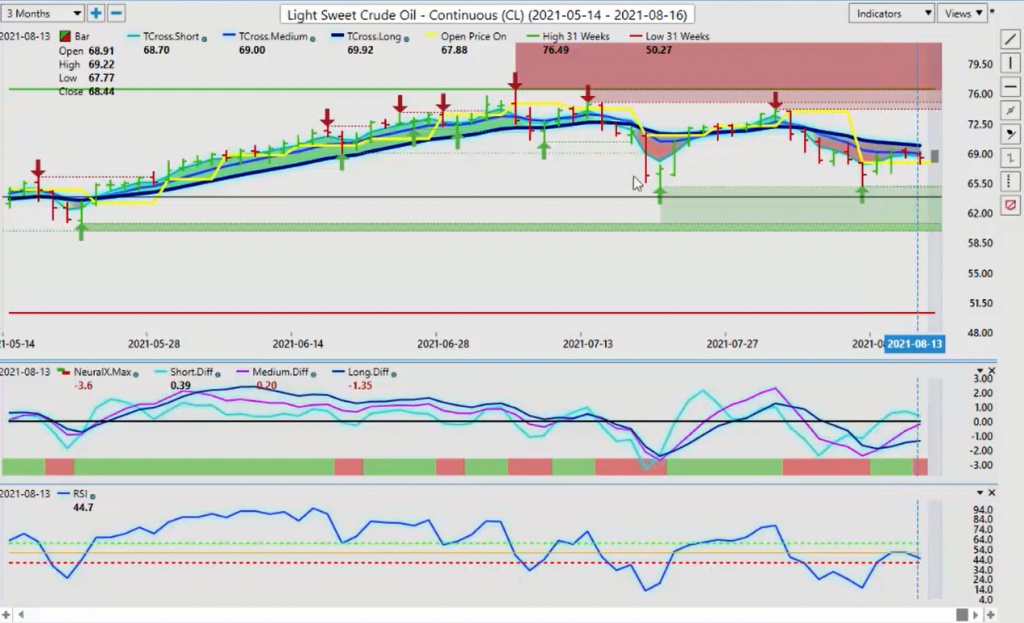
Now, as we look at light sweet crude oil, again, I believe that next week light sweet crude oil should turn around and continue to advance here. We had a very, very nice MA diff cross here just a few days ago. Pink line crossing over the blue line, that immediately, with virtually zero lag here guys, led to a move higher. But as you can see, we must clear this T cross long at 6962. If we can do that, then we should be able to get back up towards the 7423 mark without too much trouble. I would expect we would be there later in the week, after the non-farm payroll number.
Euro versus U.S. Dollar
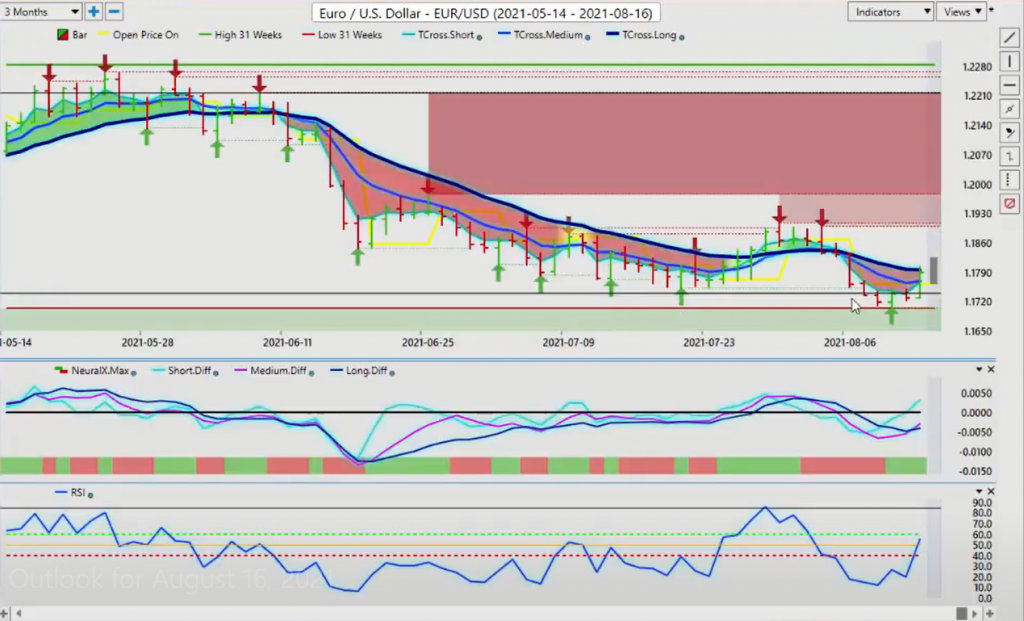
Now, as we look at some of our main currency groups here, starting with, of course, the number one traded FOREX pair, which is Euro US. Now, again, you don’t have to be a graduate from Harvard or throw 50 different indicators at this thing, you just need to understand, guys, overall ranges and inner market correlations. The Euro has a high correlation to gold, as gold started to rebound, and the dollar index started to tank on Wednesday, the Euro immediately responded by turning around. But once again, we have an MA diff cross with the neural index and a rising RSI. The Euro could be getting ready for a bigger push to the upside, but we must clear the T cross long at 1796. Be very cautious of a false break here because of those FOMC minutes.
So if we get a big push on the upside on Monday, which I suspect we will, that doesn’t mean it will still be there on Tuesday. So again, be very, very cautious. But if we can close above 1796, then we should not have too much trouble getting back up towards the 119 area. You can also, again, click on your F8 in the software, and you can find a very good entry point for Monday on the long side of this. What we’re doing is matching the long predicted at 11763, and then you can match that to the predicted low, which is 11764. Easy peasy guys, right or wrong, good, bad, or indifferent, you can buy off that particular level and make sure that your stock is below the 31 week low, which is 11704. That’s the way you would look for a trade setup. We do not use the predicted highs and predicted lows as stop-loss points, guys. We’re always using either the long-predicted or the T cross long or both.
And again, in this particular case, with that 31 week look back, all I’m looking for is the low of the year and the high of the year. The low of the year is that one down into that 11705 area. The high for the year, on the 31 week basis is 12284, this makes longs very attractive down at this particular level.
U.S. Dollar versus Swiss Franc
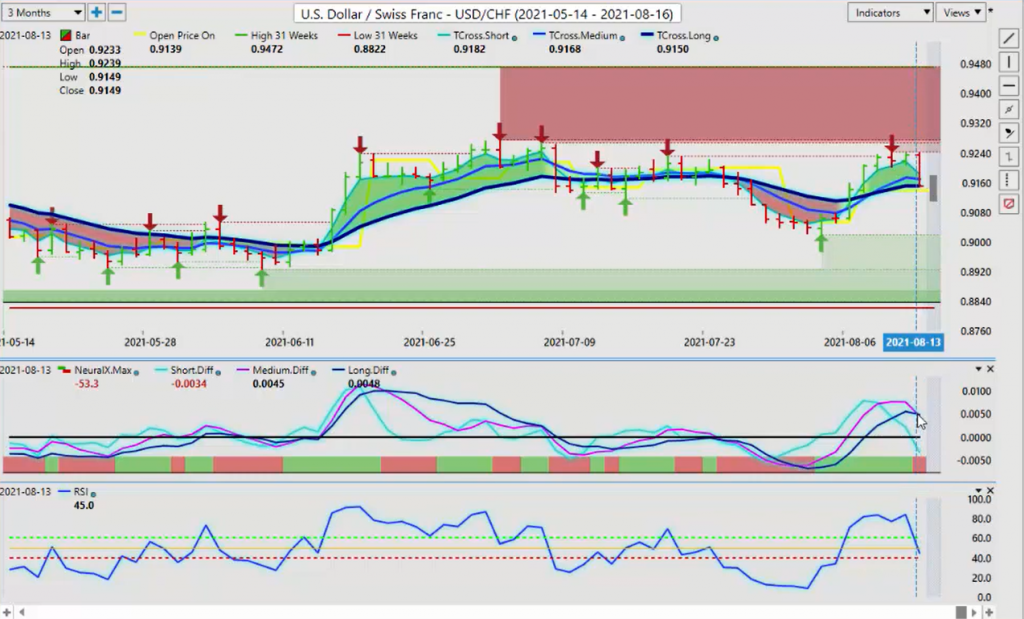
Now the same thing would apply to US Swiss Franc. You can see that it’s turning the other way, as the Euro goes higher than the US Swiss Franc, it turns lower. Now we’ve stalled right on the T cross long, which I don’t believe is a coincidence at all, 9150. So we’re looking for 9150 to hold, but I think that that’s unlikely, because as you can see, before the market opens on Sunday night, this video is being done on Saturday, guys, ahead of the market. This is an outlook, not a recap of something that already happened. So we’re looking at this from a trade perspective set up, that this is warning us that the medium term trend is weakening further, and the neural index is in agreement. We’ve got a falling RSI. The only thing holding this thing up from falling off a cliff is 9150, which is the T cross long.
So if we break down below that, we’re likely going to take another stab at the 9018 level. I would say that there’s a strong, it’s very likely that’s going to happen. The only one that could change the direction, the course of this move, would of course be the Fed.
British Pound versus U.S Dollar
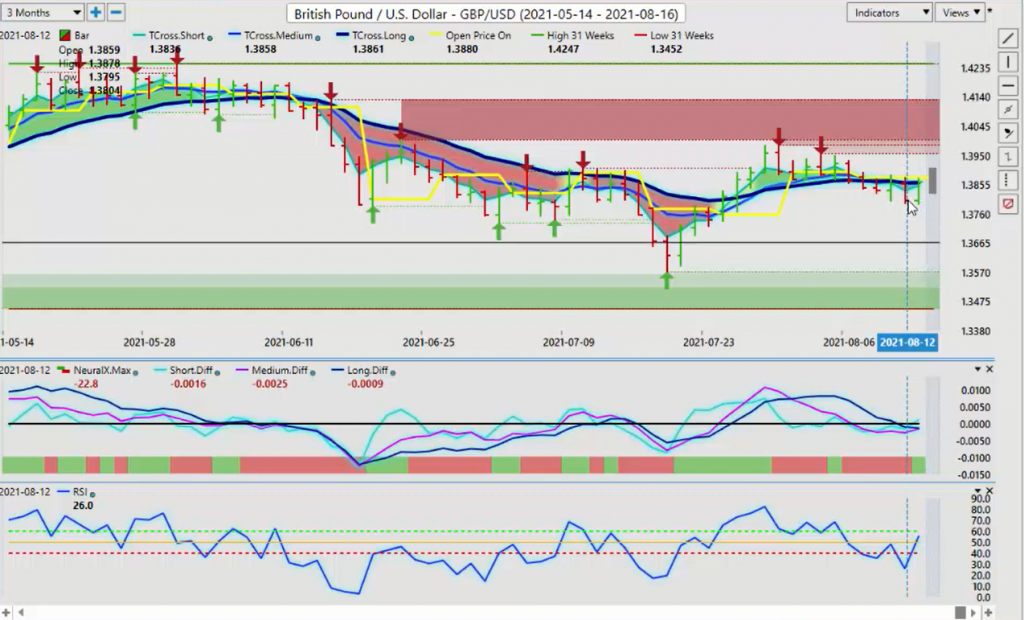
Now with the British Pound US dollar, once again, you can see that we’ve closed basically right around the weekly open, this point on time is set to the weekly. Now, again, we’ve got our medium term crossing our long term, or about to cross the long term predicted difference with the neural index, but it’s struggling in here. Right now, I can see some pretty good support stacking up down here around this low, around 13795. So again, if we click on our F8, then we can see that our predicted low is 13829. I think longs are very reasonable to start the week based around this particular setup.
Now, in this case, our 31 week low is 13452, our 31 week high is 14247. So it would appear that we’re at least going to take another stab at this 140 level, but this 140 level has been very, very stiff resistance, and I’m not convinced that we’re quite ready yet to break through that level, but longs carry a slight edge to begin the week.
U.S. Dollar versus Japanese Yen
Now with the dollar yen, usually some say it’s a very good barometer for measuring dollar strength. I think it’s great for measuring gold and some of the other commodity markets, but as you can see, the dollar yen started to really struggle on Wednesday, the Tuesday after the non-farm payroll number, where I suggested that monthly pattern that I’ve seen. And it’s not a hundred percent, but it sure is about 80 to 85%, that when that institutional money is no longer looking for US dollars to settle government pensions, pay government employees, settle trade balances, then the dollar just mysteriously seems to just disappear. Now, the dollar bulls were just saying, this is it, the dollar is going to break out. As you remember, I was not in that camp then, and I’m not in that camp now, because I’ve studied these seasonal patterns. And these patterns tell me that the dollar very well may go higher, but not until it does one of these first.
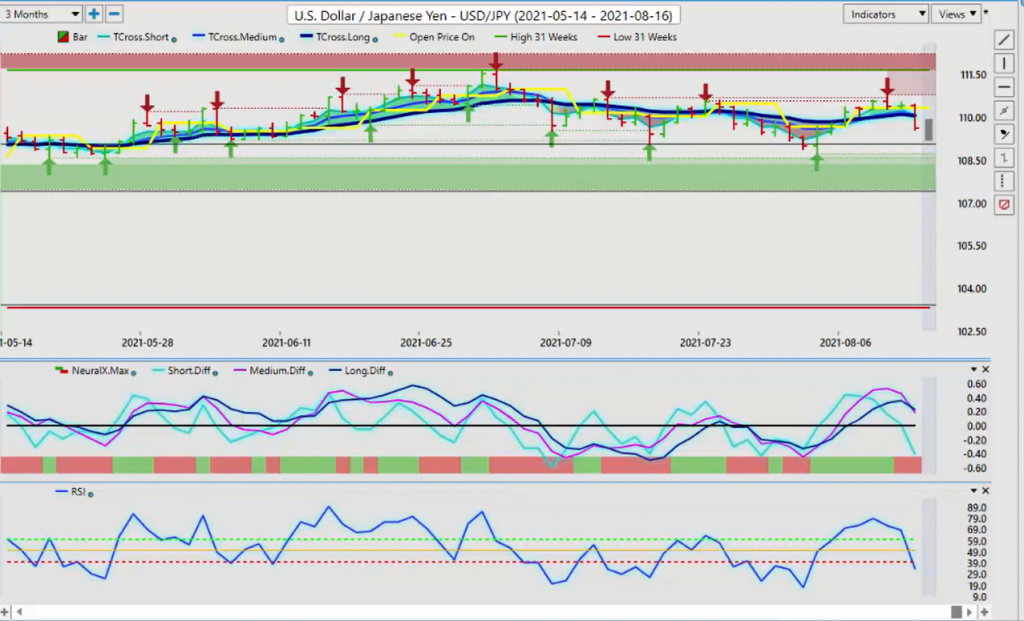
So again, the dollar yen, struggling with that weekly open, then it broke down below the T cross long at 11004, so that now becomes our resistance point to begin the week. But again, that MA diff cross, with the neural index and an RSI that is showing downward momentum, this also could point to another spike in gold prices because we know that there’s a very high correlation between the Japanese yen and gold contracts, and it’s a positive one. So if we look under the hood a little bit with this dollar yen, you can see that there’s a lot of different things. Gold miner ETFs, the spider gold shares, and a number of these other pairs, and if you look at the direct inner market, the positive correlations, and then the inverse correlations, you can see that all of these different markets down here, and we can go through that from the quarterly. You can see you’ve got Royal Gold, you’ve got Kirkland Lake Gold, I don’t even know what that is, Barrick Gold.
So on a quarterly basis, there’s a very high correlation to the yen and gold prices, and that’s where it shows up in this particular pair. So we don’t want to discount that because if we understand in our market correlations, we can skip some of the indicators, so to speak, and we can get directly to the trade if we can anticipate. So if the dollar yen does continue to fall lower, than gold is likely to break above the aforementioned level.
Now, if we anticipate the equities will continue to move higher, and that would likely mean that oil is going to recover, then US Canada shorts obviously would be the better play. Now, if we look at this past week, this yellow line represents the weekly opening price. You will get that in your VantagePoint software on Monday night, when the market closes, it will show you the close from Monday and the open for Monday. That’s the start of the trading week.
U.S. Dollar versus Canadian Dollar
The point in time, or the open price on time, we’ll put that in there automatically, so when we look at this now, we can see that US Canada is looking quite bearish yet again. Another MA diff cross with the neural index, there isn’t a lot of momentum here though. So what we’ll be looking for from this is for the RSI to break down below that 60 level so we can start building momentum to the downside. But again, in summer driving season, I know we’ve got the Delta variant and things are getting a little shaky again, but the oil companies are not going to let the prices at the pump go lower at this time, not usually until end of September or October that oil prices will start backing off a little bit. So barring anything more from the COVID virus thing, the Delta variant, then oil equity should climb, both of those being positive for the Canadian dollar. And remember the Bank of Canada has been very vocal that they plan on hiking before the FOMC does. So that’s another advantage for the Canadian dollar here.
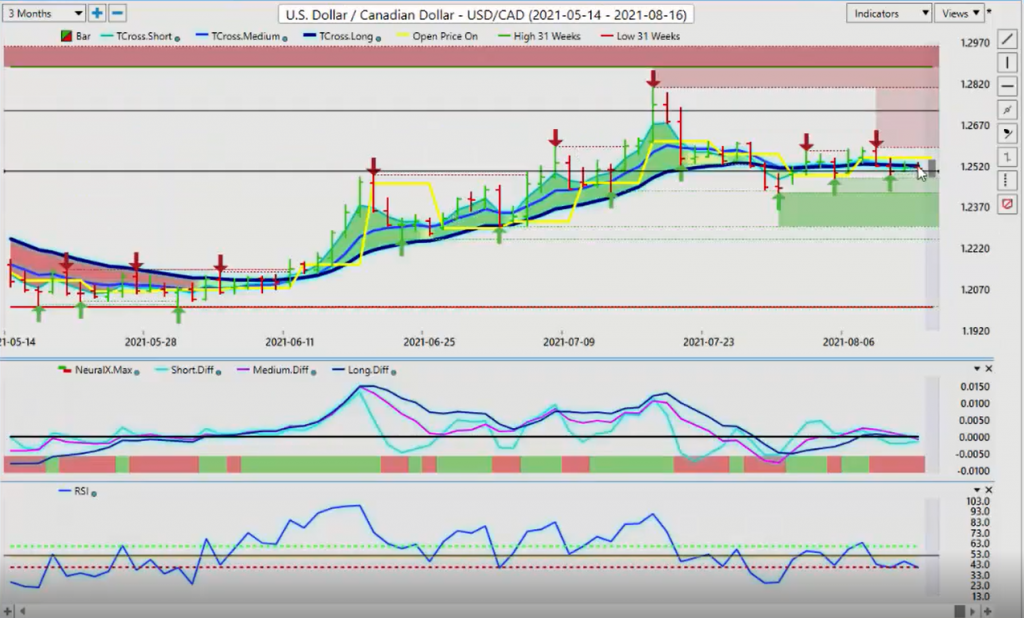
The only thing that could change this is if oil crashes and stocks crash, that’s what will ultimately drive this particular pair higher. Very sensitive to, again, oil prices and equities. But for now, I would say that a retest of this low is imminent, down at this 12422 area. And just remember, or if you’ve been in the VantagePoint live training room, I’ve also shown people these crazy reversals with US Canada, and I see them almost every week, and there it is, big bull bar on Monday, and then on Tuesday, a big sell off. So whatever it often does on Monday, this pair often does the exact opposite on Tuesday. The same applies to oil prices. I’ve seen a very similar pattern with light sweet crude oil.
Australian Dollar versus U.S. Dollar
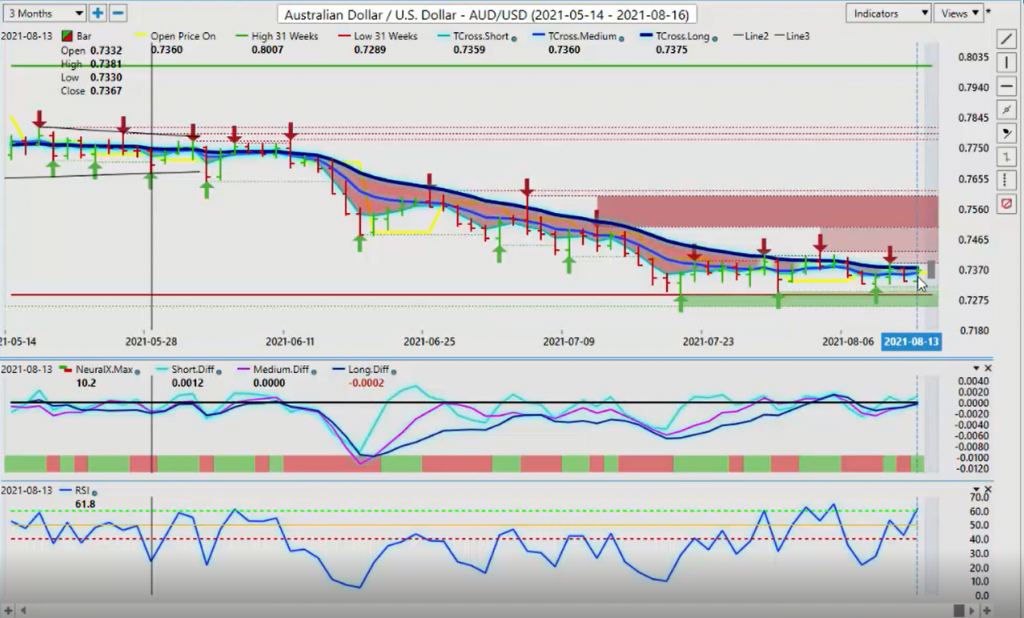
Now, as we look at the Aussie US and New Zealand US, very, very similar trade, once again, the Aussie needs a bigger spike, it needs gold recovering, and it needs equities to keep moving, but we still don’t have a lot of buyers with the Aussie US, but we may be coming into a bottom, but this low, this 31 week low, which is now coming in at 7289, just make sure that if you are buying this pair, you’re keeping your stops below that 31 week low. But right now, the immediate problem this pair has is getting past 7375. The 7375 is the T cross long, and we see something very, very similar with the New Zealand currency.
New Zealand Dollar versus U.S. Dollar
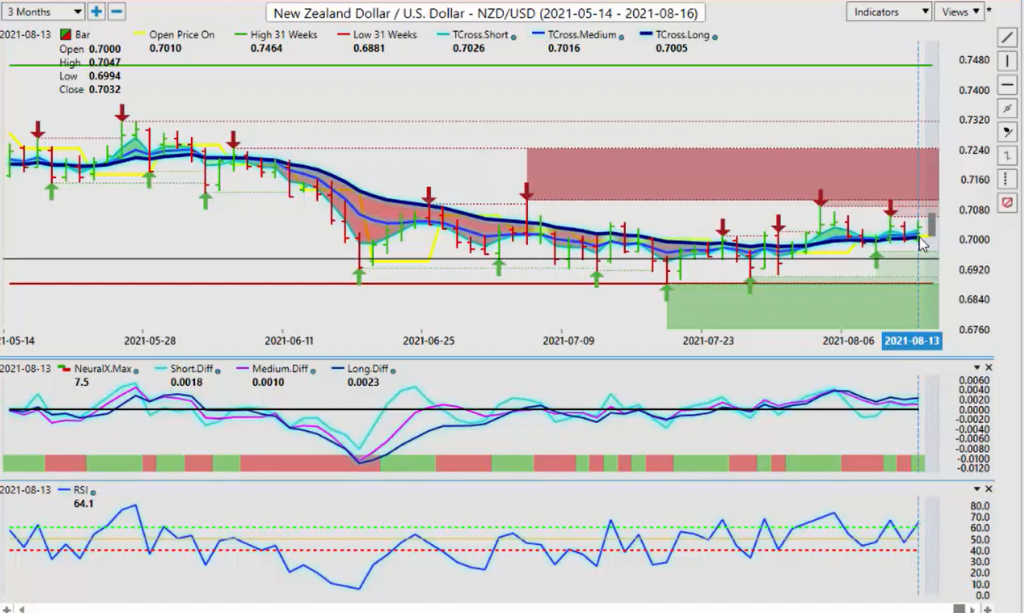
But the New Zealand currency, between these two pairs, this is a rarity that I actually see different signals. In most cases, these two pairs, they go up and down together. But you’ve got the RBA, the Bank of New Zealand, there’s a lot of rhetoric going back and forth which is causing a little bit of a variance. But also the Australia New Zealand cross pair is definitely affecting these two. So with the New Zealand, you’re looking for this particular pair to hold above the 70 cent mark. If it can hold above 70 cents, then the New Zealand should be able to move higher on dollar weakness. But the Aussie still may be better value.
But again, the main event risk that we’re going to be dealing with this week is going to be the FOMC minutes, and I would always expect the unexpected with them. So with that said, this is the VantagePoint AI Market Outlook for the week of August the 16th, 2021.


